This week Nike, Inc. (NKE) officially entered a bear market when the 50EMA dropped below the 200EMA, the first time in over three years. While this is my nominal definition of a bear market, it is useful as an objective measure of price performance, and it is similar to the widely recognized (and more dramatically named) "death cross," which is derived from simple moving averages. It is not necessarily an actionable SELL signal, rather it warns that the long-term environment has turned bearish for this stock. The last time the 50EMA was below the 200EMA was over three years ago.
A positive feature on the chart is that NKE is not yet officially in a down trend -- we have a top beneath a top (November and March), but price needs to drop below the February low to give us a bottom beneath a bottom and establish the down trend. You'll notice that I ignored the up spike in December when I drew the declining tops line because I chose to consider it to be an outlier.
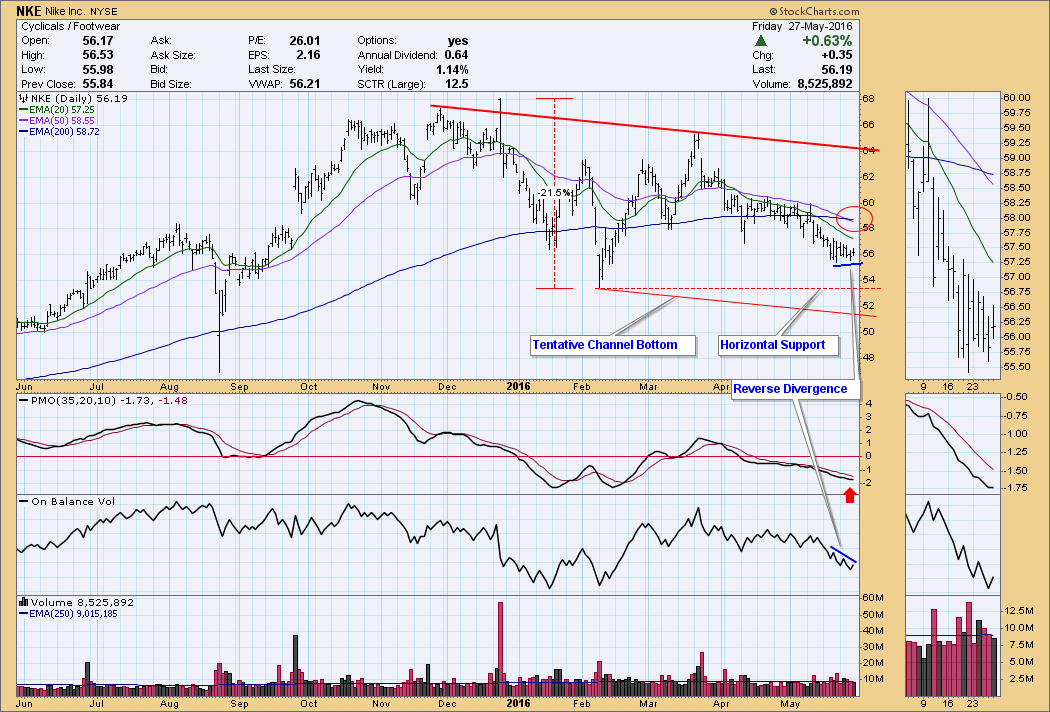
The declining tops line, drawn across the November and March tops, defines the top of a potential declining trend channel. As for the establishment of a channel bottom, I drew a line from the February low, that was parallel with the declining tops line, to serve as a tentative downside target for channel support. A horizontal line drawn from the same low also sets another tentative support line.
Another positive feature is the fact that the PMO is trying to turn up. The PMO is sufficiently oversold so that a PMO bottom would be a good short-term early warning that a price bottom was in the making.
Yet another positive is the reverse divergence between short-term rising price bottoms compared to the declining OBV tops. This indicates an internal washout with price refusing to follow declining volume.
CONCLUSION: The 50/200EMA downside crossover is an objective long-term indication that the environment has turned negative for NKE and that lower prices are likely. Immediate support can be seen at about 53.00 and 51.00, but the longer-term implication of the nominal bear market condition is that an extended decline is in progress and likely to continue. In spite of this, there are some shorter-term indications that price action of the last week or so may be the start of a bottom. Short-term upside opportunity may be at hand, but be aware of the bear.
Technical analysis is a windsock, not a crystal ball.


