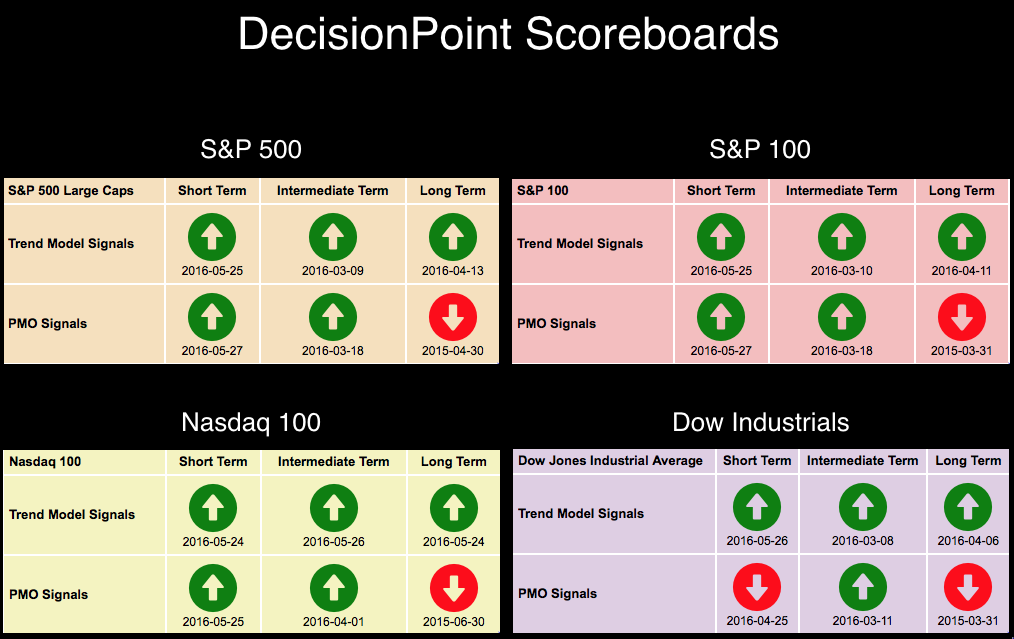
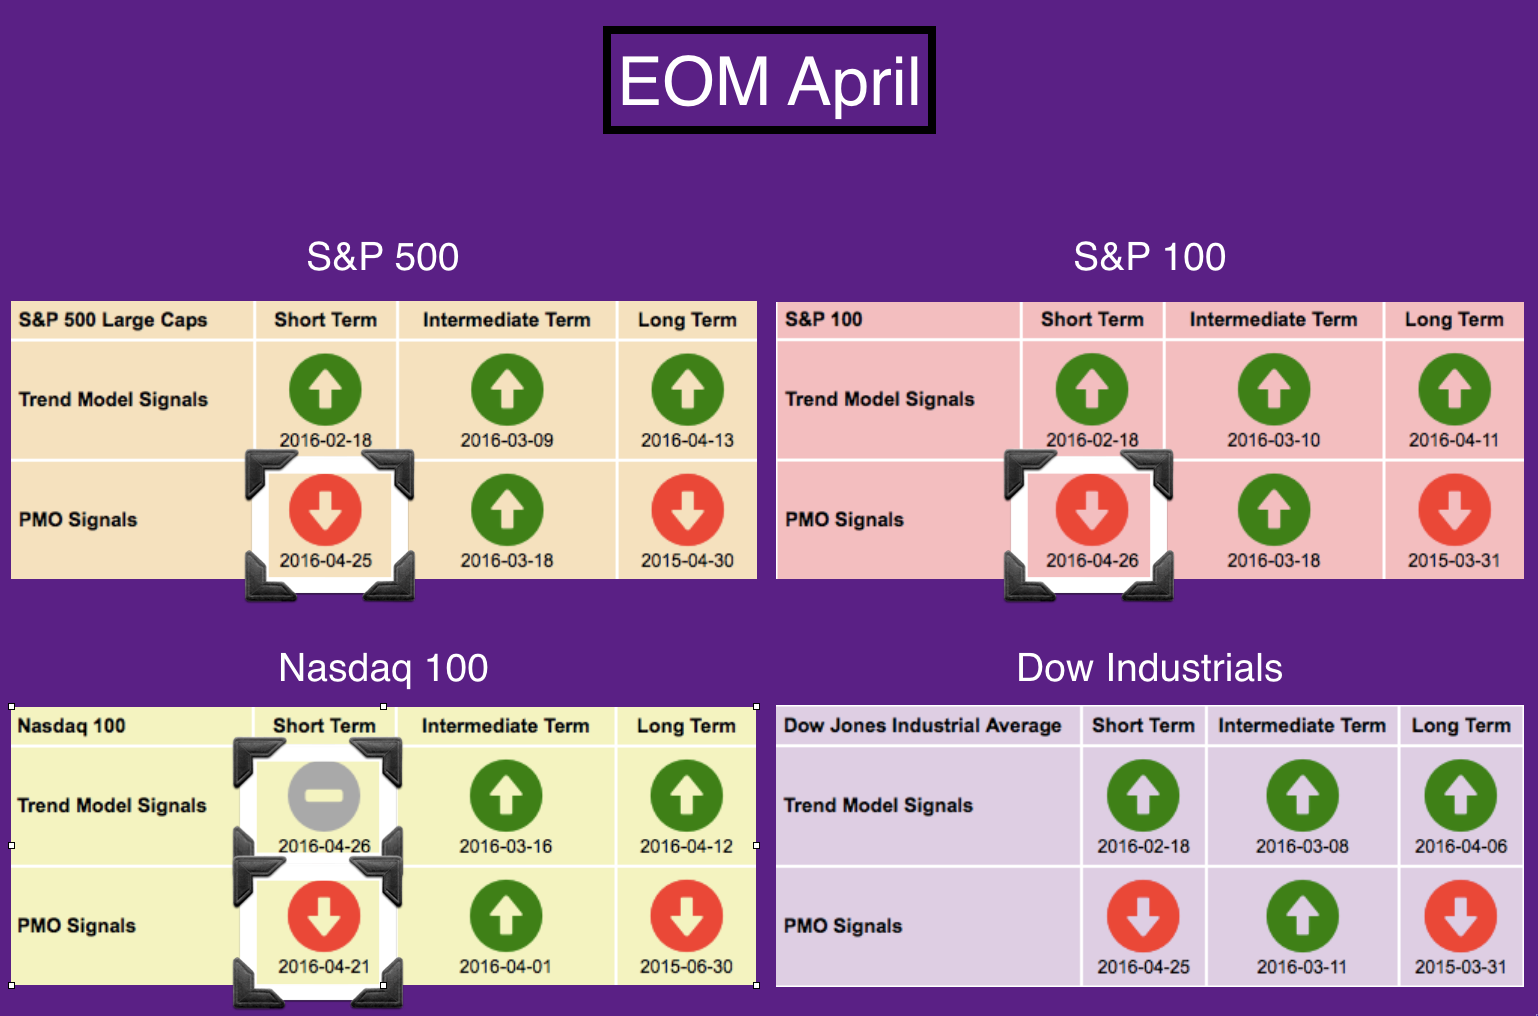
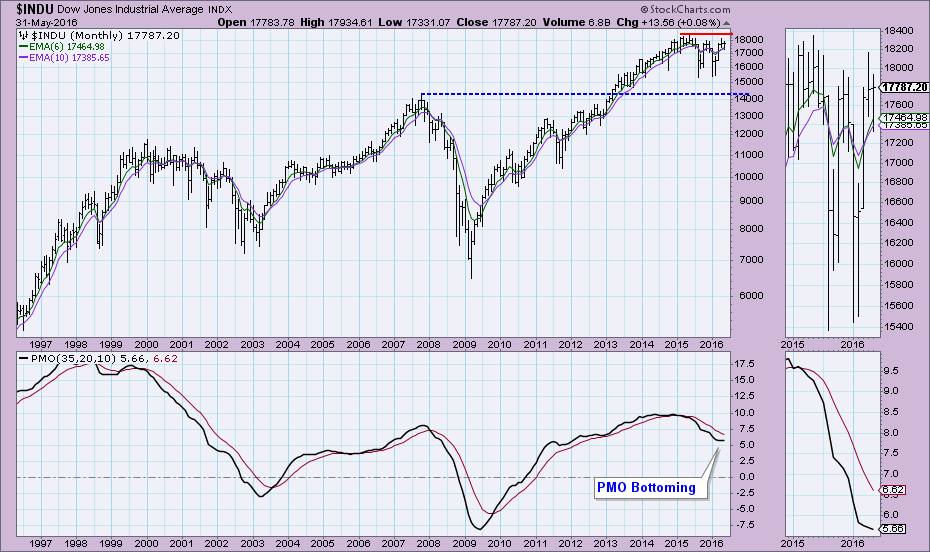
Below is the current status of the DecisionPoint Scoreboards. You'll note in the Scoreboard from April (purple) that there were only a few changes that occurred by month-end. The most interesting would be the two new BUY signals on the NDX. The Dow now has the most negative Scoreboard; however, the short-term Price Momentum Oscillator (PMO) will likely move to a BUY signal very soon to bring it even with the other large cap indexes.
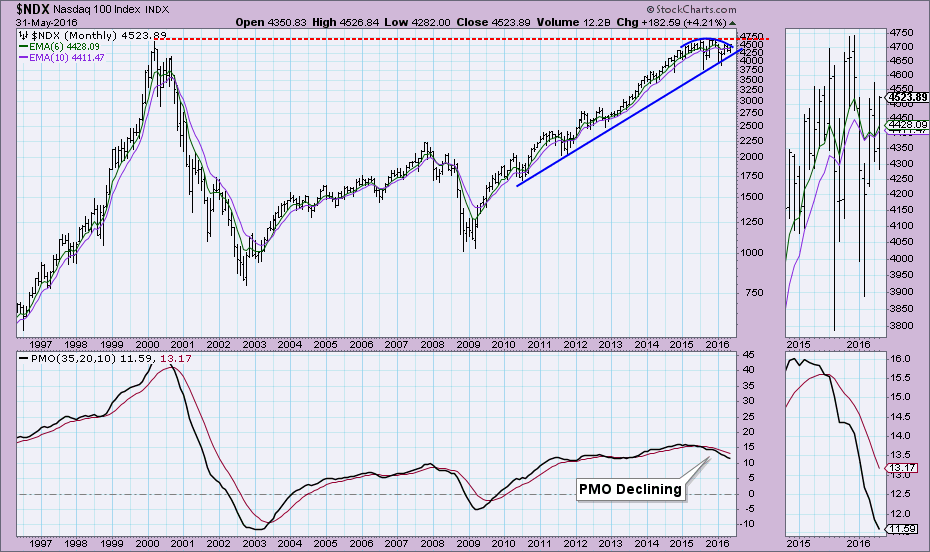
For the month, the NDX was up over 4% while the Dow finished the month nearly unchanged. A lagging technology sector is no longer an issue. One issue for the NDX would be the rounded top that is still visible. The monthly PMO is still declining, but overall the monthly PMO has been flat for the past five years which tells us that momentum or acceleration has been steady in the long term. The rising bottoms trend line could be an important tool in determining whether a correction is on tap. For now price is staying above that area of support. The other issue is overhead resistance that has been holding strong since late 2014. Either way, price will have to break down below rising bottoms support or break out above all-time highs in the next month or two. The declining PMO and current SELL signal suggest the break down scenario.
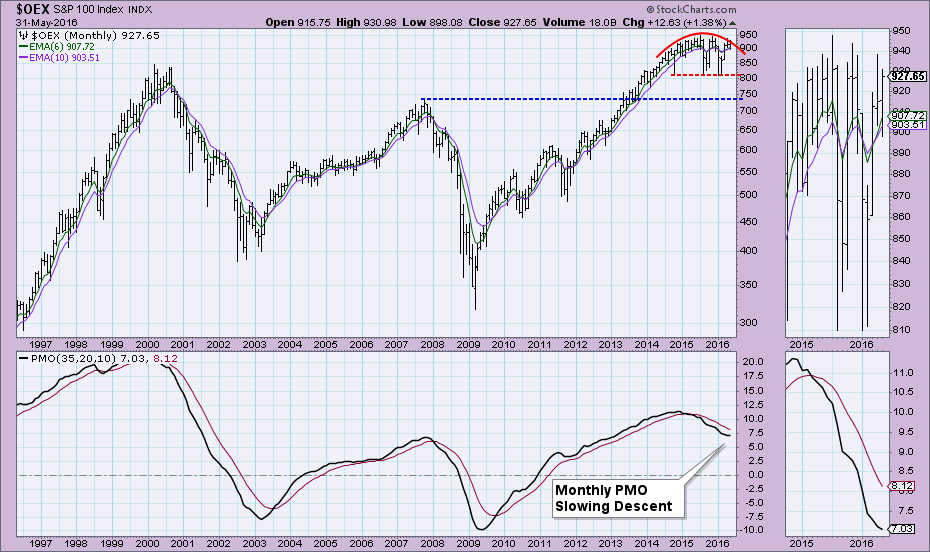
The OEX has a similar configuration with a bearish rounded top. In the case of the OEX, support lies at the 2014/2015/2016 lows. The OEX and SPX were up over 1.25% in May-- very small in comparison to the NDX. Good news is that the monthly PMO is decelerating somewhat and could be ready to bottom.
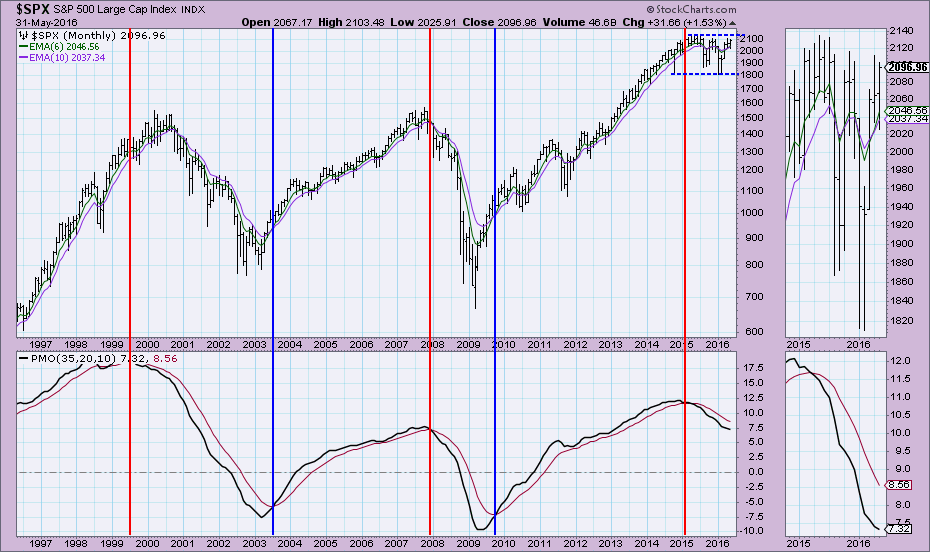
The SPX monthly chart has a similar feel to the OEX chart, only there really isn't a bearish rounded top visible. Instead we can see a very well-defined trading range between 1800 and about 2150. Price is near the top of the range. The monthly PMO is not configured to support a breakout at this time.
The Dow's PMO looks more healthy than the other three. It has nearly bottomed. So despite a nearly unchanged price, momentum is shifting positively.
Conclusion: The monthly charts for the DP Chart Gallery indexes are mostly neutral. The monthly PMOs are decelerating or bottoming, but overhead resistance is so far too difficult to overcome. The Scoreboards are getting more bullish in all three timeframes. Overhead resistance is the key. The likelihood of a sustained bull market advance will increase significantly if monthly PMOs bottom in June as they appear they want to.
Come check out the DecisionPoint Report with Erin Heim on Wednesdays and Fridays at 7:00p EST, a fast-paced 30-minute review of the current markets mid-week and week-end. The archives and registration links are on the Homepage under “What’s New”.
Technical Analysis is a windsock, not a crystal ball.
Happy Charting!
- Erin


