The free DecisionPoint Market Indicator (DPMI) ChartPack includes numerous indicator sets for major indexes and sectors. Today I'm concentrating on the On Balance Volume indicator set which is made up of the Climactic Volume Indicator (CVI), Short-Term Volume Oscillator (STVO) and the Volume Trend Oscillator (VTO). Generally, I review these indicators on separate charts based on their timeframe. The beauty of the OBV indicator set is that you can compare indicators in three different timeframes on the same chart. The NDX has struggled in comparison to the other major indexes that we cover in the DecisionPoint Chart Galleries. The question is whether the NDX will carry the markets lower on the back of its weakness or will it recover sooner, keeping the other indexes steady or rising.
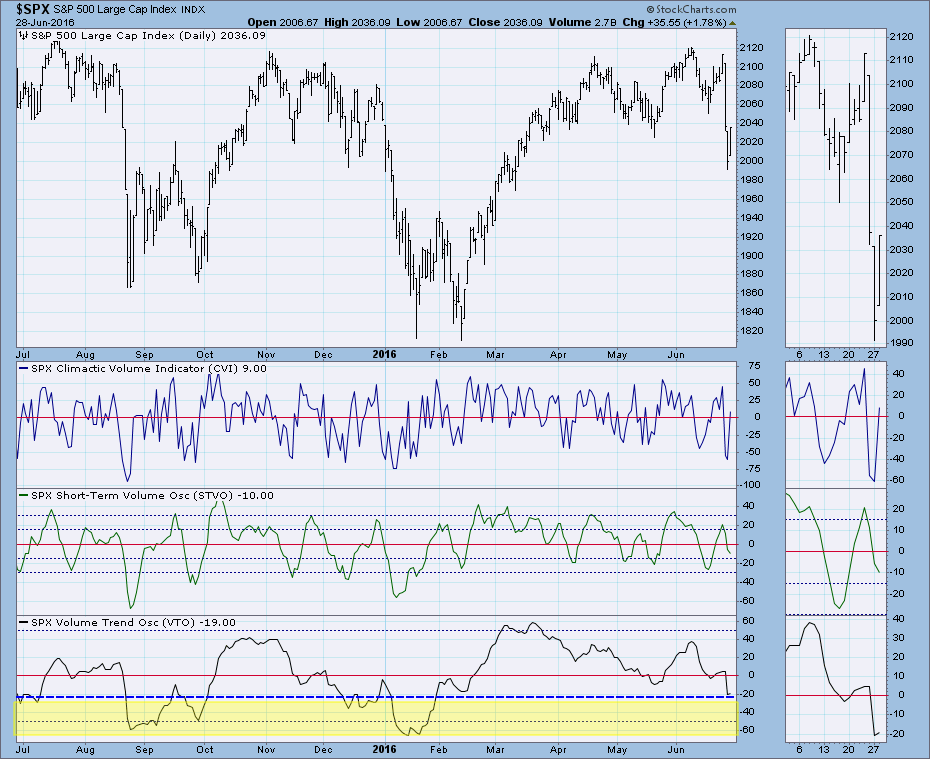
The OBV suite for the SPX shows us that the CVI (ultra-short term) is in neutral, but both the STVO (short-term) and the VTO (intermediate-term) are in need of more decompression and suggest more downside is on the way. We can see that after the previous deep corrections, the STVO and VTO stretched past the typical bottom of their ranges. In any case, both of those indicators are still not at the bottom of even their normal ranges. This suggests more downside for the short and intermediate terms.
Interestingly, the VTO on the NDX has already reached the bottom of its normal range and could be telling us there is some intermediate-term upside potential. However, it has also stretched past its normal range during the last two deep corrections and it could certainly do so this time around. However, seeing it at the bottom of its range decelerating could be considered intermediate-term bullish for the NDX. In the short term, the STVO still needs to move lower before reaching the bottom of its range. The CVI overbought/oversold spikes suggest buying and selling exhaustions (see my article from last Thursday for more information), but with a reading in neutral territory, the CVI is considered neutral.
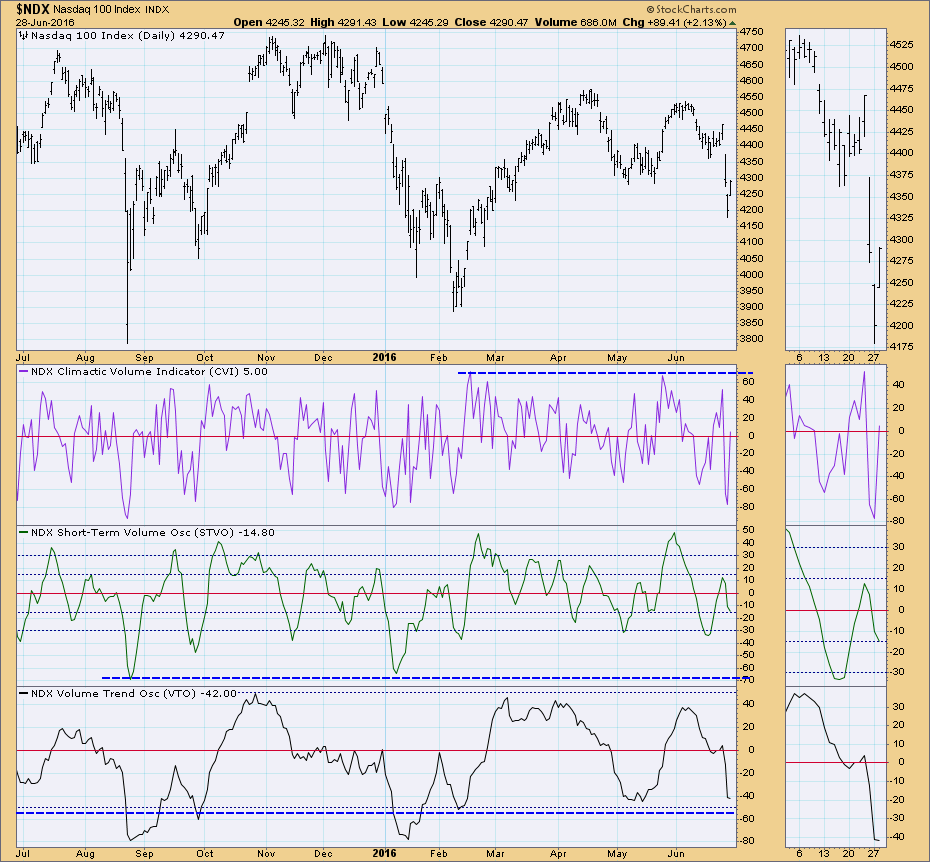
Conclusion: The VTO on the NDX is now at the bottom of its range and could suggest upside potential in the intermediate term. However, in extreme circumstances similar to what we have now, this indicator can move lower. Short-term conditions are bearish as readings are not near the bottom of the range for either the NDX or SPX. We need to watch the short-term indicators. When they reach the bottom of their range, intermediate-term indicators will probably do so as well. That will be the time for opportunity. Right now, the correction needs to shake itself out.
Come check out the DecisionPoint Report with Erin Heim on Wednesdays and Fridays at 7:00p EST, a fast-paced 30-minute review of the current markets mid-week and week-end. The archives and registration links are on the Homepage under “What’s New”.
Technical Analysis is a windsock, not a crystal ball.
Happy Charting!
- Erin


