Gold has been trending upward since the beginning of this year, establishing a well-defined rising trend channel. More recently it rallied off this July's price low, making another run for the top of the channel, but it failed just short of the previous high, forming a double top. This failure to reach the top of the channel implies that price will likely head down toward the bottom of the channel as part of the normal give and take of the rising trend. Strengthening this argument is the dotted rising trend line that marks the bottom of a rising wedge pattern, a bearish pattern that usually resolves downward.
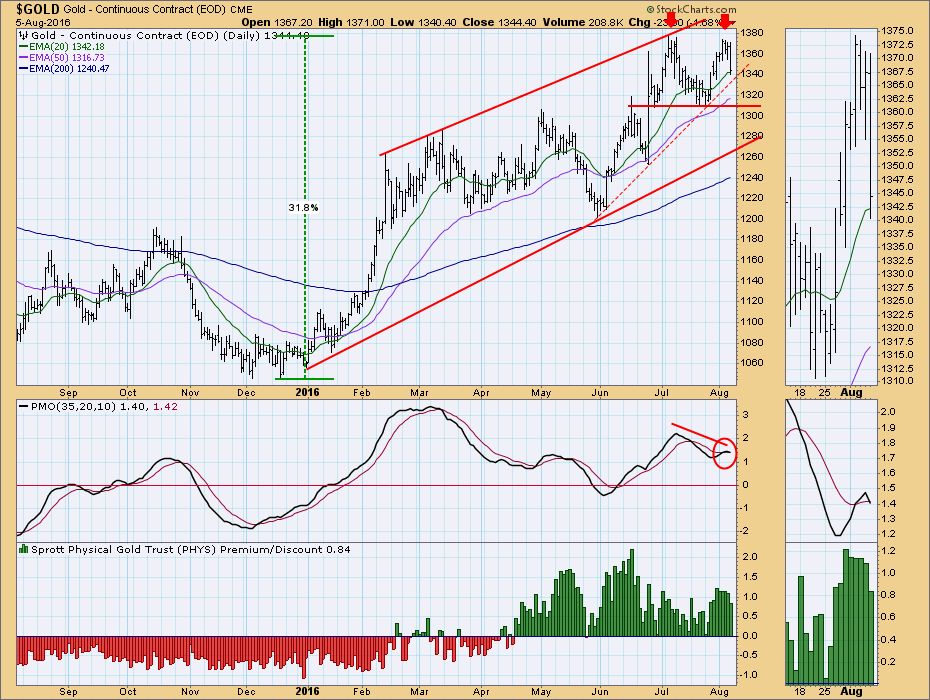
The PMO has topped, forming a negative divergence from the previous PMO top. Also, the PMO passed down through its signal line, generating a PMO crossover SELL signal.
Sentiment, as measured by the premium for PHYS, a closed-end fund that owns physical gold, has been positive for about four months, and it it is likely to remain positive throughout any price correction. While extremely high bullish sentiment can be bearish for price, modestly positive sentiment is normal, and desirable, when price is rallying.
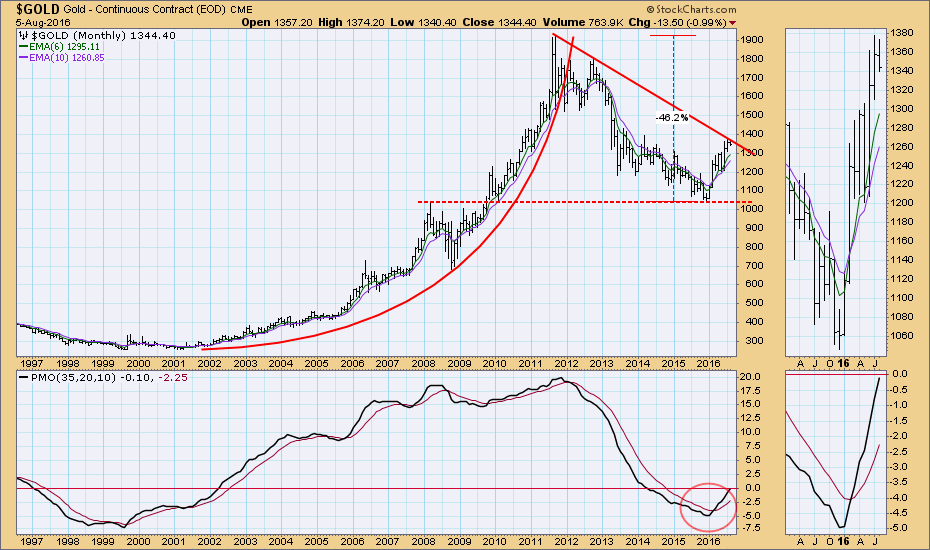
As usual, I like to look at a long-term chart to put current price action into a broader context. As it turns out, this year's rally marks the end of a four-year bear market for gold, and the overhead resistance encountered on the daily chart happens to be the top of a long-term triangle formation. From this perspective, it looks as if a pullback would help generate some compression from which to launch a resistance penetrating upthrust.
 As of 6/7/2016 Gold is on an Intermediate-Term Trend Model BUY signal. The Long-Term Trend Model, which informs our long-term outlook, is on a BUY signal as of 2/22/2016, so our long-term posture is bullish.
CONCLUSION: Other than the relatively short-term bearish issues I have discussed, the picture for gold is very bullish. Since strong overhead resistance has been encountered, I think that gold has begun a pullback that could take price down to the bottom of the rising trend channel drawn on the daily chart, around 1280. Once the correction is completed, we should then look for another attack on the overhead resistance.
Technical analysis is a windsock, not a crystal ball.
