 DecisionPoint Reports are created everyday but not many know how to use them to quickly find investments. While reviewing the ETF Tracker spreadsheet, I realized there were some interesting attention flags. Let me enlighten you on a very underused investment tool available to members.
While Price Momentum Oscillator (PMO) scans are great for screening investment opportunities, many times the number of results can be overwhelming. I'd like to suggest you download the ETF Tracker spreadsheet or even the ETF Lite Tracker which has even fewer members from the DP Reports blog. Just click on the "DP Chart Books and Spreadsheets" link. (I'll show you how to use ChartBooks soon!)
 The beauty of a downloaded spreadsheet is the ability to sort on anything. Today I sorted on the "Signal Flag" column. This column will point out when there are changes in the relationship between the PMO and Price Momentum Model (PMM). The flags I like to see are the "BUY?" or "SELL?".
Here is an excerpt of the spreadsheet after I sorted on "Signal Flag" (column 'V').
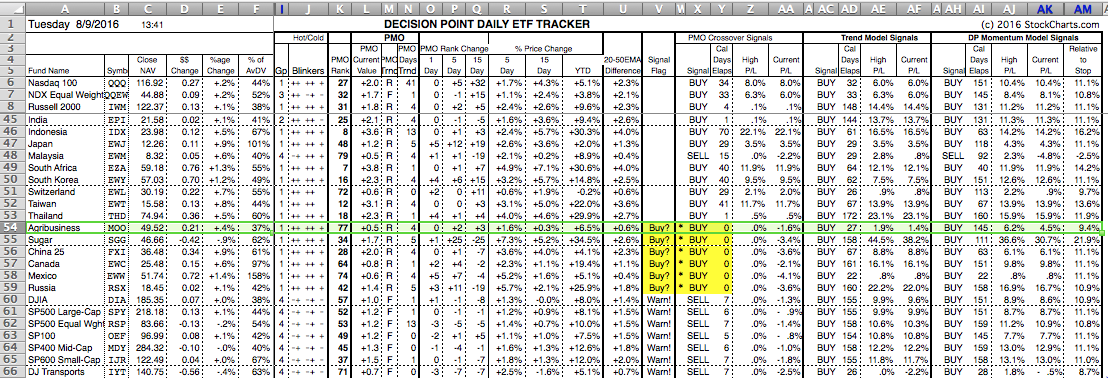
I picked out Agribusiness (MOO) because I see that it just went on a new PMO BUY signal, the PMO has been rising 4 days (column 'M' and 'N') and I liked the symbol name (generally not part of my analysis strategy, but for writing the blog it did stand out). I decided to call up the weekly chart first, followed by the daily chart for closer inspection.
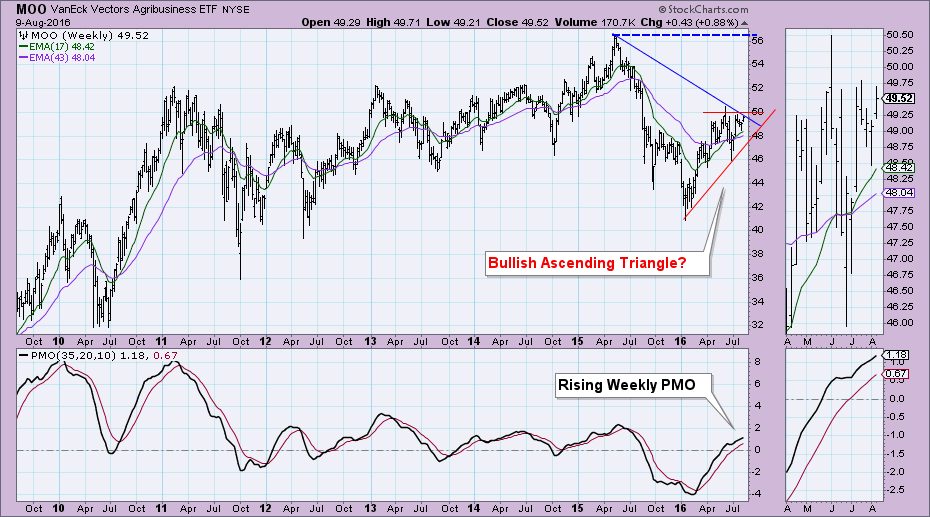
The intermediate-term picture is positive and shows MOO reaching a decision point. The PMO is rising and isn't at the top of its range. There is a possible ascending triangle formation which is bullish. Of concern is that price has now reached overhead resistance at both $50 and along the declining tops trendline.
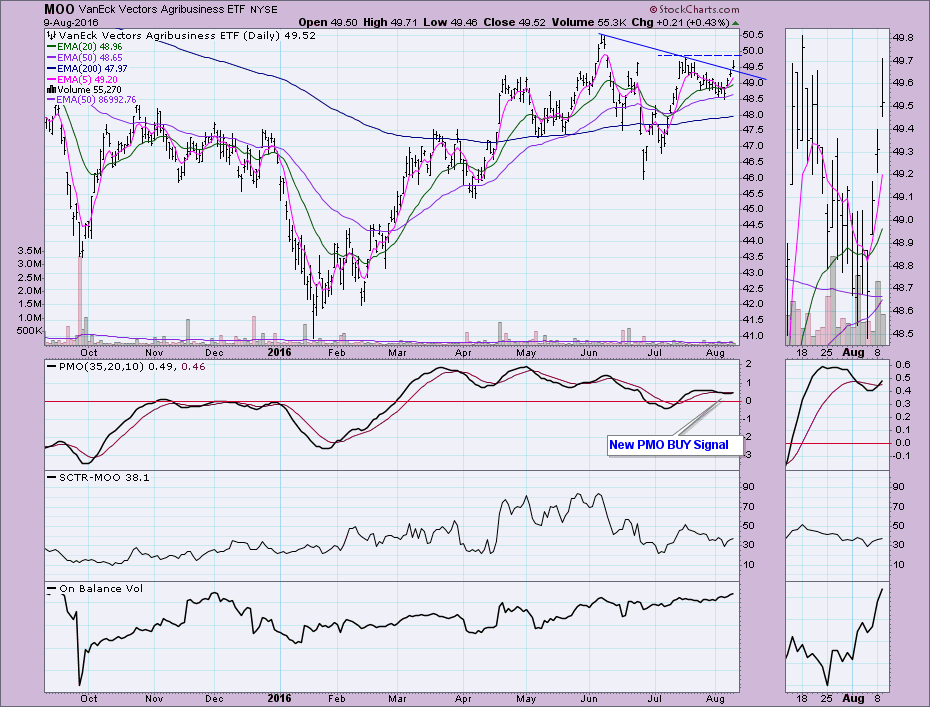
The daily chart shows that price has broken above the declining tops trendline but is nearing overhead resistance at about $50. The OBV is trending higher, but I'd like to see the SCTR climb higher and price needs to breakout above resistance at $50.
Conclusion: Using the DP Reports ETF Tracker spreadsheet, I was able to quickly narrow in on a bullish set-up among the ETFs I follow closely. MOO is an excellent "watch list" candidate or email alert addition. A trigger could be set based on price reaching or surpassing a level of overhead resistance or support. Unfortunately, it is "members-only" content, but it's just one more reason to sign up for a trial. I'll continue to update you on information flags I find in these reports right here so be sure to subscribe to this blog for email updates.
Come check out the DecisionPoint Report with Erin Heim on Wednesdays and Fridays at 7:00p EST, a fast-paced 30-minute review of the current markets mid-week and week-end. The archives and registration links are on the Homepage under “Webinars”.
Technical Analysis is a windsock, not a crystal ball.
Happy Charting!
- Erin


