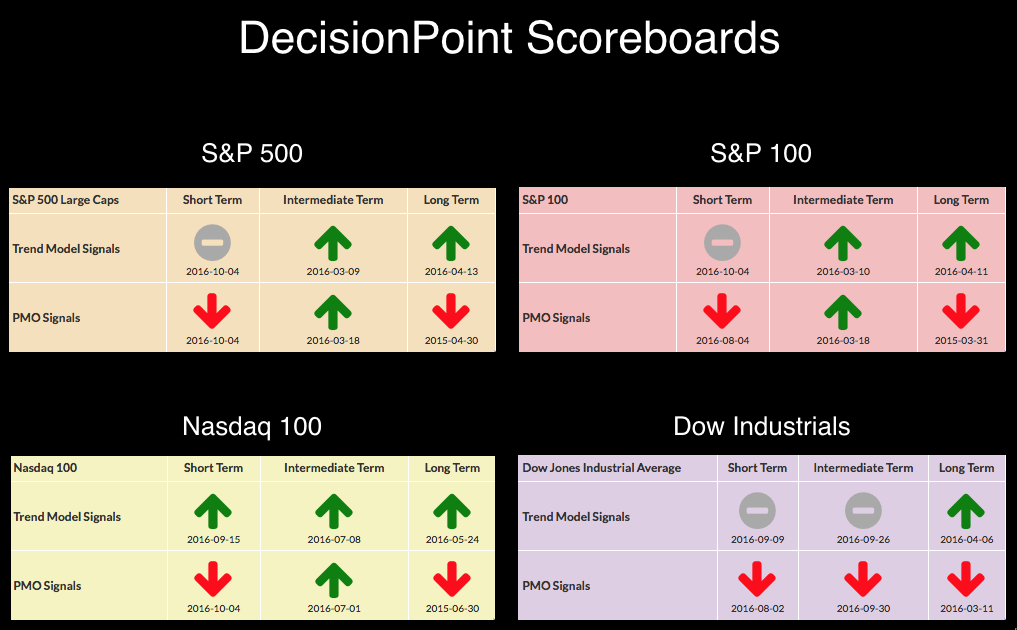
Since the DecisionPoint Scoreboards launched over a year ago, they have been wildly popular. The most current Scoreboards are below. Each of the four Scoreboards headline each index's Chart Gallery. These Scoreboards provide a very quick visual look at what the current trends and momentum readings are in three timeframes. With their newfound popularity, my email box has been filling with, "Can you add the ______ index to your Scoreboards?" Well, I really can't but there is no reason you can't have your own Scoreboards for whatever index, ETF, stock, etc. that you wish. Here's how:
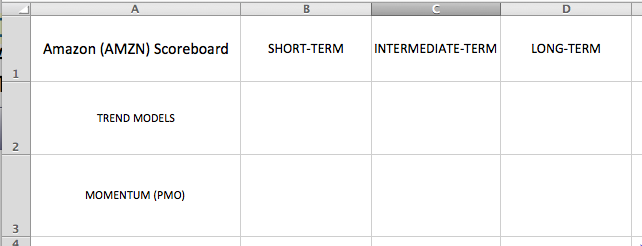
Dissecting a Scoreboard you can see that the timeframes are listed at the top and Trend (Trend Models) and Momentum (Price Momentum Oscillator (PMO)). I've created a very simple spreadsheet that you can recreate or you can simply use graph paper and a pencil.
Let's start with the top row, the Trend Model signals. Trend Model signals are ALL located on the daily chart. The Short-Term signal is generated by 5/20-EMA crossovers, the Intermediate-Term signal is generated by 20/50-EMA crossovers and the Long-Term is generated by 50/200-EMA crossovers. (For more about how signals are generated, please review the Trend Models in ChartSchool). If you are familiar with our Trend Models, this will be a snap. Look at the daily chart for Amazon (AMZN):
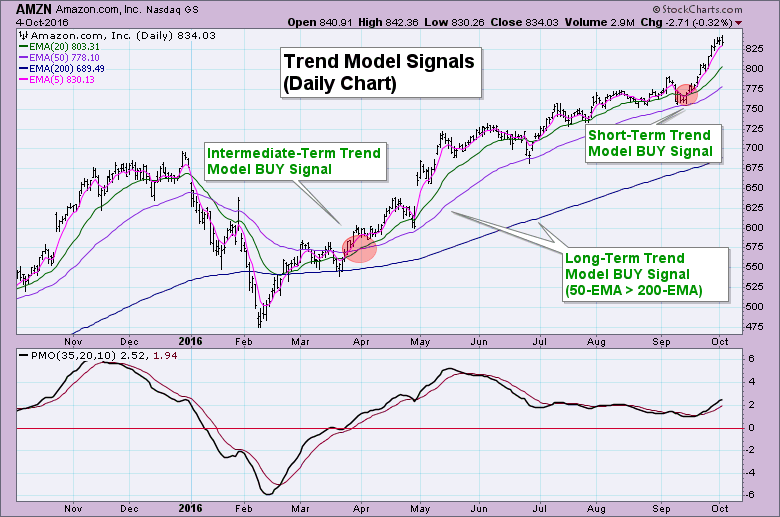
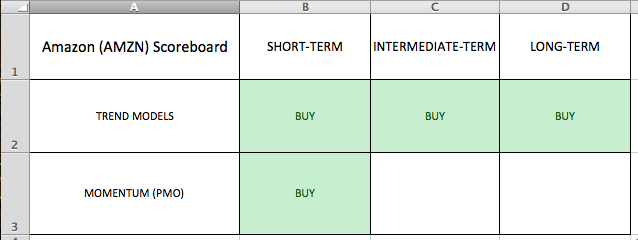
All the answers for the top row of our Scoreboard are below. Looks like Amazon is in a nice rising trend based on the three Trend Model BUY signals. Let's fill in our Scoreboard:

Next we need to fill in the bottom row with which way momentum is flowing in all three timeframes. You'll find the Short-Term PMO signal on the daily chart:
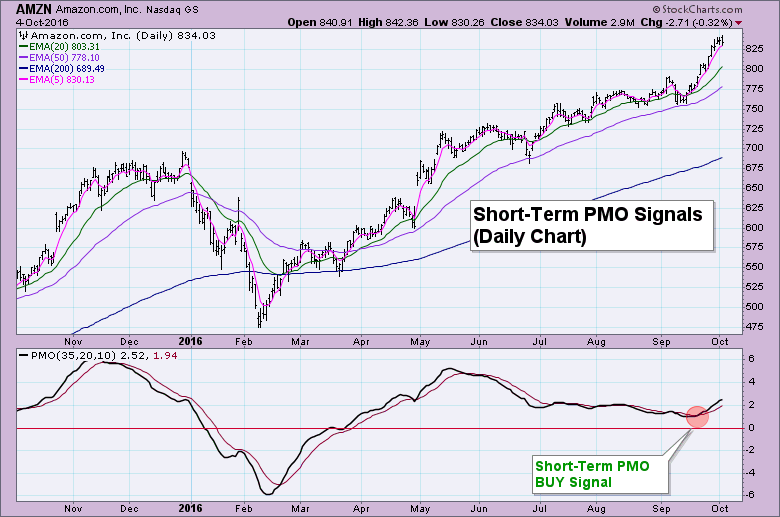
Here is where it goes on your Scoreboard:
For the intermediate-term PMO signals, you go to the weekly chart:
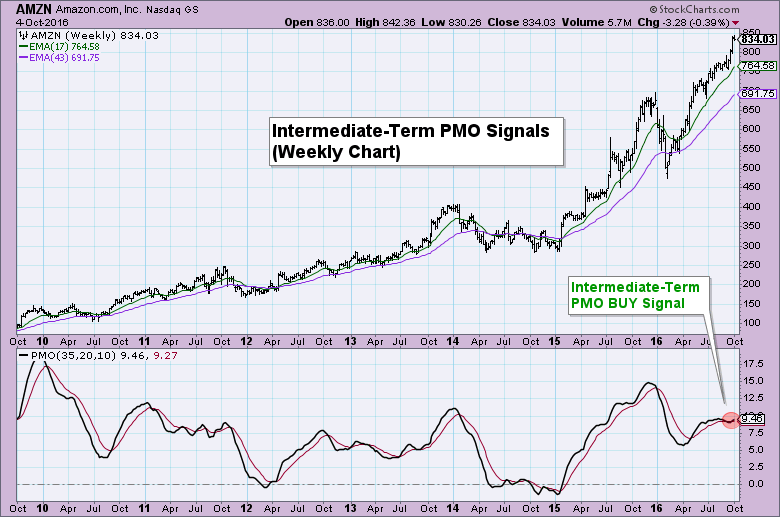
Our Scoreboard looks like this:
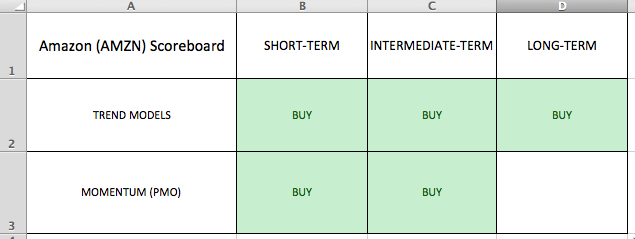
Finally, you'll find the long-term PMO signals on the monthly chart:
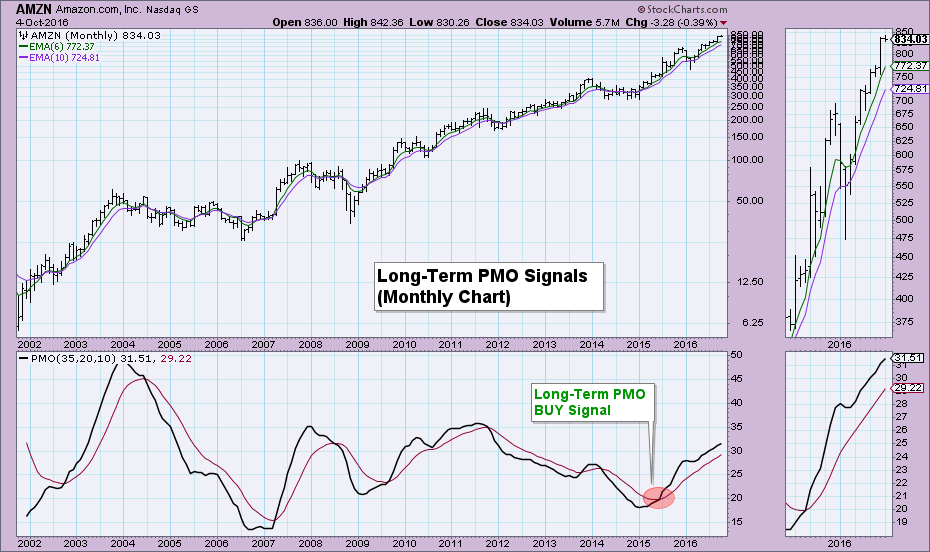
Our finished Amazon Scoreboard:
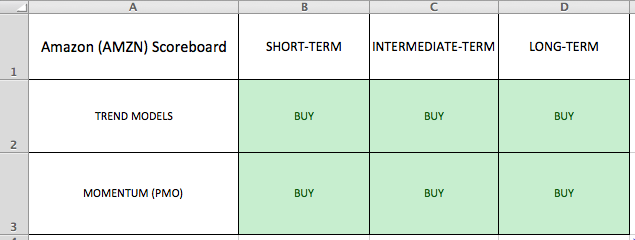
What does this say about Amazon? It's in a strong rising trend in all three timeframes and momentum is positive across the board. This is a stock with internal strength and long-term potential. Compare Amazon's Scoreboard to the large-cap index Scoreboards at the top of this blog article. You can see that momentum is a problem for all four of the indexes and trends are breaking down in the short term. Create your own Scoreboards and feel free to send them to me (Twitter: @_DecisionPoint) with any questions.
The NEW DecisionPoint LIVE public ChartList has launched! Click on the link and you'll find webinar charts annotated just before the program. Additional "chart spotlights" will be included at the top of the list. Be sure and bookmark it!
Come check out the DecisionPoint Report with Erin Heim on Wednesdays and Fridays at 7:00p EST, a fast-paced 30-minute review of the current markets mid-week and week-end. The archives and registration links are on the Homepage under “Webinars”.
Technical Analysis is a windsock, not a crystal ball.
Happy Charting!
- Erin


