 In Tuesday's blog, "YOU to Can Create DP Scoreboards - Visually Stunning", I explained to you how to find the signals on the charts to create your own DP Scoreboards like the ones located in the DP Chart Galleries. The questions that followed were how to get the signals on your Scoreboards without having to look at all of the charts everyday. There are two ways to do this, one is to run scans for these crossovers daily or two, set up Technical Alerts that will email you only when crossovers are generated. This is how I update my Scoreboards.
I want to start out with an important caveat. In order to create scans and alerts, you must be an Extra member or above. Don't stop reading if you're not, the purpose of this article is not sales but offers members who have asked about my alerts a definition of how to use them. However, the material may convince you to upgrade as it is one of THE most powerful tools offered at StockCharts.com.
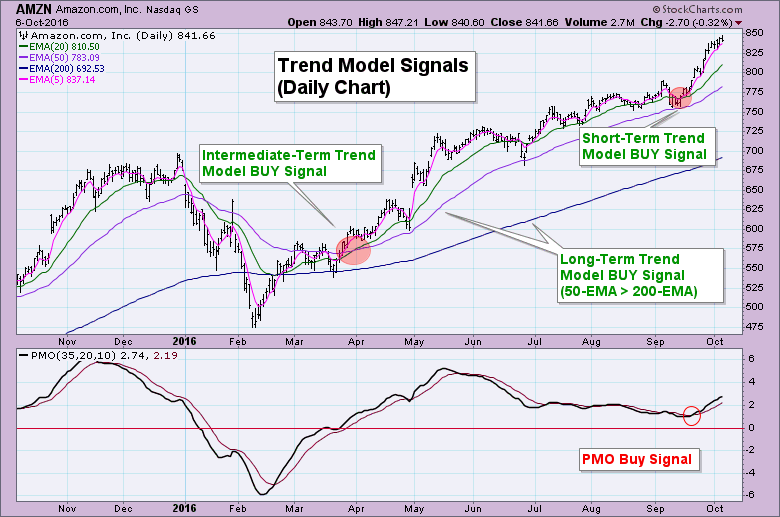
In order for a signal to change on a DP Scoreboard, it requires a crossover. For the Trend Models, use crossovers of the 5/20/50/200-EMAs. For the Price Momentum Oscillator (PMO), use crossovers on daily, weekly and monthly charts. Here is a daily chart of Amazon marking some of the relevant crossovers.
Your first step to creating your DecisionPoint technical alerts might be creating the scan first. I prefer this as it gives me the option of running it manually during the day if I want to. To create a scan, go to the "Members" tab. You'll find the scanning workbench and technical alert workbench links here (if you are an Extra member or above).
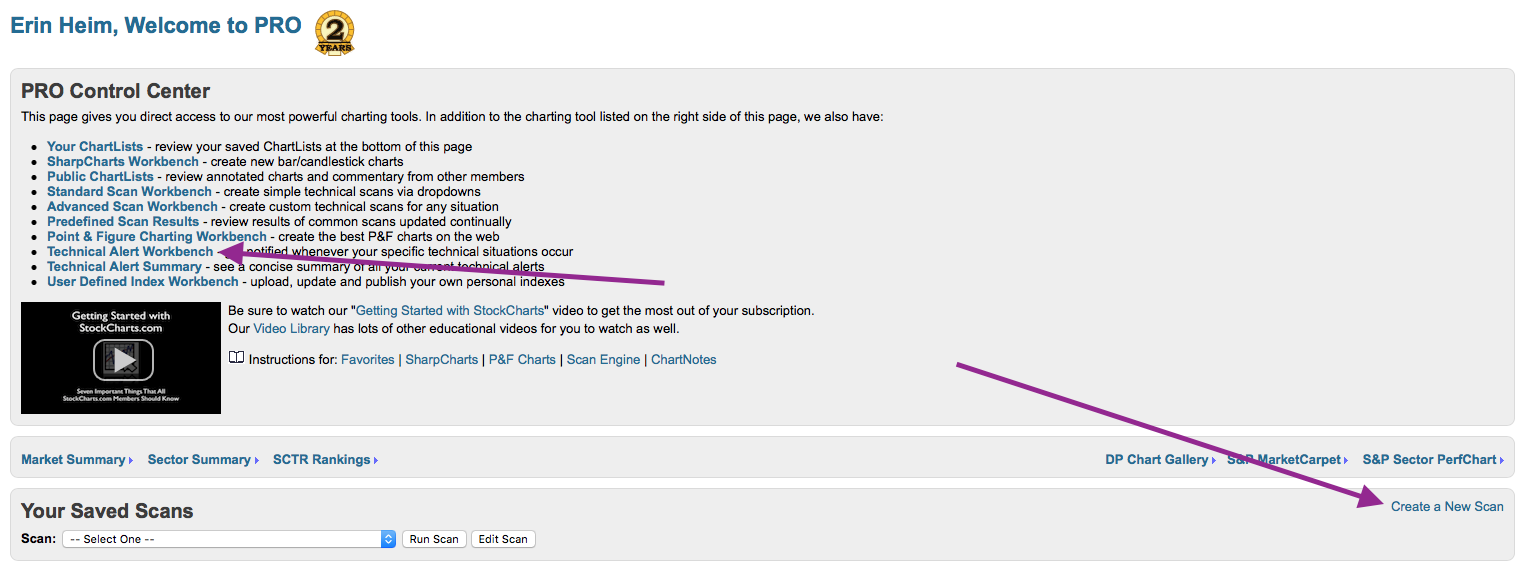 The Technical Alert workbench is nearly identical to the Scanning Workbench, so I'm just going to show you the formulas you'll need to create them. I highly recommend you visit the Support tab and watch a few videos on how to use scans and alerts.
First is the ST Trend Model 5/20-EMA crossovers. To make IT and LT Trend Model scans, just substitute the EMAs based on the Trend Model you're using, 20/50-EMA and 50/200-EMA crossovers respectively. Remember to first select your own "universe" to scan, be it the SPX, your favorite ChartList, etc. Mine is a ChartList named "0000 - DP Market/Sector Summary".
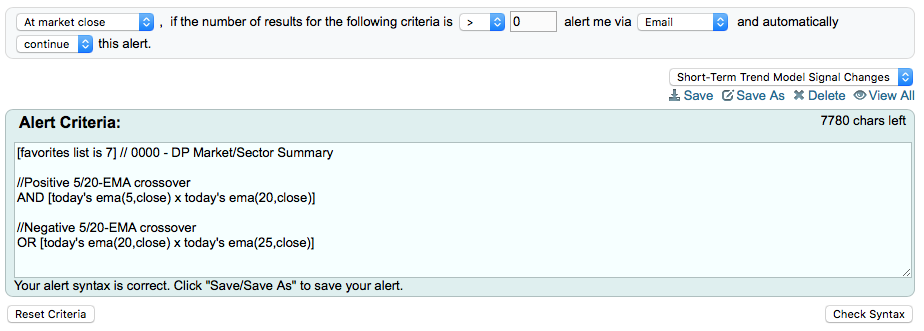 Below is the ST PMO crossover technical alert.
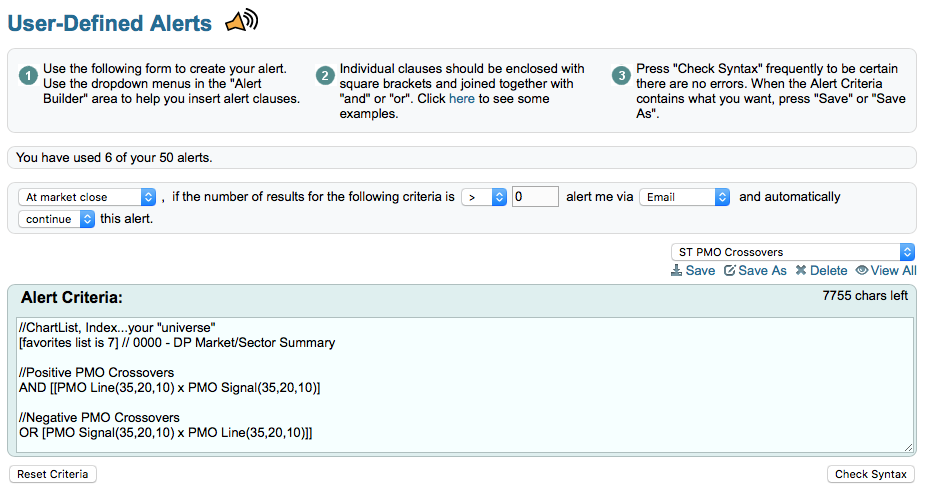 For PMO crossover alerts on weekly or monthly charts. Simply add "weekly" or "monthly" as below:
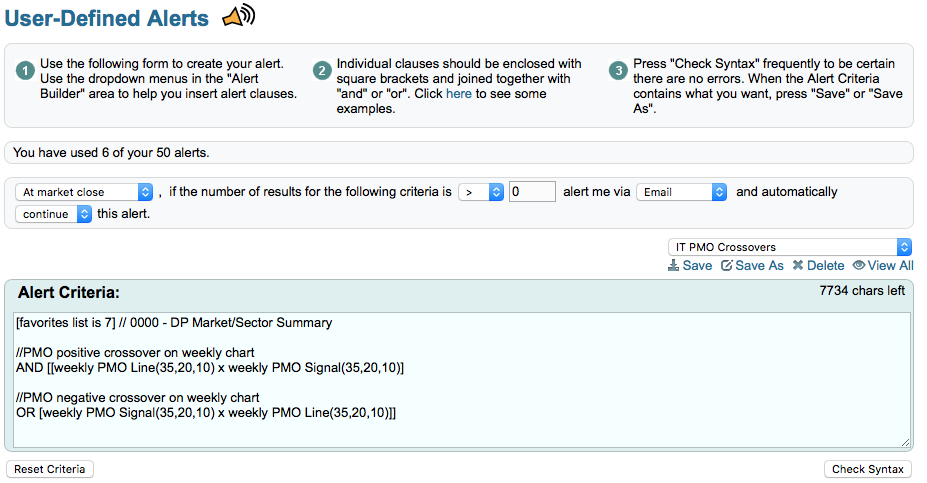 Remember, weekly signals don't go "final" until last trading day of the week and monthly signals not until last trading day of the month, but you may still receive alerts for these during the week or before the end of the month.
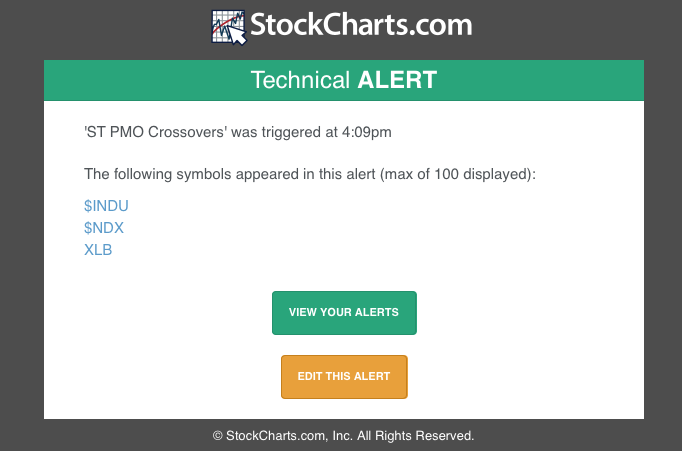
Here's what I get in my email when one of these alerts is triggered at the end of the day. Pretty nifty!
 Conclusion: Shortcuts abound on StockCharts.com for members. To see what is included in your level of membership click on "Your Account" in the upper right-hand corner. If you have more questions about Technical Alerts, please check out the articles in the Support area.
The NEW DecisionPoint LIVE public ChartList has launched! Click on the link and you'll find webinar charts annotated just before the program. Additional "chart spotlights" will be included at the top of the list. Be sure and bookmark it!
Come check out the DecisionPoint Report with Erin Heim on Wednesdays and Fridays at 7:00p EST, a fast-paced 30-minute review of the current markets mid-week and week-end. The archives and registration links are on the Homepage under “Webinars”.
Technical Analysis is a windsock, not a crystal ball.
Happy Charting!
- Erin

