 Readers of my DecisionPoint Alert blog have been watching the head and shoulders pattern forming on USO and Oil. There are plenty of fundamental factors that go into the pricing of Oil, but at this time they have lined up together with the technicals to form this bearish head and shoulders pattern.
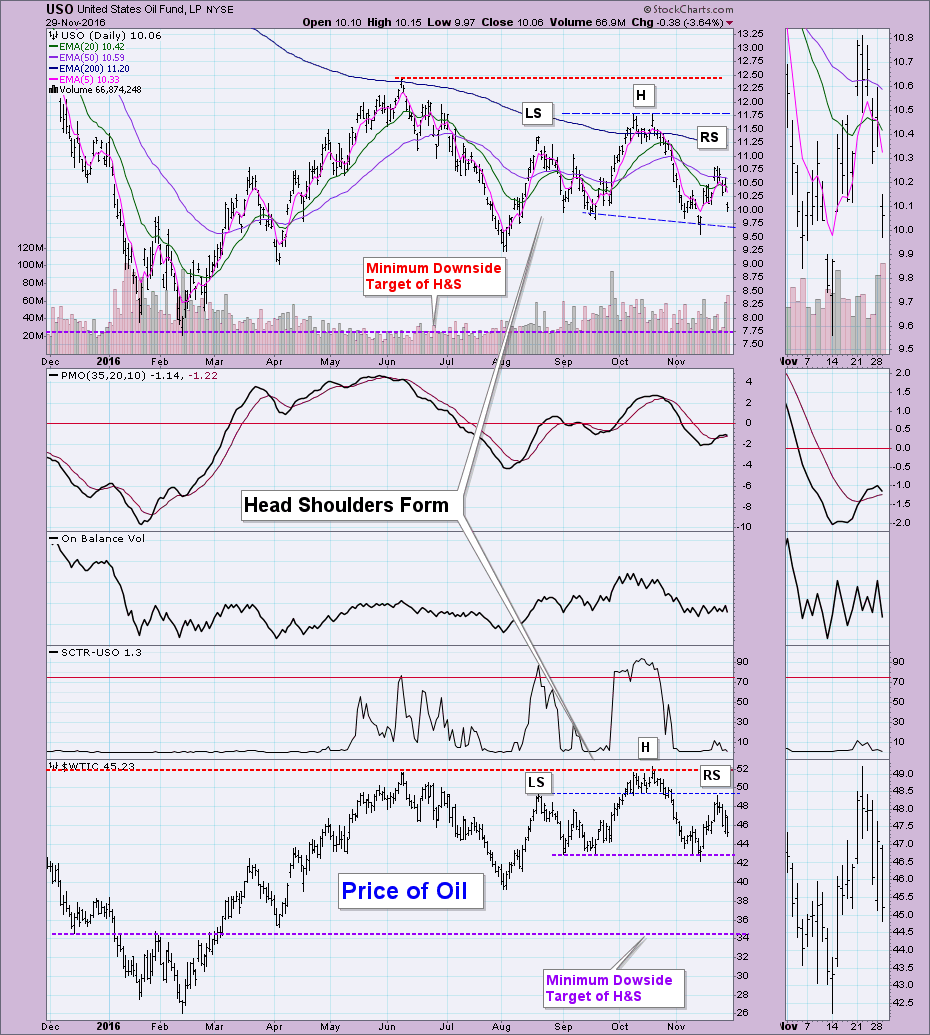
You'll see both patterns quite clearly on the daily chart below. Here's a quick refresher on expectations of a head and shoulders pattern.
First, we should expect price to break down below the neckline drawn from the troughs between the shoulders. You'll note USO's is not straight across. It isn't required by the pattern to be straight but it does adjust the breakdown point from $9.80 to about $9.70. If price does break down below $9.70, we can then look for prices to drop the length of the pattern from neckline to the top of the head. This puts the minimum downside target of USO at $7.75 or the February low. Using the same definition for Oil, the minimum downside target is at about $34/barrel which lines up with the April low, January top and December low.
The Price Momentum Oscillator (PMO) is about to generate a SELL signal and today, the Short-Term Trend Model (STTM) triggered a Neutral signal as the 5-EMA dropped below the 20-EMA. One thing that could undo the pattern would be a sustained decline in the Dollar. Oil tends to flourish when the Dollar is declining.
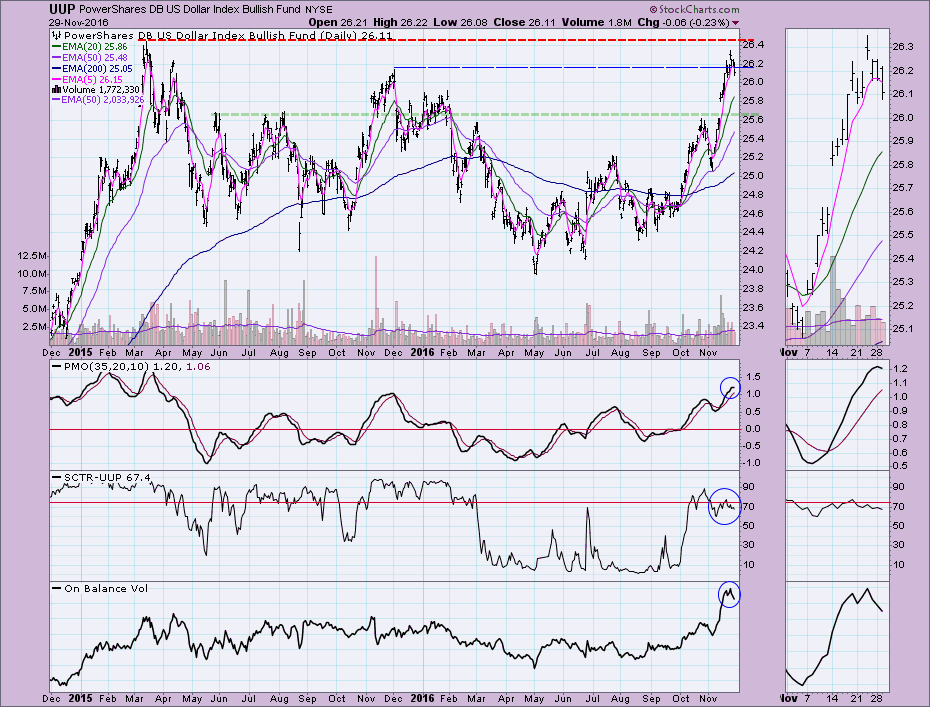
Here is a quick peek at the UUP chart. The UUP chart suggests a short-term decline to about $25.70. Given the healthy-ish SCTR, I wouldn't expect a decline much past that level of support. However, the PMO is about to generate a SELL signal in overbought territory and the OBV is aligning with this new short-term decline, so it isn't out of the realm of possibility that a more sizable decline is on tap.
Conclusion: The head and shoulders patterns on USO and Oil suggest a correction that would bring prices back to $7.75 (USO) and $34/barrel (Oil). The Dollar is topping and could be setting up for a decline. If that happens, it might override or bust the head and shoulders patterns. Read the daily DP Alert blog or join me for this Wednesday and Friday webinars where I'll be analyzing these charts in detail.
The NEW DecisionPoint LIVE public ChartList has launched! Click on the link and you'll find webinar charts annotated just before the program. Additional "chart spotlights" will be included at the top of the list. Be sure and bookmark it!
Come check out the DecisionPoint Report with Erin Heim on Wednesdays and Fridays at 7:00p EST, a fast-paced 30-minute review of the current markets mid-week and week-end. The archives and registration links are on the Homepage under “Webinars”.
Technical Analysis is a windsock, not a crystal ball.
Happy Charting!
- Erin


