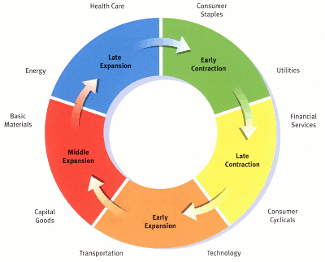
 If you haven't gotten John Murphy's Book, Trading with Intermarket Analysis, I highly recommend you do. He talks at length about sector rotation and how it can help you determine where the market is and could likely be headed. The graphic above shows us the economic cycle and which sectors do well and which do not during those time periods. I review the DecisionPoint Market/Sector Summary posture table daily and publish it in the DP Alert blog daily (you can find the full report in the DP Reports blog). It lists all of the major sectors and their current Trend Model signals.
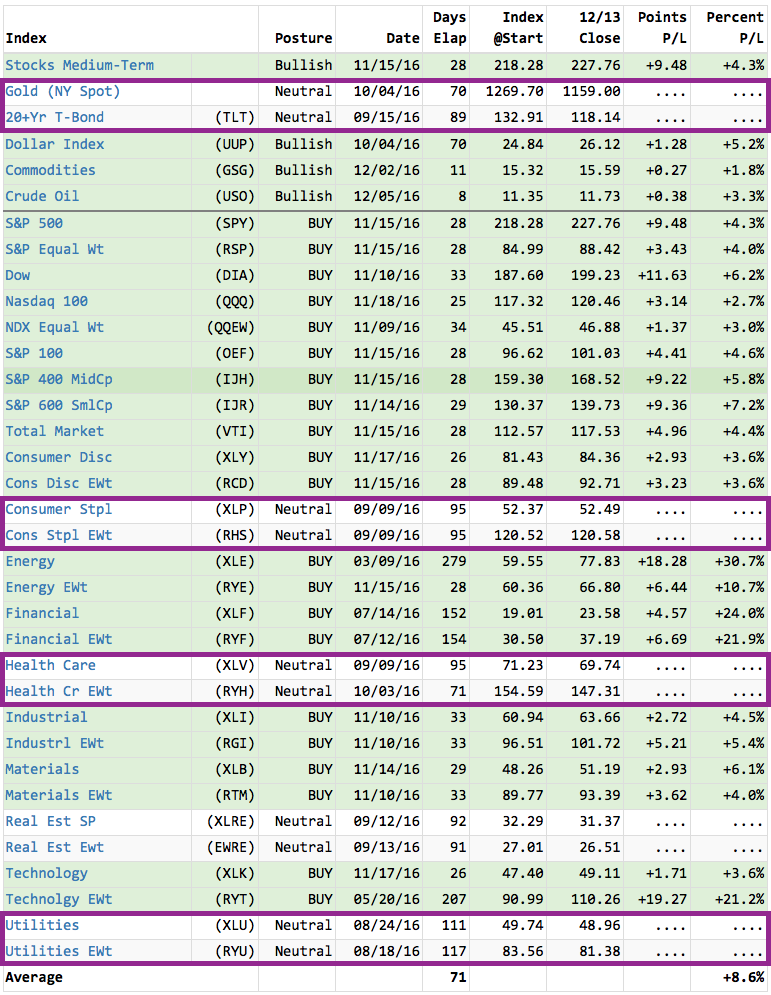
Here is what the table looks like right now. The determination of who is "green" (buy signal) or "red" (sell signal) or white (neutral signal) is derived from the Intermediate-Term Trend Model signal. These signals are specifically related to positive and negative crossovers of the 20/50-EMAs in relation to the 200-EMA. The only "tricky" one is the neutral signal. These are triggered when there is a negative 20/50-EMA crossover while the 50-EMA is above the 200-EMA. It is a SELL signal if the crossover occurs below the 200-EMA. Details on the Intermediate-Term Trend Model are in ChartSchool.
Notice that currently, the "defensive" sectors, Gold and Bonds (those that do better during early to late contractions) are on Neutral signals. This suggests that we are in an expansion phase.
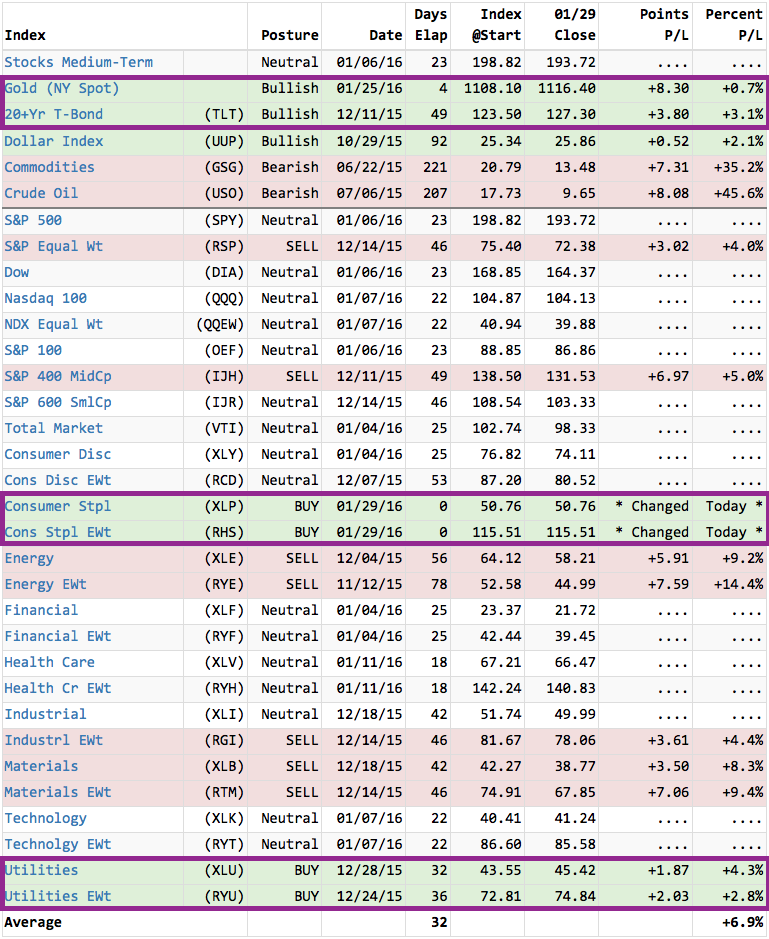
Here is what the posture table looked like at the end of January.
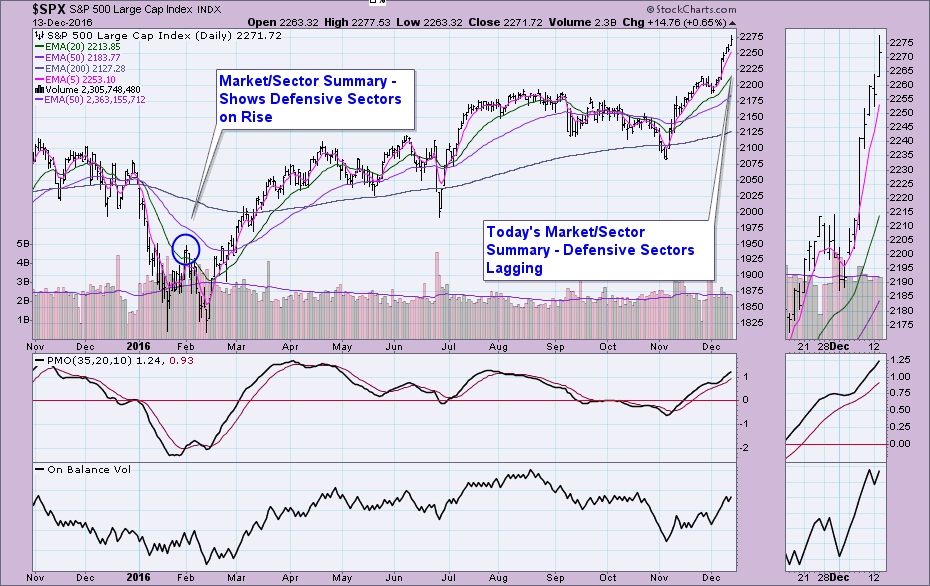
And for those without a photographic memory, here is where the S&P 500 was during that time. It isn't perfect and rotation doesn't always line up just right, but the Market/Sector Summary can hint at where the market is and where it could be going by following sector rotation guidelines.
Conclusion: The DP Market/Sector Summary posture table is a quick visual to see which sectors are performing and which are not. Next time I'll put together an RRG graph with those sectors so you can use it in conjunction with the table. Remember: You'll find the DP Market/Sector Summary table in the DP Reports blog.
The NEW DecisionPoint LIVE public ChartList has launched! Click on the link and you'll find webinar charts annotated just before the program. Additional "chart spotlights" will be included at the top of the list. Be sure and bookmark it!
Come check out the DecisionPoint Report with Erin Heim on Wednesdays and Fridays at 7:00p EST, a fast-paced 30-minute review of the current markets mid-week and week-end. The archives and registration links are on the Homepage under “Webinars”.
Technical Analysis is a windsock, not a crystal ball.
Happy Charting!
- Erin
