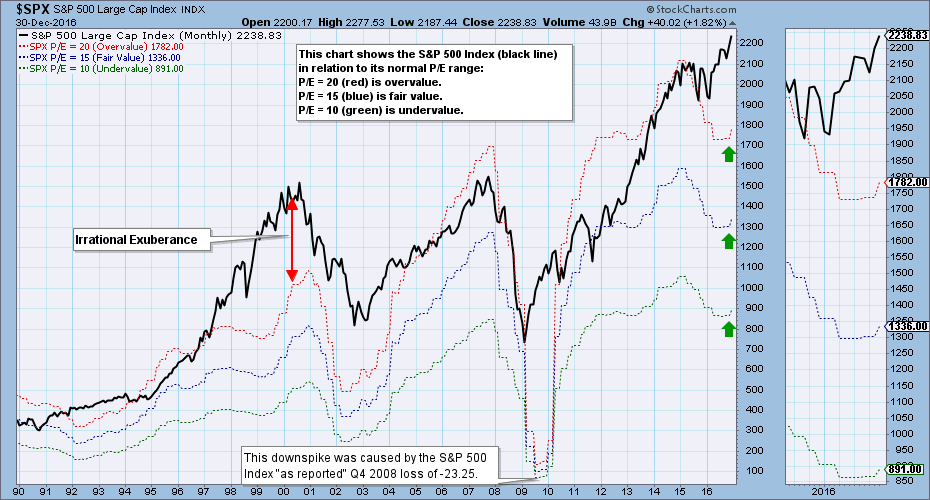
Last week S&P 500 preliminary earnings results for 2016 Q3 were in, and the market is still grossly overvalued. On the plus side, however, earnings turned up and are projected to move higher over the next year.

The chart above shows the S&P 500 Index (black line) in relation to where it would be if it were undervalued (green line), fair value (blue line), or overvalued (red line). We can clearly see that at 2239 price is far above overvalue side of the range. It has a P/E of 25 and reminds me of the days of 'irrational exuberance' back in the 1990s; although, the cause of the current overvaluation is due to ZIRP (zero interest rate policy) forcing money into stocks.
The table below shows how earnings are expected to improve going forward, but the drop in P/E shown is only possible if price doesn't change, which, of course, won't be the case.

Source: Standard and Poors
The following table shows where the colored bands will be as earnings improve.

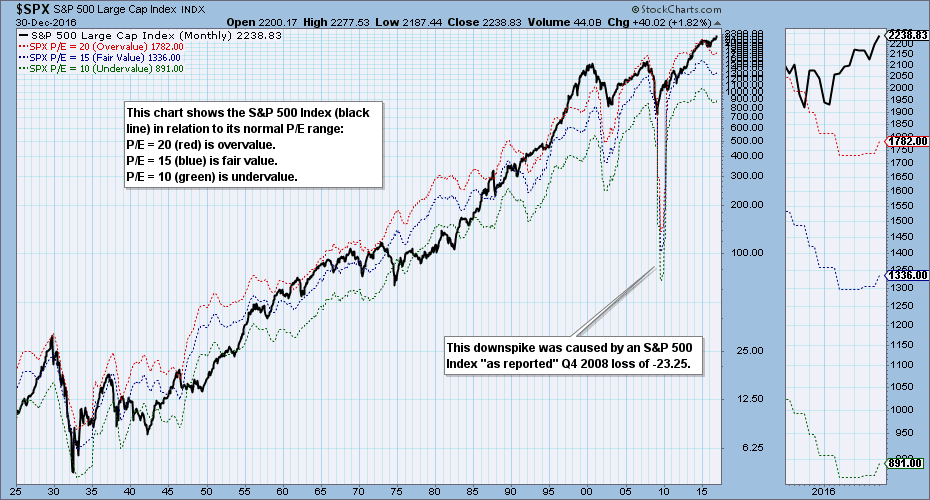
Finally, here is a 90-year chart to give us some historical perspective.

CONCLUSION: The market exceeded the normal overvalued level (red line) a year ago and widened the gap until 2016 Q3 earnings made a clear turn upward. That is a positive development, because, at least, earnings and price are moving in the same direction; however, we still need to be concerned that extreme overvalue conditions weaken the fundamental foundation of the market.
The NEW DecisionPoint LIVE public ChartList has launched! Click on the link and you'll find webinar charts annotated just before the program. Additional "chart spotlights" will be included at the top of the list. Be sure and bookmark it!
Come check out the DecisionPoint Report with Erin Heim on Wednesdays and Fridays at 7:00p EST, a fast-paced 30-minute review of the current markets mid-week and week-end. The archives and registration links are on the Homepage under “Webinars”.
Technical Analysis is a windsock, not a crystal ball.
Happy Charting!
- Carl


