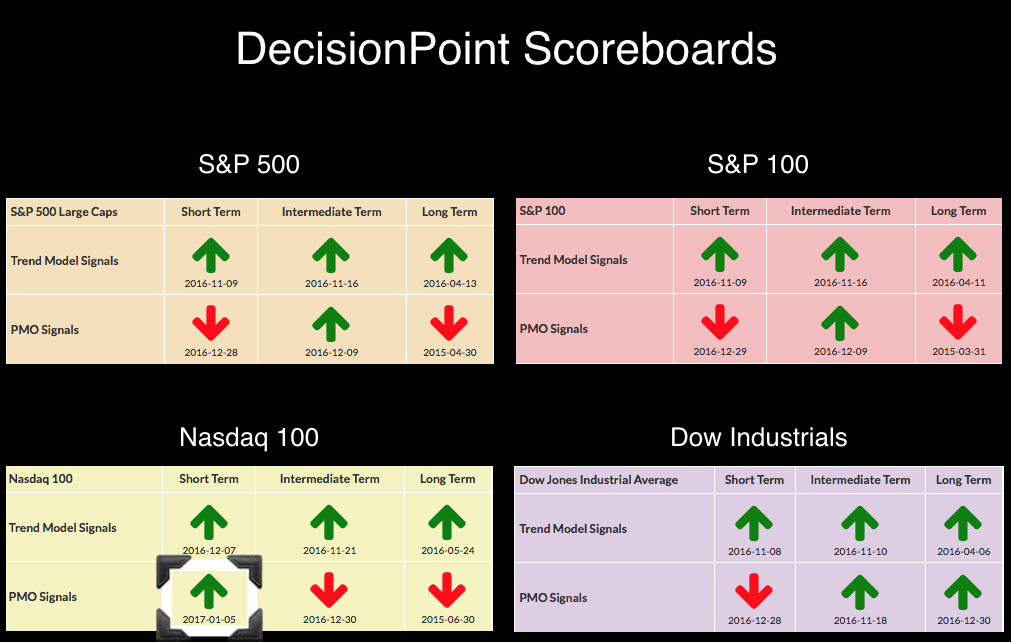
Today, the Nasdaq 100 rallied while the other indexes experienced declines. You'll note in the DecisionPoint Scoreboard Summary below that all of the major indexes are on short-term Price Momentum Oscillator (PMO) SELL signals that arrived in December. Meanwhile, the NDX received a new PMO BUY signal.

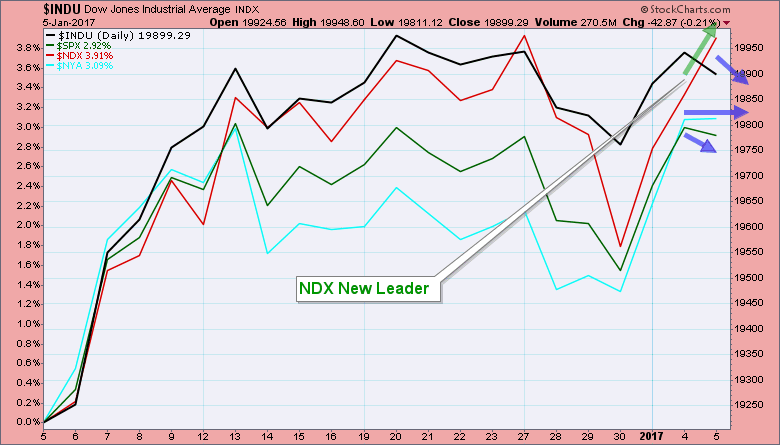
Here is a performance chart I put together showing percentage gains over the past month. Today's move put the NDX on top while other indexes are fading. The Dow has clearly been leading the market, but the recent side steps can't compete with the NDX's steady rise.
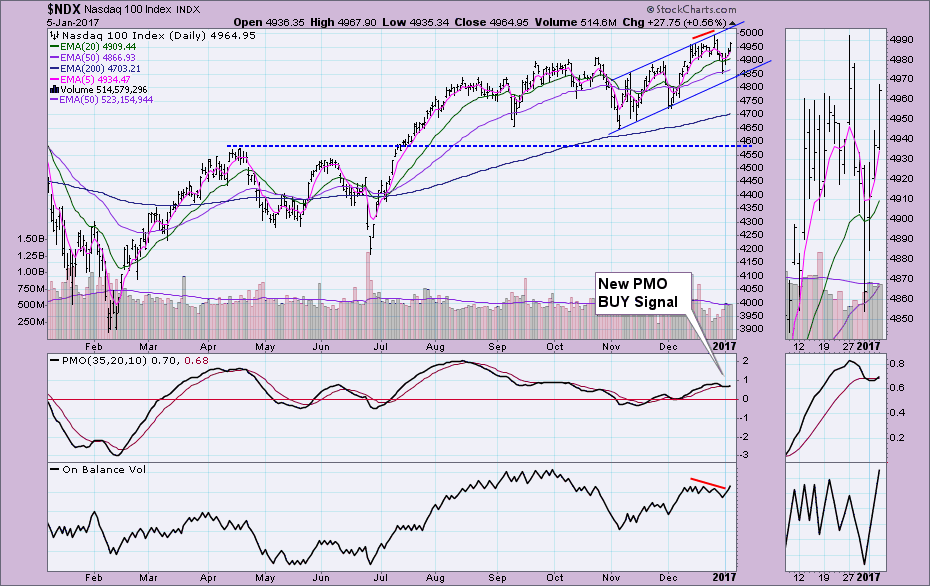
The NDX is in a very manageable rising trend channel. It didn't test the bottom of the channel on the last low which could be considered somewhat bullish. I highlighted a negative divergence between the OBV and price tops. I believe that negative divergence was confirmed with last week's decline. Now we will watch for bullish confirmations. If price continues its rise to test the top of the channel, new all-time highs will be logged.
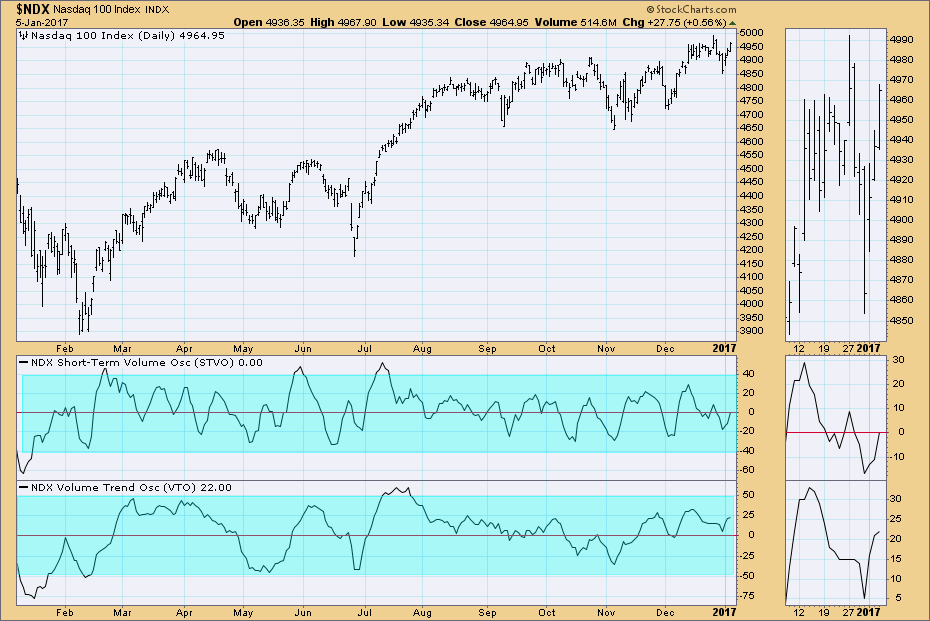
The Short-Term Volume Oscillator (STVO) and Volume Trend Oscillator (VTO) (intermediate-term indicator) are both bullish and rising. The VTO is in a vulnerable position as it is getting to the top of its zone which could mean a downturn later.
Conclusion: The NDX has caught up to the Dow and is now in the process of surpassing it. The NDX could be in for some upside given short-term indicators like the PMO and STVO are looking bullish; however, IT indicator, VTO, is getting overbought so any rally will likely be short-lived. If the major markets decline or correct, the NDX will likely not survive unscathed.
The NEW DecisionPoint LIVE public ChartList has launched! Click on the link and you'll find webinar charts annotated just before the program. Additional "chart spotlights" will be included at the top of the list. Be sure and bookmark it!
Come check out the DecisionPoint Report with Erin Heim on Wednesdays and Fridays at 7:00p EST, a fast-paced 30-minute review of the current markets mid-week and week-end. The archives and registration links are on the Homepage under “Webinars”.
Technical Analysis is a windsock, not a crystal ball.
Happy Charting!
- Erin


