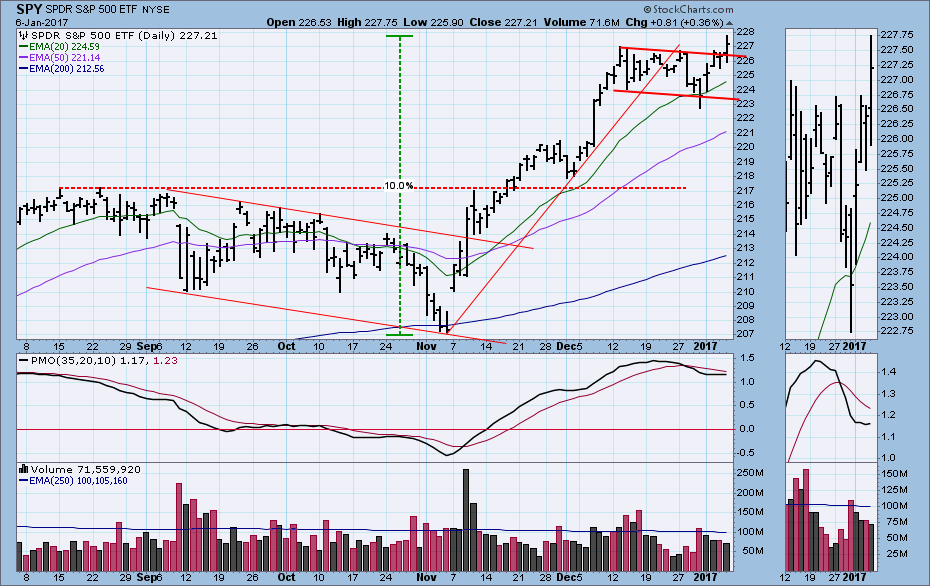
Two weeks ago I was looking for a price top. Strictly speaking, we got one, but the decline was short-lived (three days), and the low was the last low in a four-week flag formation. The new rally off that low was strong enough to fuel a breakout to new, all-time highs on Friday. My immediate concern is whether this breakout has good technicals behind it.
On Friday the PMO turned up, but it is near the top of its normal range. A PMO bottom at that level does not hold the promise of one near the low end of the range, but there is still plenty of room for the PMO to move higher before it becomes really overbought. Volume was low on Friday, but I think that is the final dampening effect of the holidays on trading.
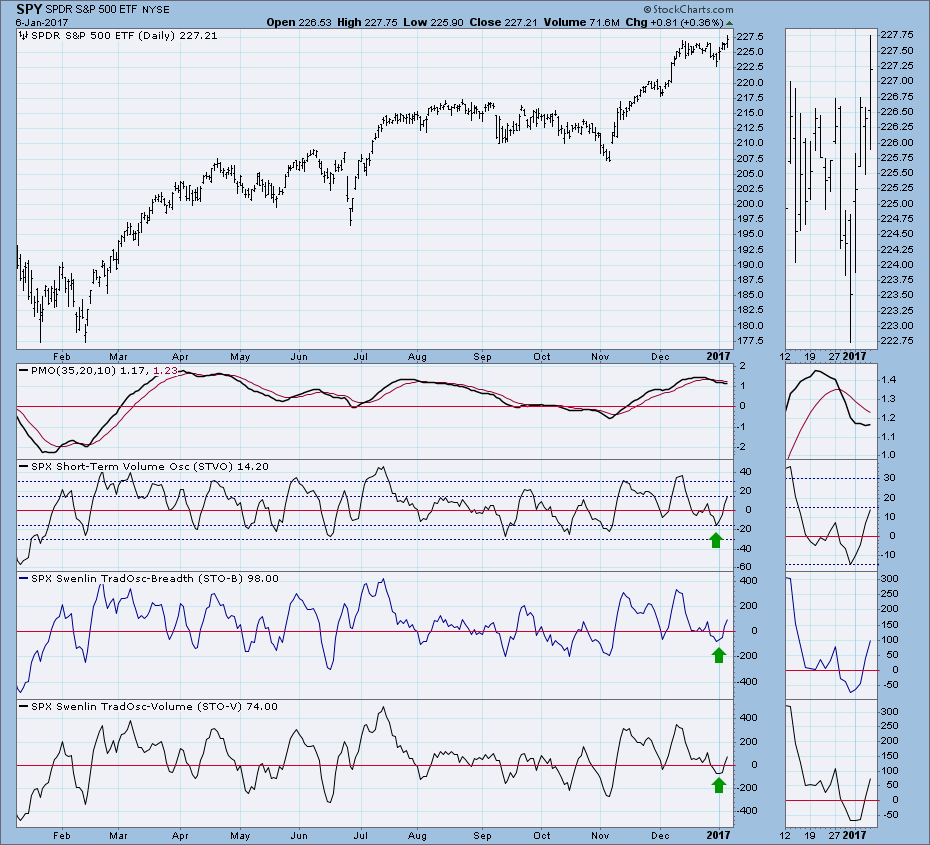
Looking at our short-term indicators below, we can see that they bottomed at modestly oversold levels and are now slightly overbought. There is plenty of room for them to accommodate a healthy price advance.
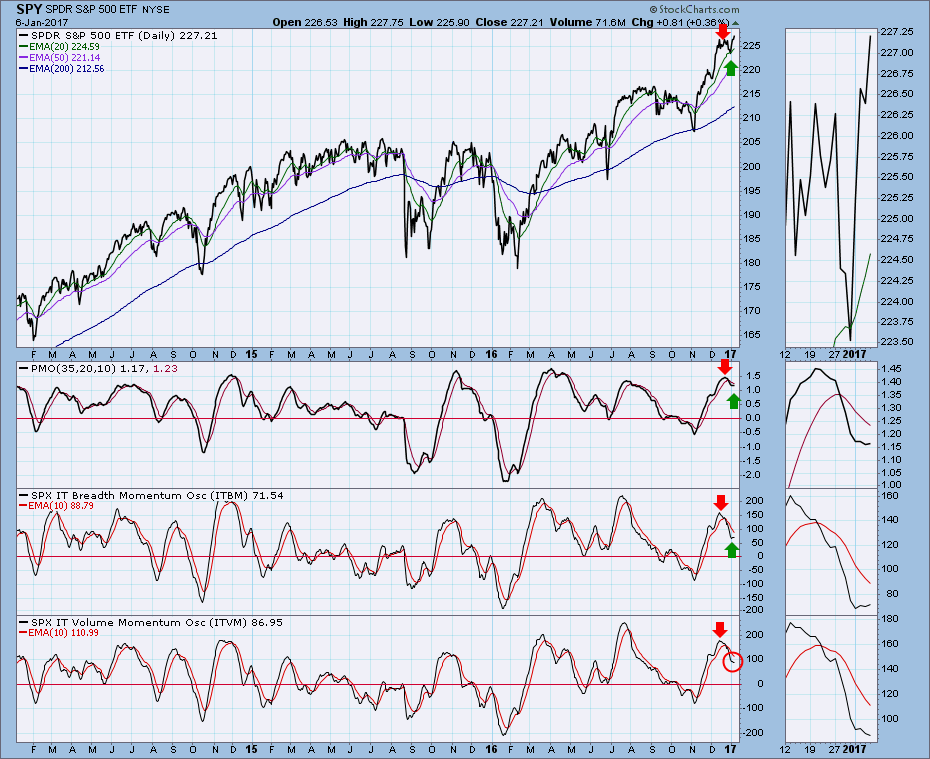
Our intermediate-term indicators below, the ITBM and ITVM in particular, are well below the normal overbought level. I marked the recent indicator and price tops, followed by last week's bottoms. Thanks to holiday trading volume, the ITVM has not bottomed yet, but I don't think that will be a problem for long.
 Regarding the current market condition, we are not coming off big, fat, juicy oversold bottoms like we had in February 2016. The market is not even modestly oversold, like it was at the beginning of November. The best that can be said is that indicators are turning up after a small correction. They are slightly overbought, but they can easily accommodate more price appreciation.
CONCLUSION: While our indicators are far from their most bullish configuration, they will still allow for a decent price advance before they will start to make me feel uncomfortable. We are in a bull market, so our assumptions should default to the bullish side of the argument, where we would expect prices to continue higher.
The NEW DecisionPoint LIVE public ChartList has launched! Click on the link and you'll find webinar charts annotated just before the program. Additional "chart spotlights" will be included at the top of the list. Be sure and bookmark it!
Come check out the DecisionPoint Report with Erin Heim on Wednesdays and Fridays at 7:00p EST, a fast-paced 30-minute review of the current markets mid-week and week-end. The archives and registration links are on the Homepage under “Webinars”.
Technical Analysis is a windsock, not a crystal ball.
Happy Charting!
- Carl


