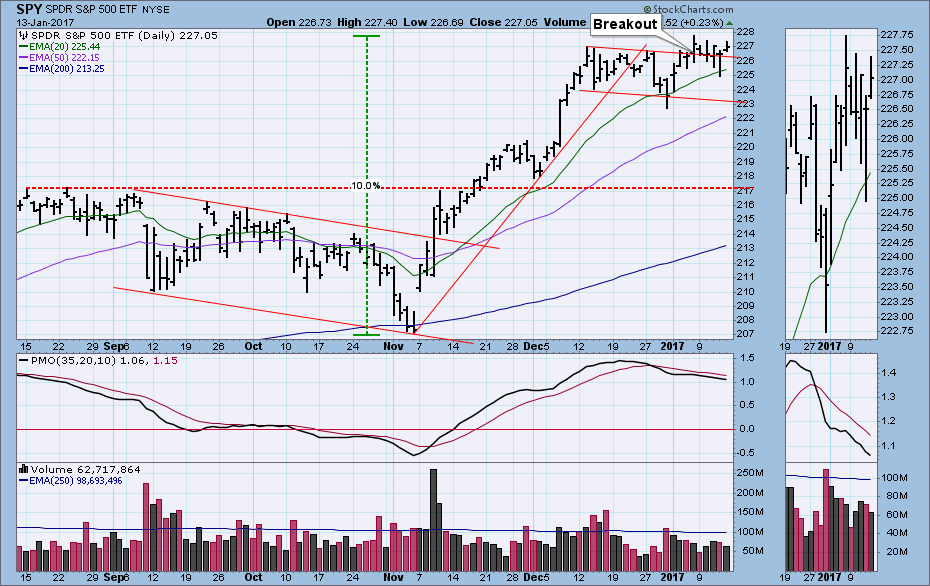
At the close of the prior week, a breakout from a flag formation had us questioning if the market was too overbought for the breakout to lead to higher prices. My conclusion was that there was plenty of room to the upside before our indicators got uncomfortably overbought. Brilliant! Unfortunately, there was no followthrough on the breakout at all, and the market just dribbled sideways for a week. Our indicators still allow for more upside price movement, but that is no longer of immediate concern.
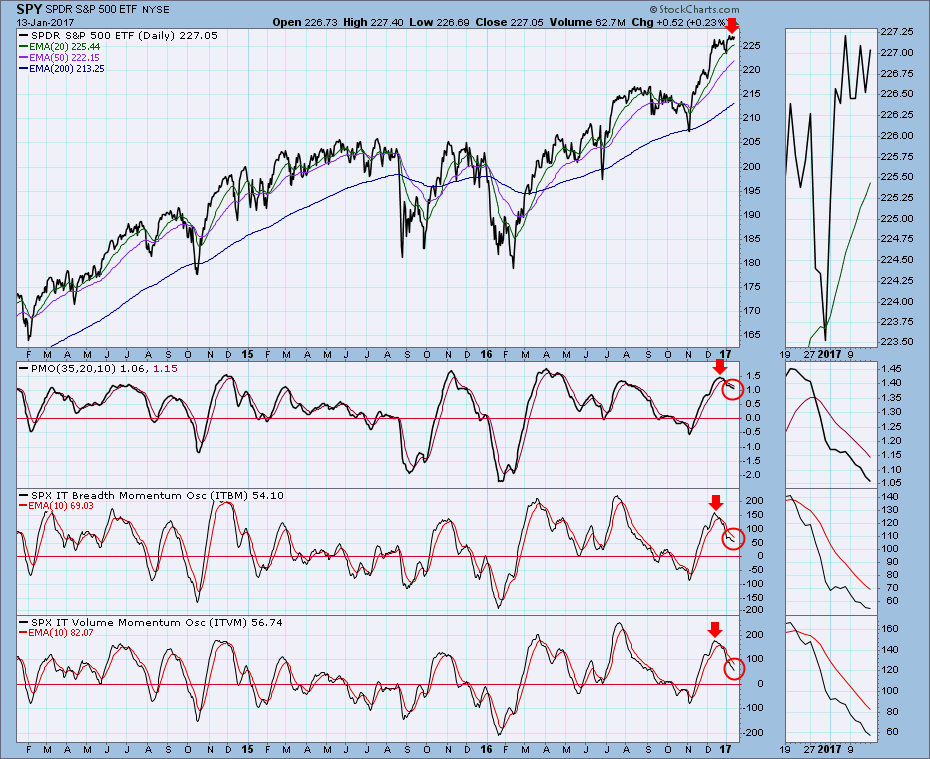
The prior week our intermediate-term indicators (except for the ITVM) had bottomed, and it seemed that a modest price advance was probably in the cards. Last week (on Monday) all the indicators turned back down, joining the ITVM, so now my immediate focus is not on whether the market will move higher, rather I wonder if we're going to see a correction. All the indicators shown are below their signal lines and falling. This is just about the most dangerous configuration there is. The only way it could be worse would be if the indicators were below the zero line.
Nevertheless, price has been moving sideways while the indicators unwind from overbought levels. So far, this is an internal correction, which is not uncommon in a bull market. It is also not uncommon for this kind of divergence between price and internals to end with a sharp correction, as price finally goes where internals have been pointing. If this happens, I expect that it will be short-term. I don't see it as signaling a major top.
CONCLUSION: The nice thing about writing weekend articles is that the article can stand for a day or more before the market makes it irrelevant. In my prior week's commentary I concluded that internals were such that they could accommodate a continued rally signaled by the price breakout. Great conclusion, except there was no followthrough on the breakout, and internals turned negative. Now my primary concern is that price will break down in response to weakening internals. Of course, the market could turn on a dime and move higher, but, until then, I am cautious.
The NEW DecisionPoint LIVE public ChartList has launched! Click on the link and you'll find webinar charts annotated just before the program. Additional "chart spotlights" will be included at the top of the list. Be sure and bookmark it!
Come check out the DecisionPoint Report with Erin Heim on Wednesdays and Fridays at 7:00p EST, a fast-paced 30-minute review of the current markets mid-week and week-end. The archives and registration links are on the Homepage under “Webinars”.
Technical Analysis is a windsock, not a crystal ball.
Happy Charting!
- Carl


