 As I can attest to, California has been hit with a deluge of rain. We have needed it for a very long time to alleviate almost non-stop drought conditions. I found it interesting when I did a Short-Term Trend Model (STTM) technical scan, California Water Services Group (CWT) had just had a new Short-Term Trend Model BUY signal, a new Intermediate-Term Trend Model (ITTM) BUY signal AND a pending Price Momentum Oscillator (PMO) BUY signal! It may or may not be related to the rainy weather, but the chart is interesting none-the-less.
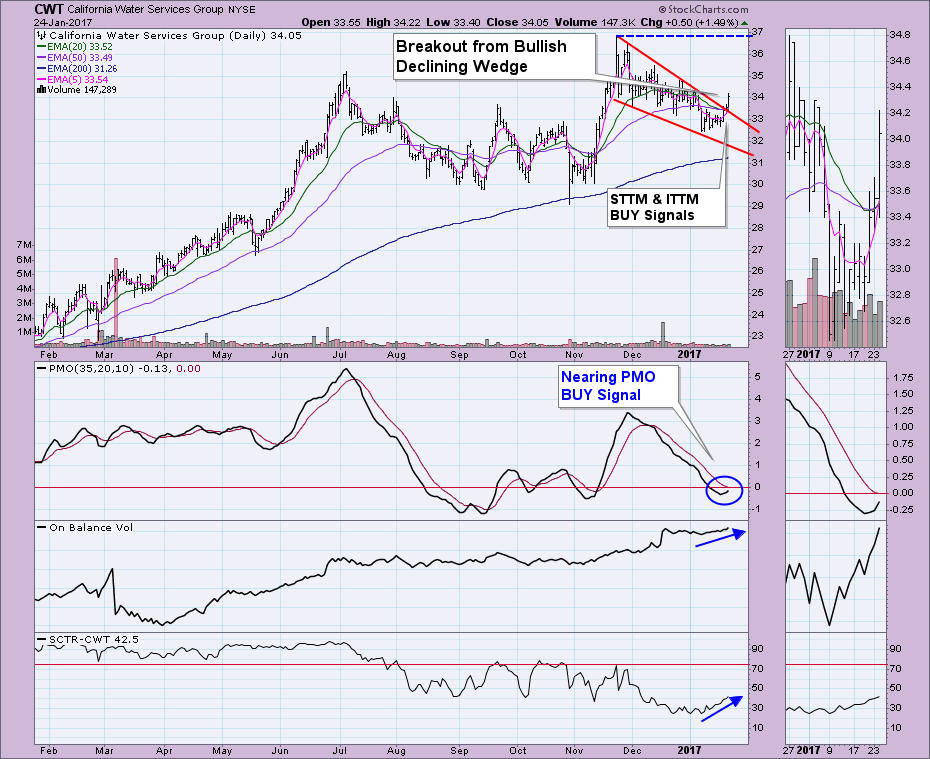
I will give you a reprint of the scan that I used to find this gem today at the bottom of the blog. The daily chart is very bullish. The PMO is nearing a positive crossover BUY signal. Price has broken out from a bullish descending wedge pattern. If you look in the thumbnail, you can see that the 5-EMA crossed above the 20-EMA which triggered a STTM BUY signal. Additionally, the 20-EMA crossed above the 50-EMA for an ITTM BUY signal. With today's breakout, price rose above both the August and September highs. Overhead resistance is at all-time highs around $37.
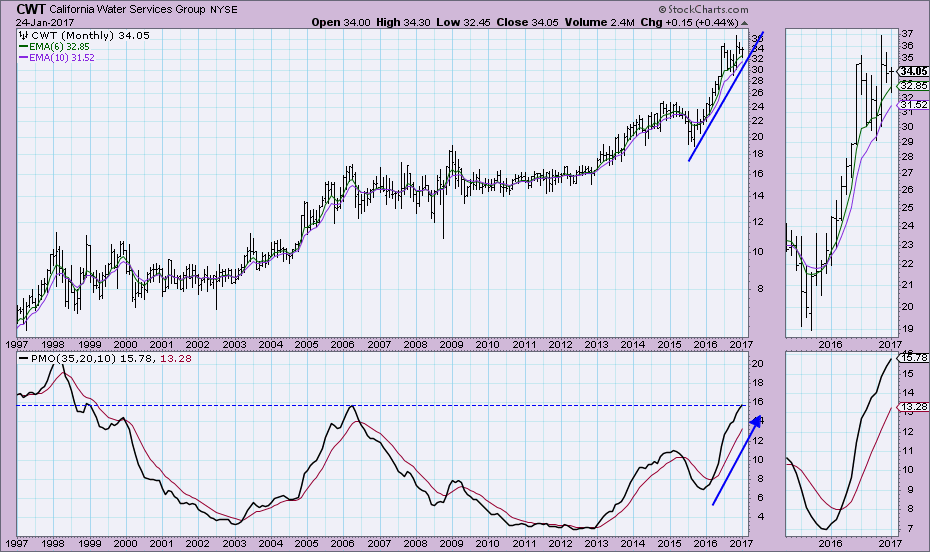
The monthly chart is bullish as well. The long-term PMO is on a BUY signal and price is holding onto a steep rising bottoms trendline. The PMO has now exceeded the prior 2006 top which is bullish as well. The main concern when looking at this chart is the ability of price to maintain such a steep slope.
Conclusion: Both the daily and monthly charts for CWT are bullish and suggest a move to test all-time highs around $37. I hope I haven't fallen into the same trap as the rest of my California friends by marveling over simple rain, but it truly is a rarity when it happens for days, it is news. If you have a few minutes and want a laugh, here's a YouTube video that has been going around making fun of us Californians and our helplessness around rain.
STTM SCAN
[type = stock] AND [Daily SMA(20,Daily Volume) > 50000]
and [country is US]
AND [today's PMO Line(35,20,10) < today's PMO Signal(35,20,10)]
AND [today's PMO Line(35,20,10) > yesterday's PMO Line(35,20,10)]
AND [yesterday's PMO Line(35,20,10) > 2 days ago PMO Line(35,20,10)]
AND [2 days ago PMO Line(35,20,10) > 3 days ago PMO Line(35,20,10)]
AND [today's ema(50,close) > today's ema(200,close)]
AND [today's ema(5,close) > today's ema(20,close)]
AND [yesterday's ema(5,close) < yesterday's ema(20,close)]
The NEW DecisionPoint LIVE public ChartList has launched! Click on the link and you'll find webinar charts annotated just before the program. Additional "chart spotlights" will be included at the top of the list. Be sure and bookmark it!
Come check out the DecisionPoint Report with Erin Heim on Wednesdays and Fridays at 7:00p EST, a fast-paced 30-minute review of the current markets mid-week and week-end. The archives and registration links are on the Homepage under “Webinars”.
Technical Analysis is a windsock, not a crystal ball.
Happy Charting!
- Erin


