DecisionPoint February 28, 2017 at 06:29 PM
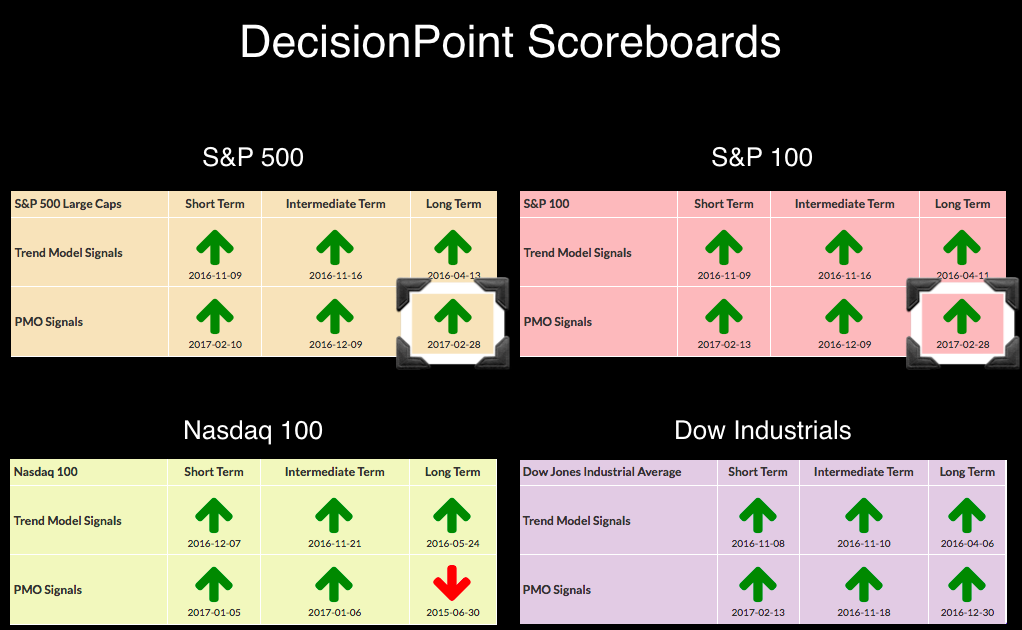
The DecisionPoint Scoreboards in the DP Chart Galleries are now almost completely bullish. Two new Long-Term Price Momentum Oscillator (PMO) BUY signals appeared for the S&P 500 and S&P 100 when the monthly charts went final today... Read More
DecisionPoint February 26, 2017 at 11:46 AM
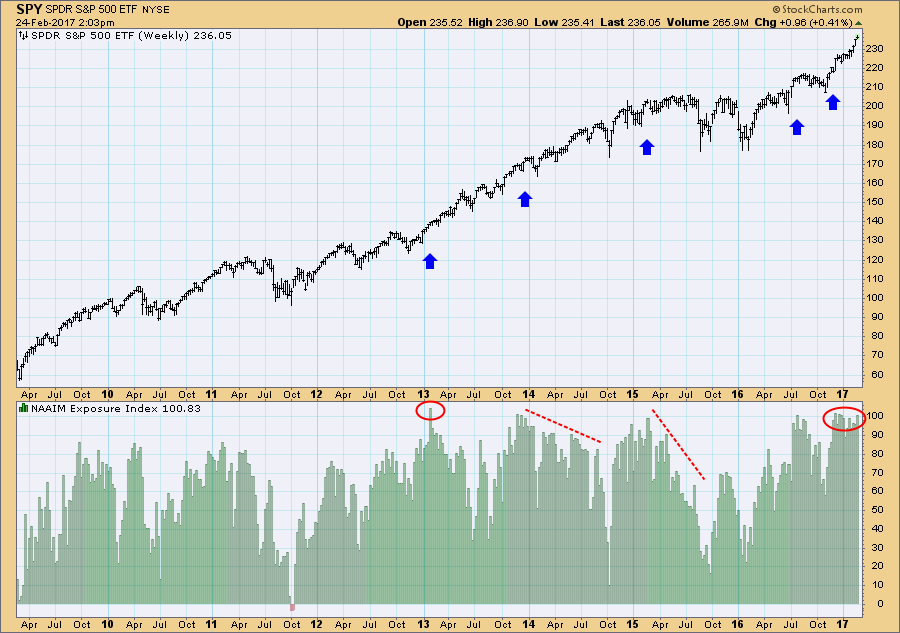
One of the sentiment indicators we follow is the Exposure Index (EI) for the National Association of Active Investment Managers (NAAIM). It is probably somewhat better than other measures of sentiment because it shows how professionals have actually deployed their assets... Read More
DecisionPoint February 23, 2017 at 06:53 PM

I noticed on the StockCharts.com homepage "symbol cloud" that readers were downloading this chart more than Amazon and the SPX (based on size of the font). I decided to take a look. Wow! TSLA dropped more than 6... Read More
DecisionPoint February 20, 2017 at 10:45 AM
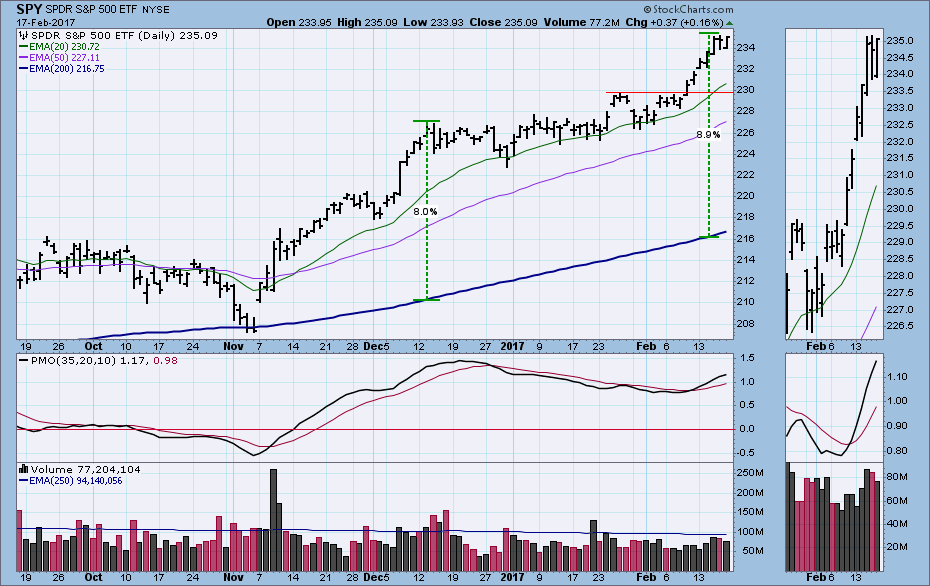
While the 200EMA (exponential moving average) smooths daily prices over a long period of time and shows us the trend within that time frame, it also acts as a moving base line of price. As we watch daily prices depart from the 200EMA, we can get a sense of how extended they are... Read More
DecisionPoint February 14, 2017 at 07:56 PM

The DecisionPoint LIVE webinars on Wednesday and Fridays at 7:00pm EST are news programs... Read More
DecisionPoint February 12, 2017 at 11:54 AM
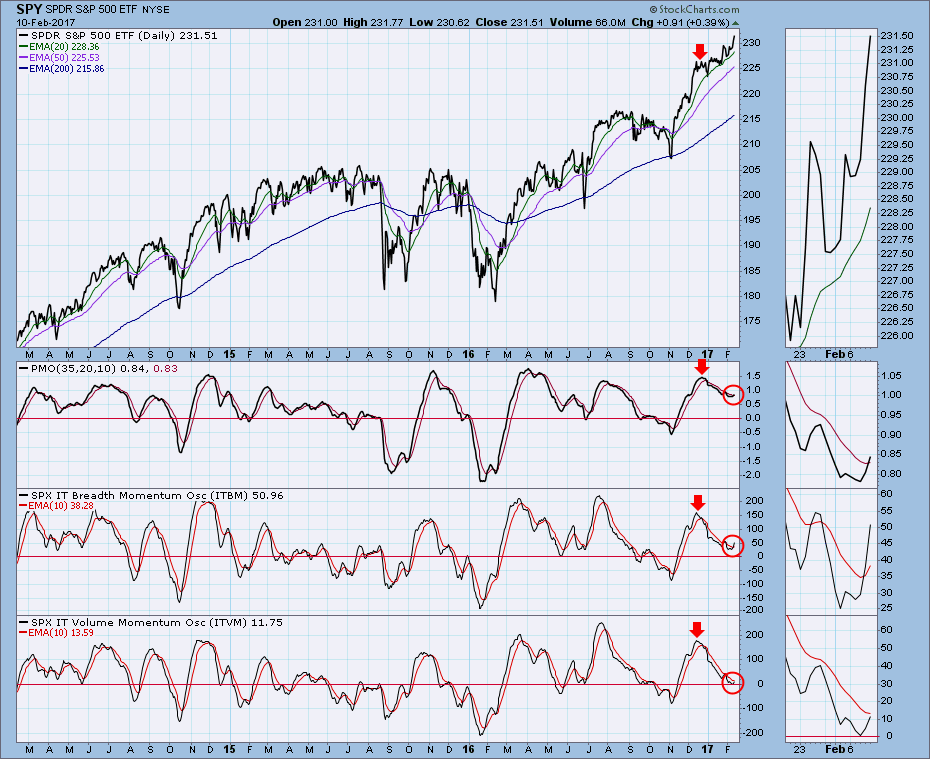
Just before Christmas I wrote an article saying I was expecting a correction or consolidation because our primary intermediate-term indicators had all topped. On the chart below we can see the annotations (down arrows) I made at the time, and we can see what actually happened... Read More
DecisionPoint February 07, 2017 at 07:40 PM

Both the Energy SPDR (XLE) and its counterpart, the equally-weighted Energy ETF (RYE) triggered new Intermediate-Term Trend Model Neutral signals when the 20-EMAs crossed below the 50-EMAs while the 50-EMA was below the 200-EMA. We consider a stock, index, ETF, etc... Read More
DecisionPoint February 05, 2017 at 11:31 AM
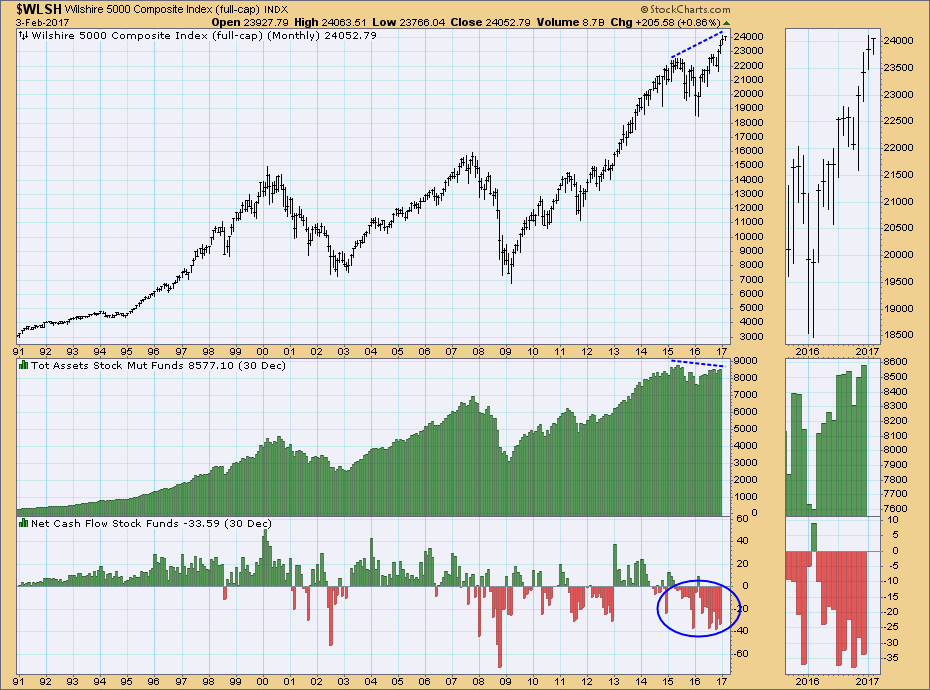
With some broad market indexes making record highs, one would think that total mutual fund assets would be following suit. But no... Read More
DecisionPoint February 02, 2017 at 06:48 PM
Yale Hirsch was the first to propose, "As the Standard & Poor's goes in January, so goes the year". Simply meaning, if the S&P 500 closes higher in January, the end of the year should finish higher OR if it closes lower, it will close lower on the year... Read More