 Chart Spotlights will be a regular addition to the DecisionPoint blog and have already been incorporated into the DecisionPoint Report webinars. The purpose of the Chart Spotlight is not to recommend a particular stock, it is a learning exercise. Many readers and viewers want to understand how to pull up a chart and find the most important characteristics for making their own investment decisions.
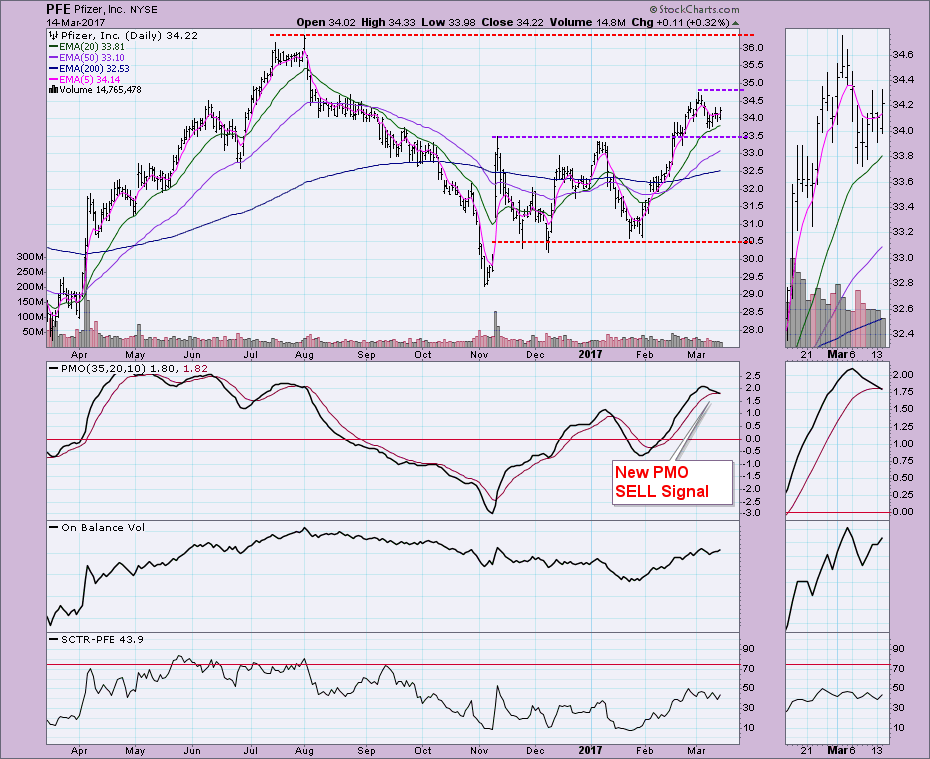
There are three things I analyze when I see a daily chart cold. First is to simply annotate support and resistance areas and/or identify any visible chart patterns. We know that patterns don't have the greatest track record, so I also look at the Price Momentum Oscillator (PMO) and use the DecisionPoint Trend Models. Second, I check the PMO trend, location and signal. Third, I review the configuration of the Trend Models. After that, I recommend you look at chart patterns and PMO configuration on weekly and monthly charts if possible.
In the case of Pfizer, support and resistance lines were fairly easy to find. These areas are important. They help you determine entry and exit points, as well as targets. One problem many investors have (myself included) is they set stops, but not targets. Set investment targets as well as stops and be true to them. For more information on this, I highly recommend a trip to our SCC bookstore to pick up "Come Into My Trading Room" by Dr. Alexander Elder. He makes a very good case.
Currently, near-term support is available at $33.50. It held it last week. Resistance is also nearby at $34.75. Being mid-way between this range, I would want to see either another successful test of support or a breakout. All-time highs are at the 2016 top and could be a target price with a stop below $33.50. But wait! The PMO just triggered a SELL signal near the top of its range. The last few PMO tops, these SELL signals have indeed signaled lower prices. This tells me to wait for that test of support. The Trend Models are all on BUY signals (5-EMA > 20-EMA > 50-EMA > 200-EMA). So price trend is bullish, but momentum is bearish. For that one reason, I'd avoid trading here. I haven't addressed the OBV and SCTR as they are looking mostly neutral. They are certainly a nice addition to confirming your analysis of the Trend Models and PMO, but I don't consider them required pieces of the puzzle. If you have your own toolbox, by all means use it to help confirm your own analysis.
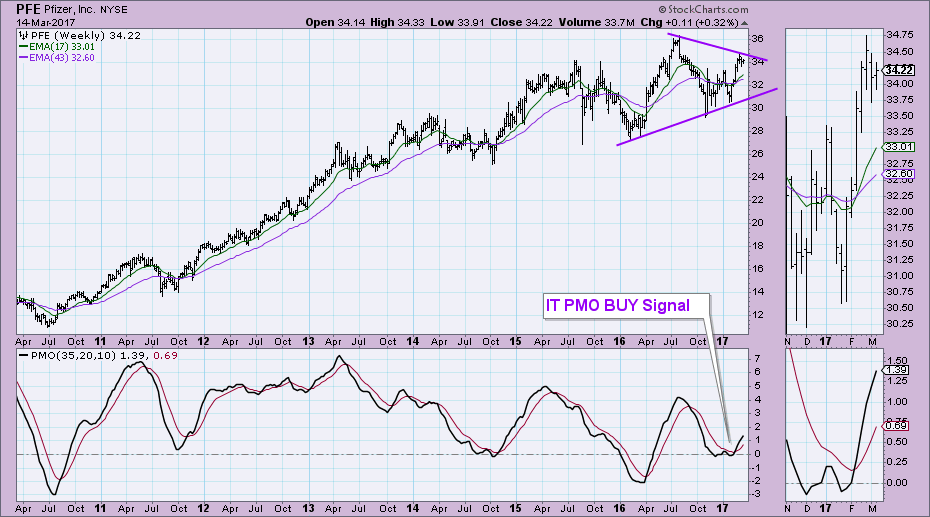
My recommendation is to always look at the weekly and monthly charts. Maybe the daily chart has a bullish bias, but if I am looking for a longer-term trade, I want to make sure it has a bullish foundation. As far as the weekly chart, I noted a symmetrical triangle formation. these are usually continuation patterns, meaning they continue the previous trend. In this case, that trend is up. The IT PMO is on a BUY signal. The weekly chart has some issues regarding price not being able to break above the newly formed declining tops trendline.
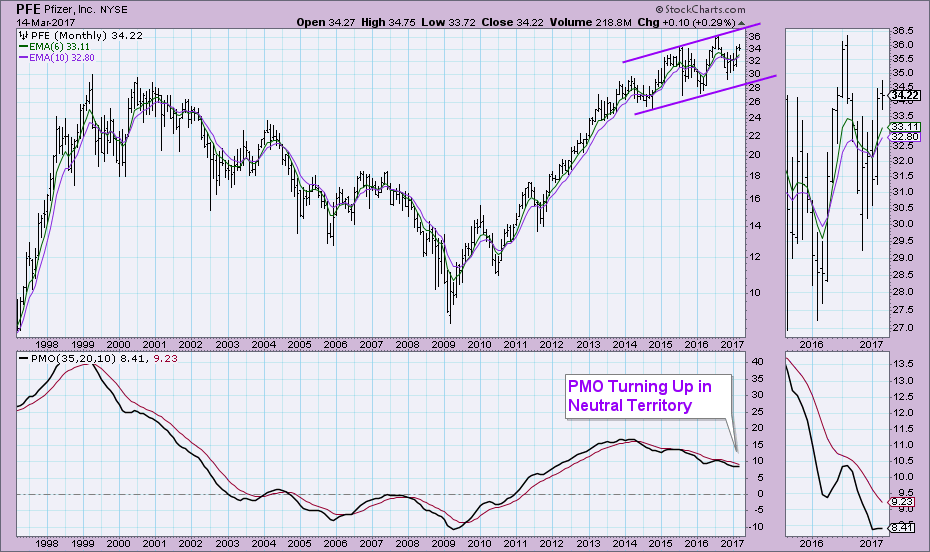
The monthly chart shows some promise, but also alerts us to possible pitfalls. The PMO is still on a SELL signal but it has turned up. Price is traveling nicely within a rising trend channel. Here are the possible pitfalls here: Price is nearing the top of the rising trend channel. Typically within a rising trend channel price will oscillate and test the top and bottom for some time until a breakdown (in some cases you'll see an upside breakout, but not often). This tells me there are limitations on my price target. This chart suggests that price will reach all-time highs to retest the top of the channel, but there is more downside territory that price is vulnerable to traveling through. The rising trend channel could remain intact even if price dropped to $30.
Conclusion: The daily chart for PFE doesn't inspire that much confidence with a brand new PMO SELL signal in overbought territory, that weakness in momentum is very bearish. Even though the Trend Models are configured nicely, negative momentum is a warning flag. The weekly and monthly charts are mostly bullish, but we can see that price is near overhead resistance at all-time highs. The monthly PMO is trending lower and has missed a few opportunities at a BUY signal. Until it actually triggers that LT PMO BUY signal, the set-up is just too "iffy".
*** IMPORTANT ANNOUNCEMENT *** I'll be a guest on the Bowley Briefing with Tom tomorrow 3/15 at noon EST. I'll talk about these charts and some new Chart Spotlights. Sign up here.
The NEW DecisionPoint LIVE public ChartList has launched! Click on the link and you'll find webinar charts annotated just before the program. Additional "chart spotlights" will be included at the top of the list. Be sure and bookmark it!
Come check out the DecisionPoint Report with Erin Heim on Wednesdays and Fridays at 7:00p EST, a fast-paced 30-minute review of the current markets mid-week and week-end. The archives and registration links are on the Homepage under “Webinars”.
Technical Analysis is a windsock, not a crystal ball.
Happy Charting!
- Erin


