 I thought this "yin yang" symbol was actually a nice metaphor for sentiment. When we look at the sentiment numbers on a chart they are expressed as a percentage. For example, 31% are bullish, 39% are bearish, and the rest fall into the neutral category. It's a fixed space where bulls and bears move together as a part of the whole, balancing each other out. When sentiment moves to one extreme it is generally a warning sign that the market will be moving in the opposite direction.
Why would it not move in the direction everyone is currently agreeing on? Sentiment is a funny thing. I always use the saying, "When everyone gets on board the band wagon, the wheels will generally fall off".
Below I have the American Association of Individual Investors' (AAII) sentiment chart below. AAII runs a survey on their website that asks whether you are bullish, bearish or neutral. Right now there is clearly a preponderance of bears. The raw number read 46.5% last week which was a clearly oversold reading. Many times the actual raw numbers may not divulge the inner workings as easily as last week, so we opt to use a bull/bear ratio. The last few weeks have seen this ratio move lower and lower. Note that when investors are more bearish or the ratio is very low, it is followed by a rally.
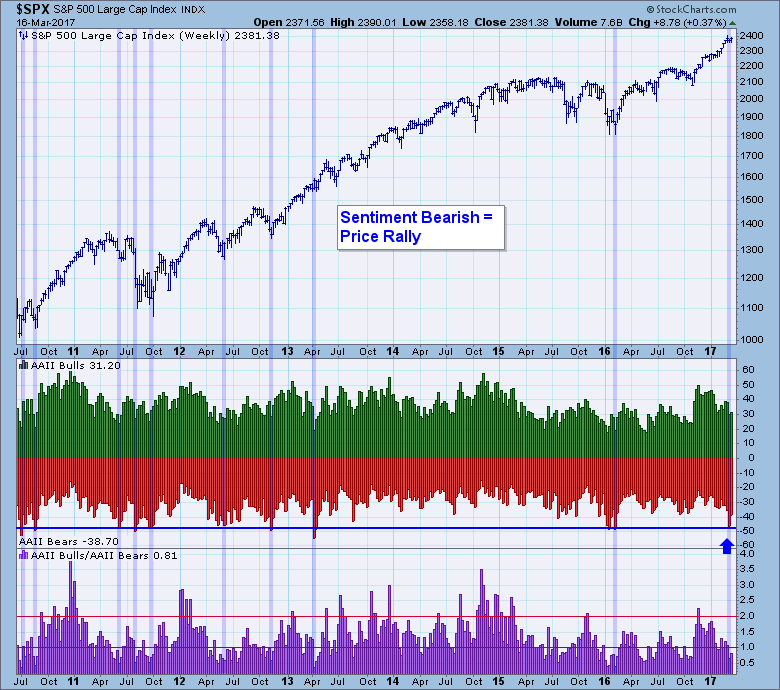
Conclusion: Granted, the ratio is currently at .81, much less bearish than last week's .65, but this is still a bearish reading. So far you can see that price has mainly moved sideways since last week's climactic reading. This suggests we could see higher prices over the next few weeks.
The NEW DecisionPoint LIVE public ChartList has launched! Click on the link and you'll find webinar charts annotated just before the program. Additional "chart spotlights" will be included at the top of the list. Be sure and bookmark it!
Come check out the DecisionPoint Report with Erin Heim on Wednesdays and Fridays at 7:00p EST, a fast-paced 30-minute review of the current markets mid-week and week-end. The archives and registration links are on the Homepage under “Webinars”.
Technical Analysis is a windsock, not a crystal ball.
Happy Charting!
- Erin


