 The DecisionPoint universe is evolving. As many of you are aware, some of our indicators will be retired. Two of the indicators many are concerned about losing are the Climactic Volume Indicator and Participation Index. Writing a blog everyday and doing regular webinars during the week tends to keep my focus on the shorter term. In order to better dissect the short term, DecisionPoint has create an "Ultra-Short-Term" timeframe. We define the ultra-short-term timeframe as hours to a day or two. These signals have a very short shelf life.
The chart below shows the CVI and Participation Index in the top two indicator windows. The way we read them is by looking for "climactic" or spiky moves. Climactic readings are the signals. In an effort to duplicate those types of climactic readings, I decided to look at Net Advances and Declines which have been included on this chart in the DecisionPoint Chart Gallery for some time.
I was pleased to see some really nice overlap. The chart below shows climactic positive readings on the CVI and Participation Index. They match up fairly well with climactic spikes or overbought/oversold readings on the VIX.
Now, just because the spike came in as a "positive" number, doesn't mean a price rally should be expected. To analyze these spikes properly, we have to take them in the context of the VIX and price action for the previous few days. I label these spikes as either an initiation or an exhaustion, meaning the expectation can be either up or down. The purpose of the two charts below are to show you that climactic moves seem to track nicely to the Net Advances-Declines. Even better, notice that extremes in the VIX generally line up with these climactic readings.
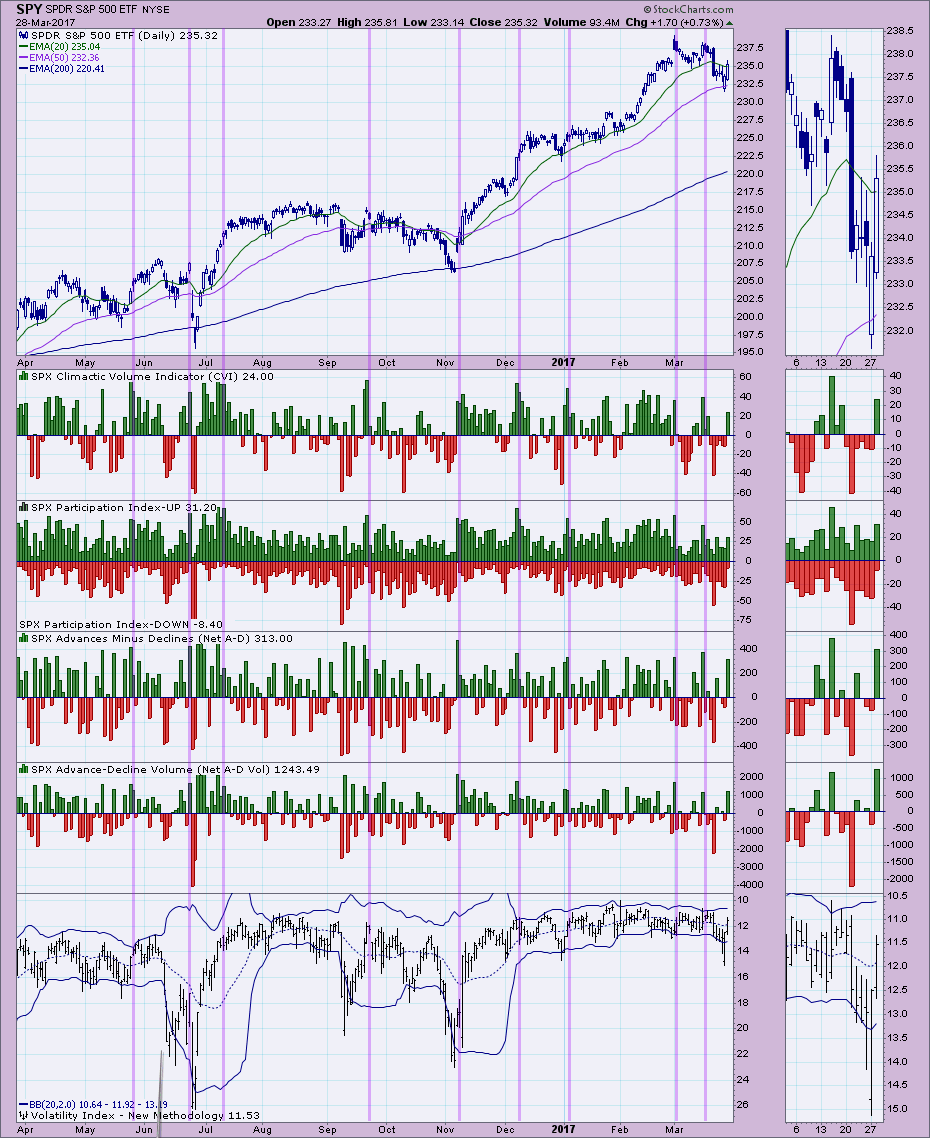
The chart below shows the negative climactic readings. Again, they don't always mean a pending decline. These spikes do line up nicely with the VIX and Net Advances-Declines.
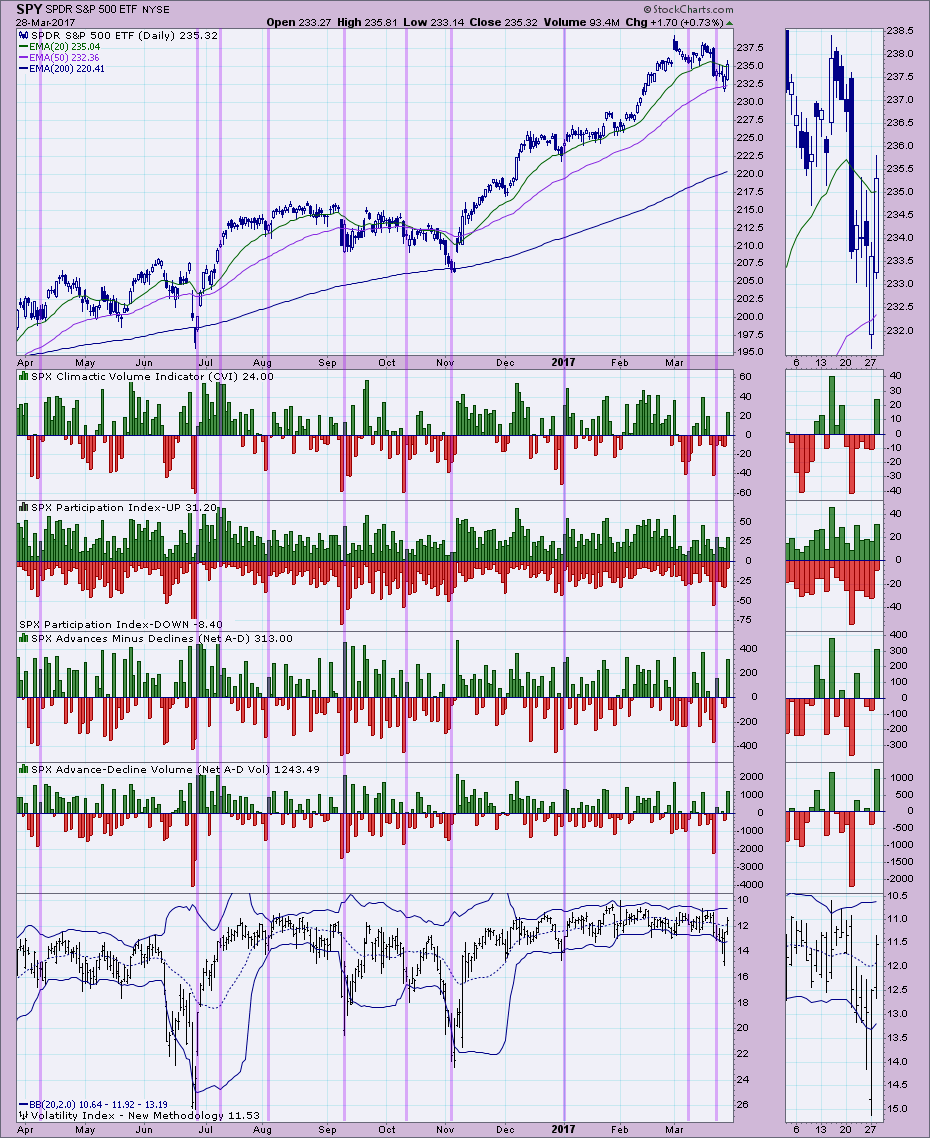
Conclusion: Today we saw climactic positive readings. Since this is the first rally day, I suspect we are looking at an initiation climax. An initiation climax suggests price will move in the direction of the spikes. In this case the climactic readings are in positive territory, so I would expect to see another day or two of rally. I'll be watching for more positive spikes. The longer the rally, the more likely positive climactic readings will be exhaustion climaxes. The VIX is rising toward the upper Bollinger Band. When it penetrates the upper band, we generally see a decline. Combining the VIX reading and the Net A-D initiation readings, I would expect higher prices to bring the VIX to the upper band before a price pullback and more climactic indicator readings.
The DecisionPoint LIVE Shared ChartList contains all of your favorite indexes, sectors and indicators, all annotated! Click on the link. Be sure and bookmark it!
Technical Analysis is a windsock, not a crystal ball.
Happy Charting!
- Erin


