*** IMPORTANT NOTE: We are making some changes to our DecisionPoint blogs and webinars starting on April 1st. Click here for more details. ***
Welcome to the DecisionPoint Weekly Wrap, where I make an end-of-week assessment of the internal condition, and trend of the stock market (S&P 500), the U.S. Dollar, Gold, Crude Oil, and Bonds.
There were no changes to the DecisionPoint Scoreboards today, but we did see some short-term softening earlier this week with three new NEUTRAL signals.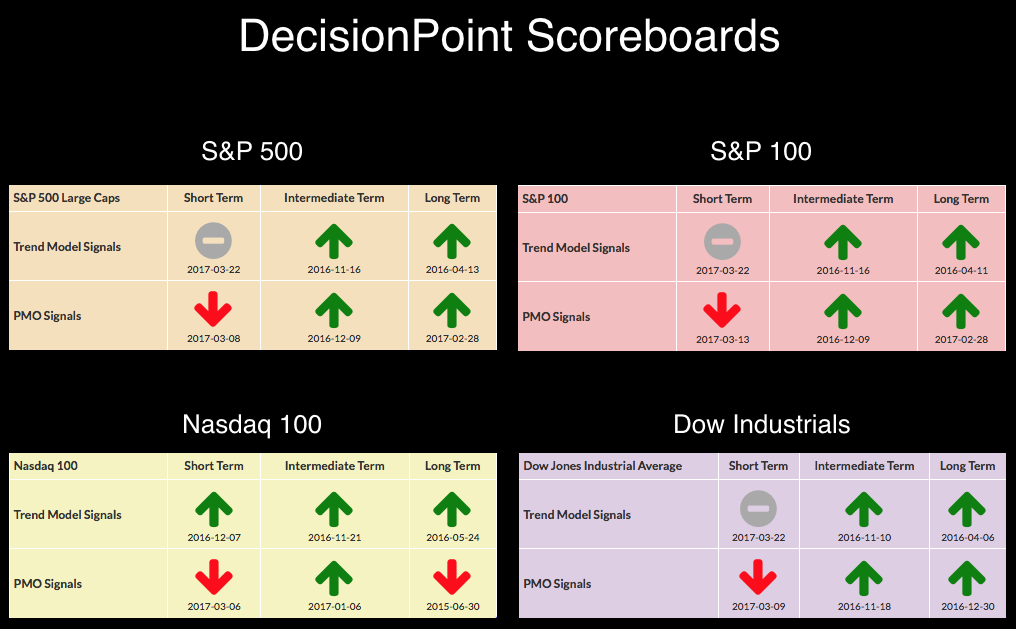
STOCKS: Based upon a 11/15/2016 Intermediate-Term Trend Model BUY signal, our current intermediate-term market posture for the S&P 500 (SPY) is bullish. The Long-Term Trend Model, which informs our long-term outlook, is on a BUY signal as of 4/1/2016 so our long-term posture is bullish.
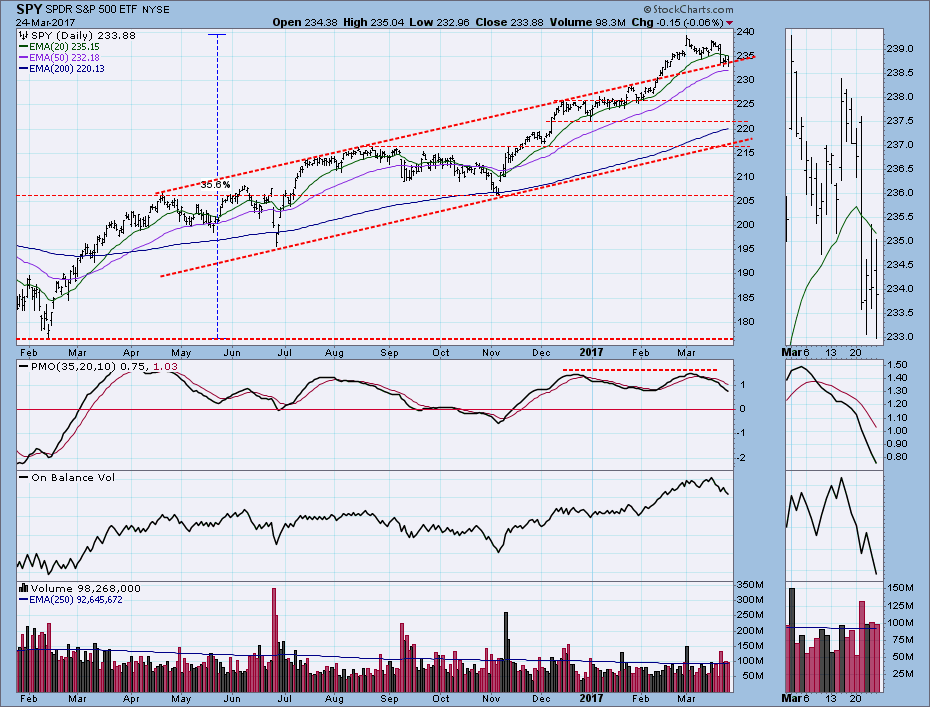
SPY broke above its long-term trading channel earlier this year, but the December and March PMO tops failed to confirm the new price highs. SPY is now testing the channel top support, and is probably headed lower. It is certainly due a correction.
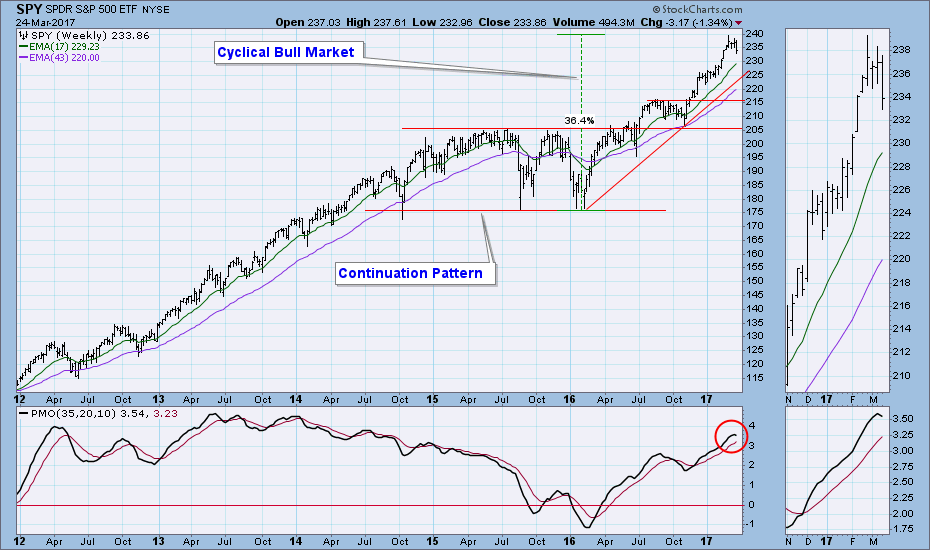
The weekly chart shows the rising trend line drawn from last year's low, a reasonable downside target. The weekly PMO has topped, which is very bearish.
Short-Term Indicators:
These indicators are modestly oversold, but they have plenty of room to fall before they get out of the normal range. Curiously, the STO-V bottomed today, probably because advancing and declining volume are about the same.
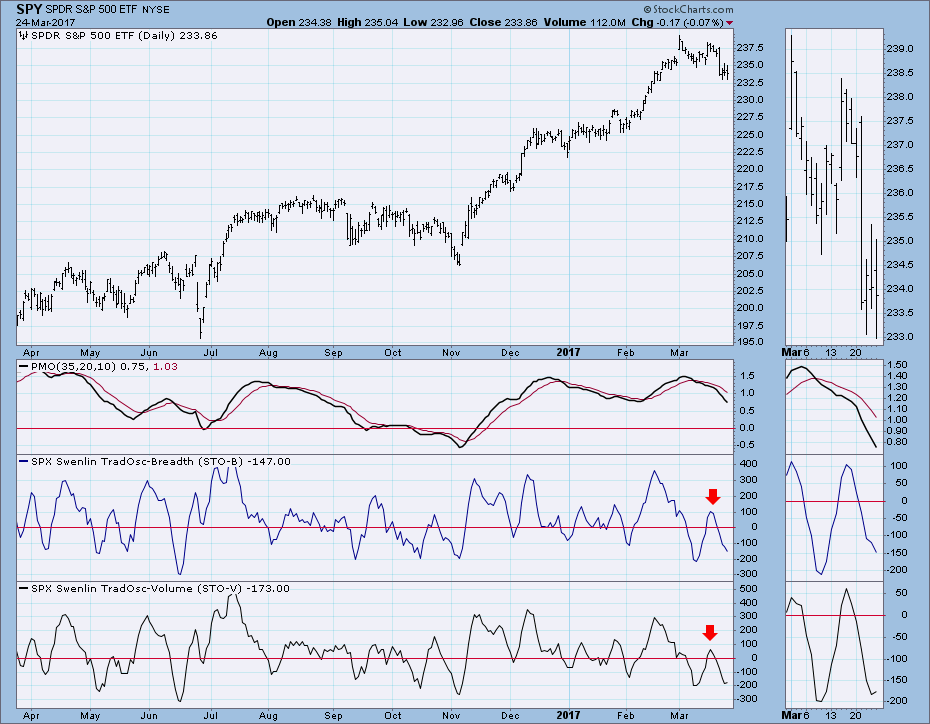
Intermediate-Term Indicators:
These indicators show the potential for a lot more price decline in this time frame. Note the negative divergences on all of them.
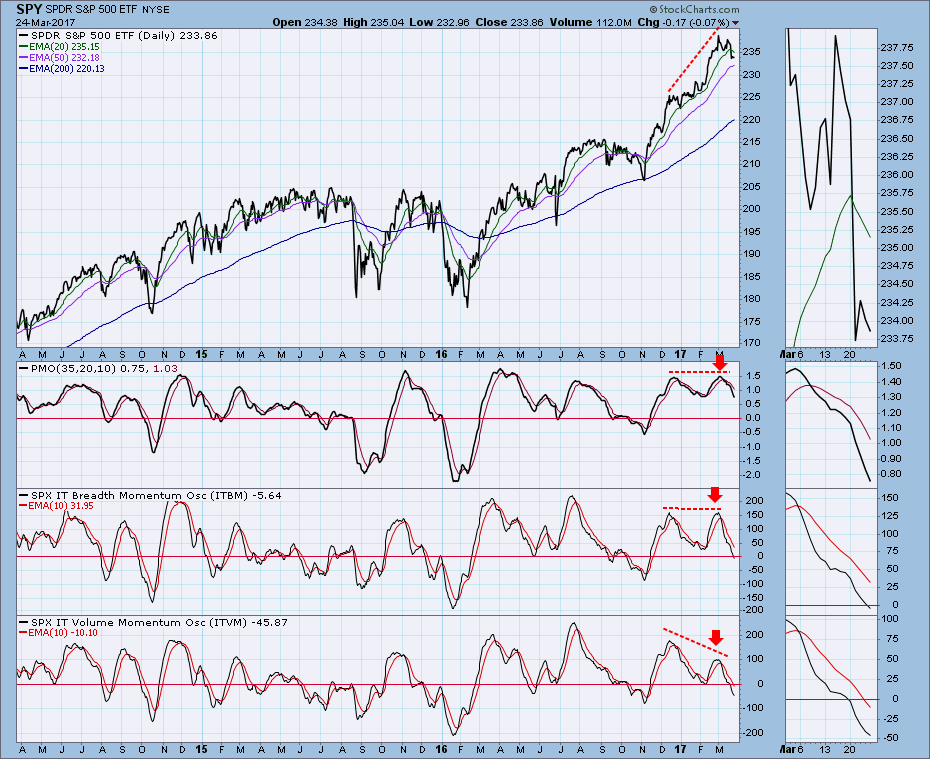
Conclusion: The market has been in a strong bull market since early last year, and it has advanced +35% during that time, in spite of two corrections. It appears that another correction began at the beginning of this month, and it started making more headway this week. I don't really have a downside target, but my notations on the daily SPY chart above suggest possible levels of support. My hope is that we get enough of a decline to get the intermediate-term indicators solidly oversold, because that would be a good place from which to launch the next leg up.
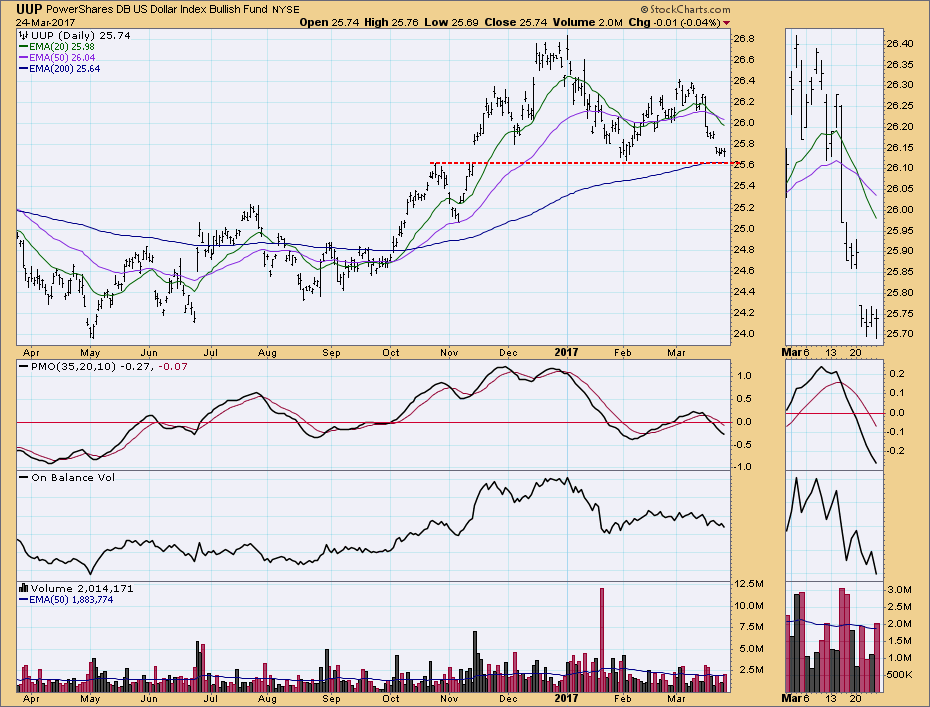
DOLLAR: As of 3/21/2017 the US Dollar Index ETF (UUP) is on an Intermediate-Term Trend Model Neutral signal. The Long-Term Trend Model, which informs our long-term outlook, is on a BUY signal as of 10/17/2016, so our long-term posture is bullish.
A down trend is defined as "a top beneath a top, and a bottom beneath a bottom." The January and March tops meet the first requirement, but we need a bottom lower that the February bottom to officially establish the down trend. We're not far away from that happening.
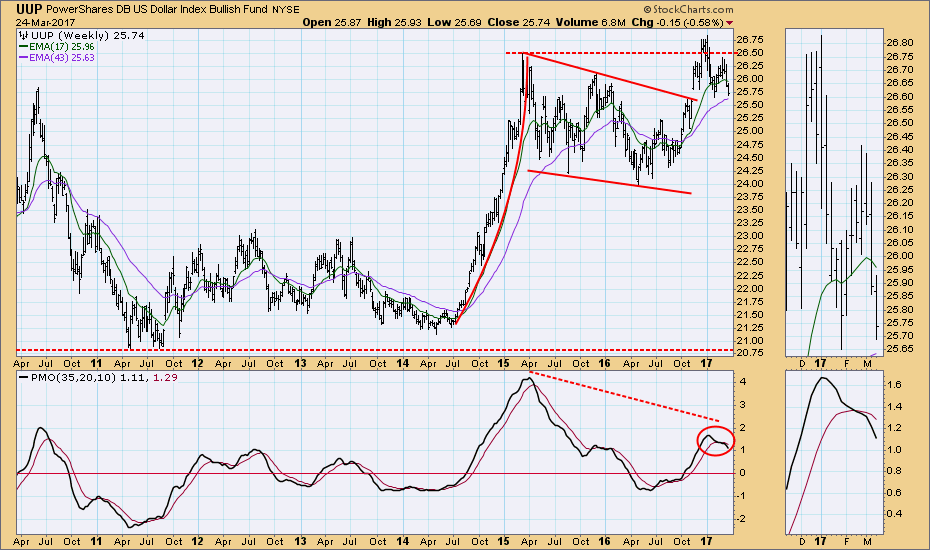
The weekly chart has a bearish bias, as there is a negative divergence on the PMO, and the PMO is below its signal line as well.
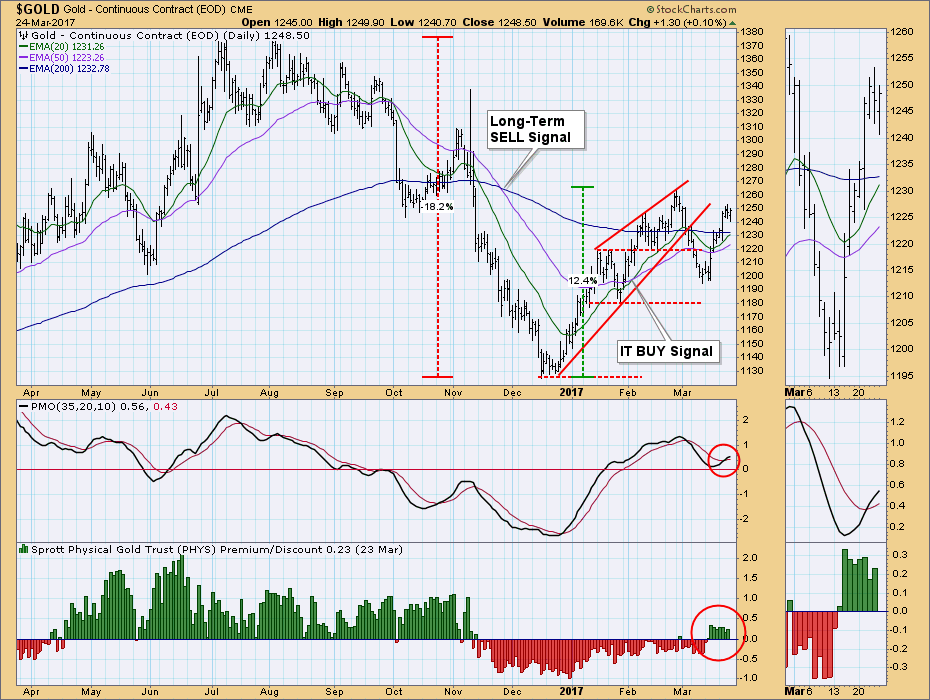
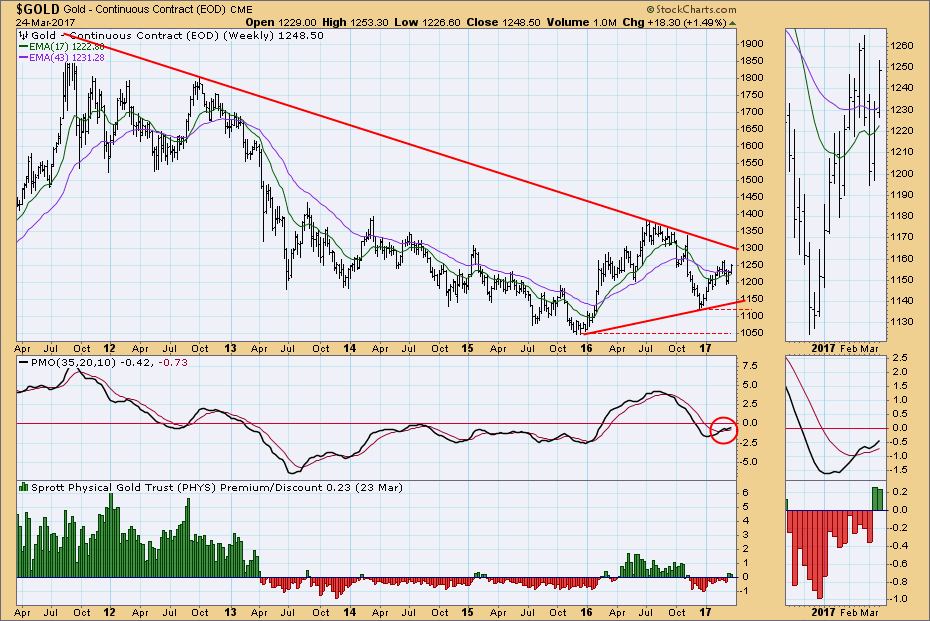
GOLD: As of 2/3/2016 Gold is on an Intermediate-Term Trend Model BUY signal. The Long-Term Trend Model, which informs our long-term outlook, is on a SELL signal as of 11/25/2016, so our long-term posture is bearish.
Gold continues to improve, as the PMO has bottomed and moved above its signal line. Also, PHYS persists in selling at a premium, which shows buyers are bullish.
The weekly chart shows the PMO rising above its signal line, which is evidence of improving internals in this time frame. Price is currently laboring in a triangle formation. Based upon the PMO configuration at this time, I would expect the triangle to resolve upward.
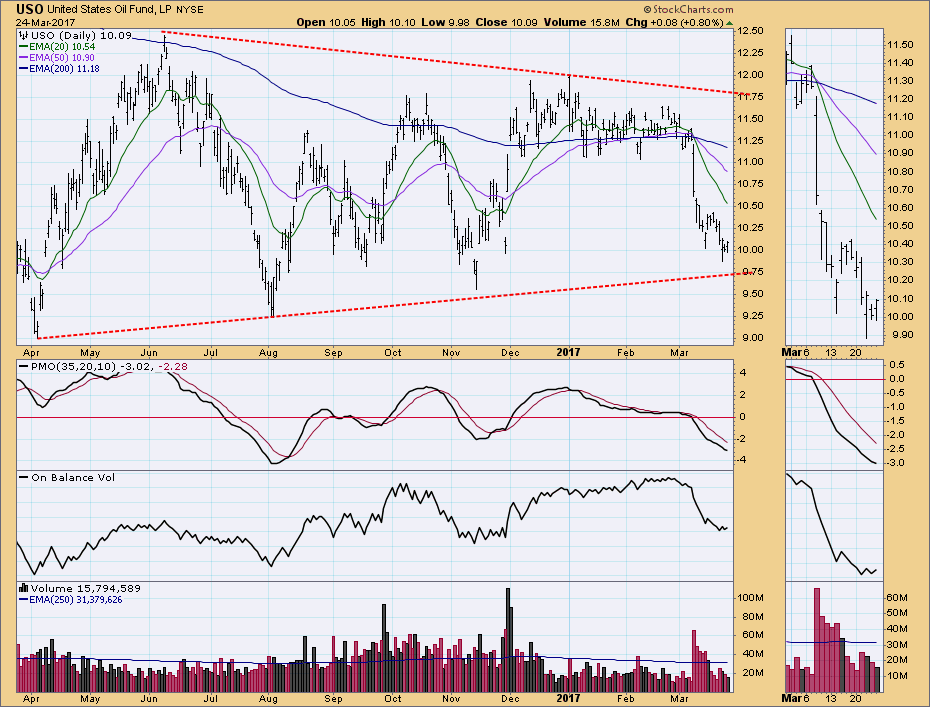
CRUDE OIL (USO): As of 3/8/2017 United States Oil Fund (USO) is on an Intermediate-Term Trend Model Neutral signal. The Long-Term Trend Model, which informs our long-term outlook, is on a SELL signal as of 3/9/2017, so our long-term posture is bearish.
This is a bearish chart, but the PMO is getting oversold, and price is nearing support.
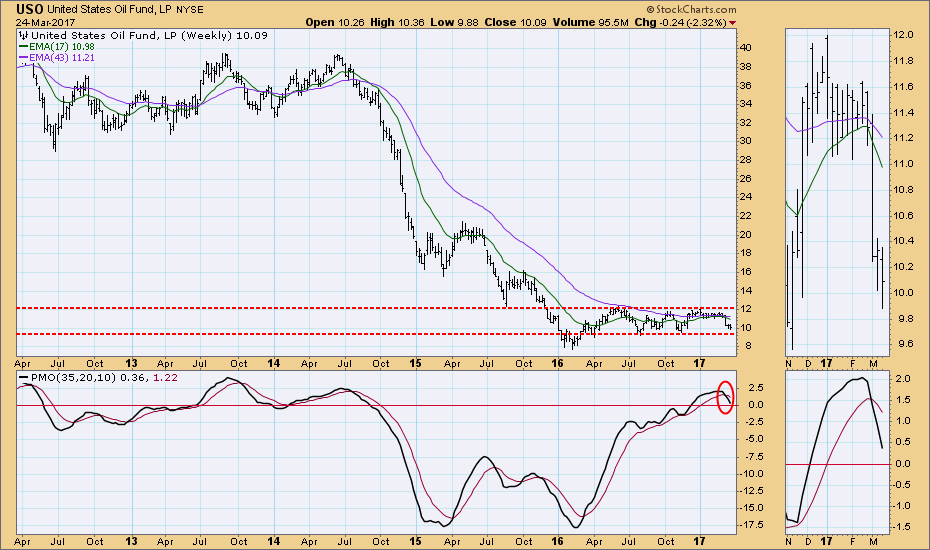
The weekly chart gives a better perspective, showing a precipitous decline followed by price entering a basing phase. Immediate-term support is at about 9.50, but longer-term support is at about 8.00. Until excess supplies of oil diminish, it is possible that the 8 to 12 trading range could continue for years.
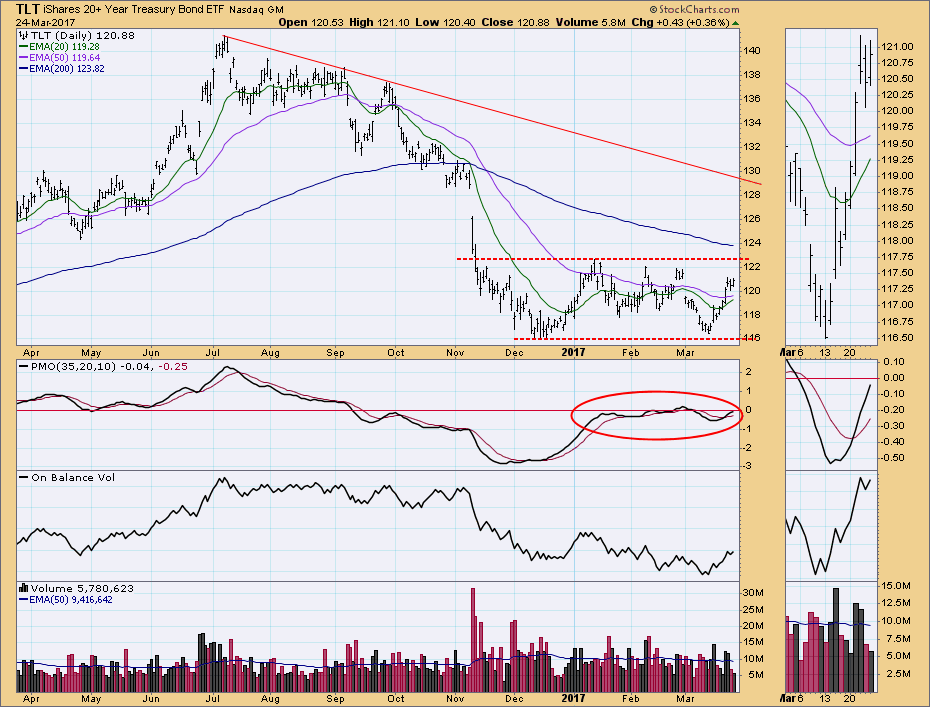
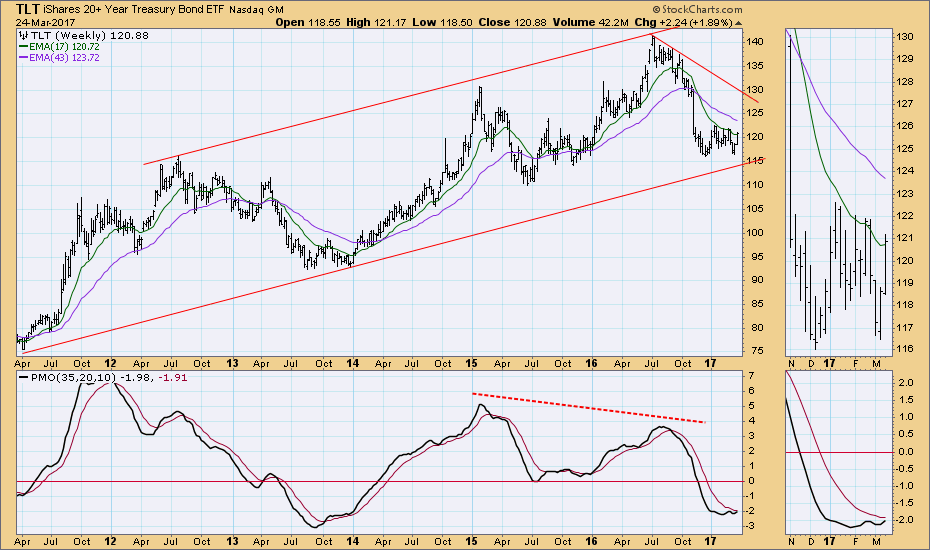
BONDS (TLT): As of 9/15/2016 The 20+ Year T-Bonds ETF (TLT) is on an Intermediate-Term Trend Model Neutral signal. The Long-Term Trend Model, which informs our long-term outlook, is on a SELL signal as of 11/17/2016, so our long-term posture is bearish.
After the all-time high for bonds in July, TLT began a decline that climaxed with a sharp drop in November. It has been in a trading range for almost five months. This consolidation is also called a continuation pattern, which implies that price will likely continue lower once the consolidation is completed. Notice how the PMO is drifting sideways is an indecisive manner. When it does this, crossovers are nothing more than noise.
The weekly PMO has formed a negative divergence, and it is bottoming in a relatively oversold level. Those are mixed signals, but, considering that the Fed is nudging interest rates higher, I think I will give the most weight to the negative divergence.
NOTE: The signal status reported herein is based upon mechanical trading model signals, specifically, the DecisionPoint Trend Model. They define the implied bias of the price index based upon moving average relationships, but they do not necessarily call for a specific action. They are information flags that should prompt chart review. Further, they do not call for continuous buying or selling during the life of the signal. For example, a BUY signal will probably (but not necessarily) return the best results if action is taken soon after the signal is generated. Additional opportunities for buying may be found as price zigzags higher, but the trader must look for optimum entry points. Conversely, exit points to preserve gains (or minimize losses) may be evident before the model mechanically closes the signal.
The DecisionPoint LIVE Shared ChartList has launched! Click on the link and you'll find webinar and blog chart spotlights. Be sure and bookmark it!
Technical Analysis is a windsock, not a crystal ball.
Happy Charting!
- Carl


