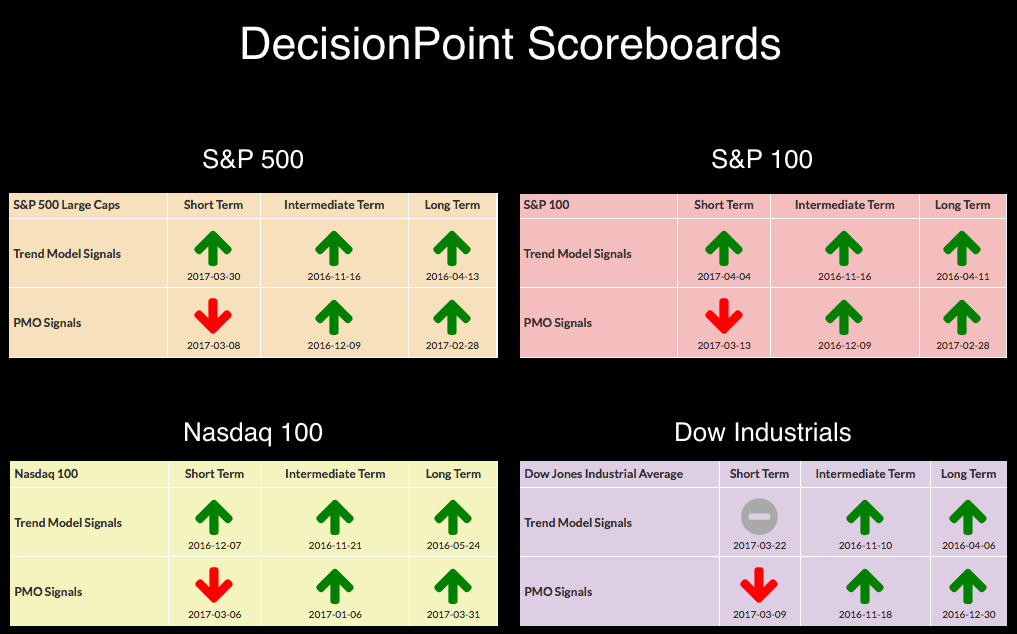
 No new changes on the DP Scoreboards. I was expecting to see the Dow trigger a Short-Term Trend Model BUY signal, but with yesterday's failed breakout and price stagnating over the past week or two, you can see that the 5-EMA is maintaining below the 20-EMA with little interest in crossing back above to generate the signal.
The purpose of the DecisionPoint Alert Daily Update is to quickly review the day's action, internal condition, and Trend Model status of the broad market (S&P 500), the nine SPDR Sectors, the U.S. Dollar, Gold, Crude Oil, and Bonds. To ensure that using this daily reference will be quick and painless, we are as brief as possible, and sometimes we let a chart speak for itself.
SIGNALS: Here we include charts of any important signal changes triggered today by our Intermediate-Term Trend Model.
No new signal changes.
NOTE: Mechanical trading model signals define the implied bias of the price index based upon moving average relationships, but they do not necessarily call for a specific action. They are information flags that should prompt chart review. Further, they do not call for continuous buying or selling during the life of the signal. For example, a BUY signal will probably return the best results if action is taken soon after the signal is generated. Additional opportunities for buying may be found as price zigzags higher, but the trader must look for optimum entry points. Conversely, exit points to preserve gains (or minimize losses) may be evident before the model mechanically closes the signal.
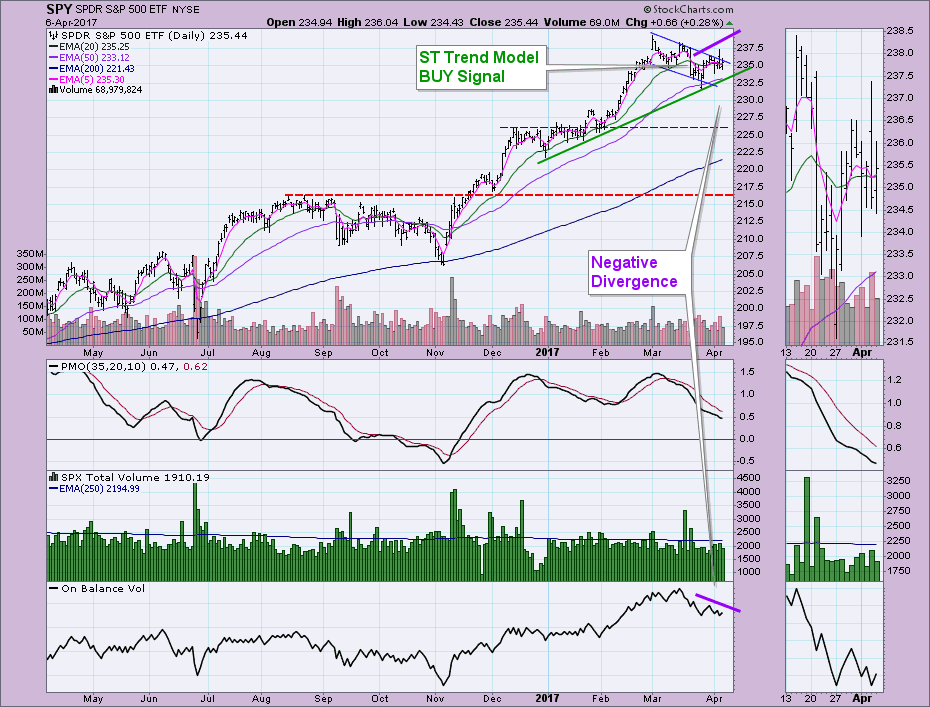
STOCKS: Based upon a 11/15/2016 Intermediate-Term Trend Model BUY signal, our current intermediate-term market posture for the S&P 500 (SPY) is bullish. The Long-Term Trend Model, which informs our long-term outlook, is on a BUY signal as of 4/1/2016 so our long-term posture is bullish.
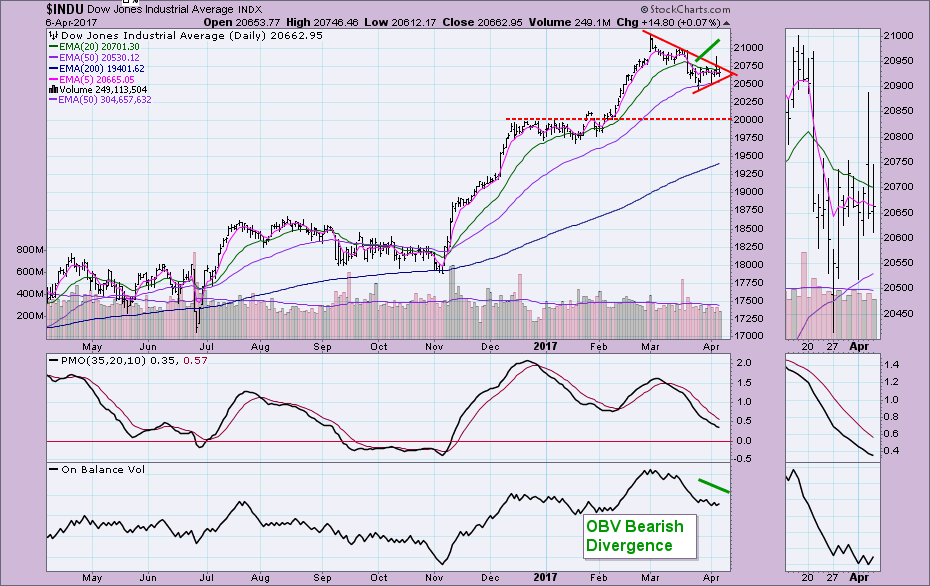
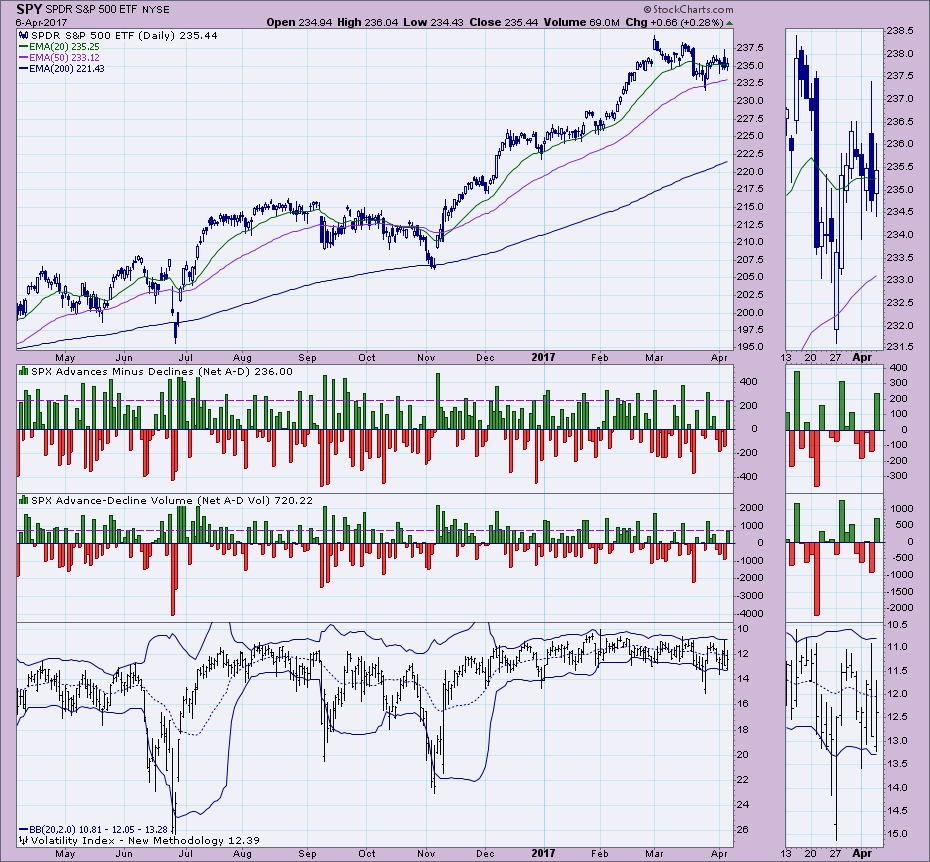
The ascending triangle completed as expected, but a double-top formed yesterday and fulfilled its minimum downside target as price began to tumble yesterday afternoon.
Price attempted a breakout yesterday but fell back into the channel. Price traded pretty much within it all day. The PMO may be decelerating for a bottom, but looking at the bearish divergence on the OBV I think we will move to test rising bottoms support first.
Ultra-Short-Term Indicators: Net A-D was elevated, but volume didn't confirm on net A-D volume. It was slightly above average, but I don't see any confirmation coming from the VIX either as it sits right in the middle of the BB channel.
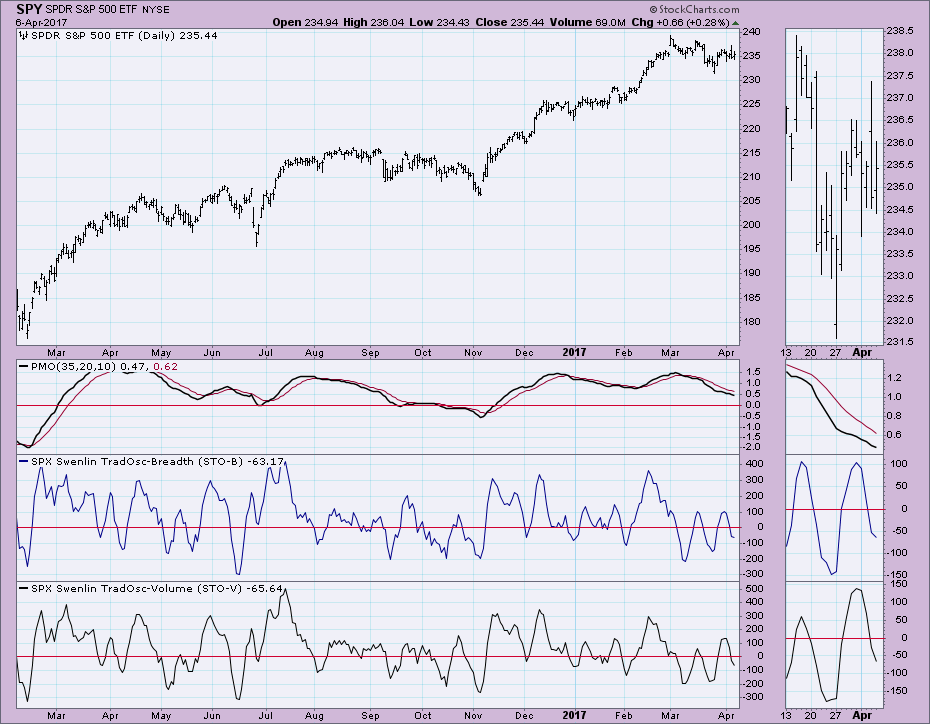
Short-Term Indicators: These indicators may be turning back up which would be great right now considering price is about to test the rising bottoms trendline. At this point, they are continuing lower so price may take a move to the March low first.
Intermediate-Term Indicators: These indicators have been mixed so I like that we see both turning up now. Maybe this time the rise will stick and both will show positive crossovers.
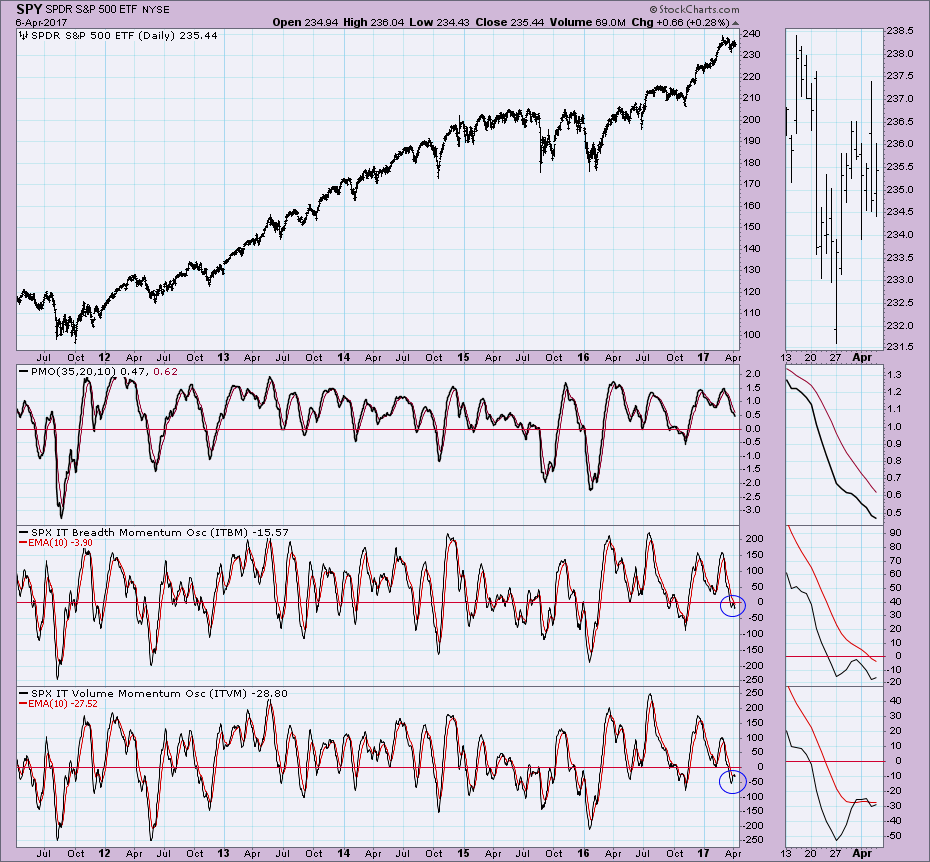
Conclusion: I believe the market may have a few more down days in store. However, rising bottoms support looks pretty good and IT indicators appear to be turning up bullishly.
**Don't miss the DecisionPoint Alert Daily Commentary! Click on "Email Updates" at the end of this blog page to be notified as soon as it's published at the end of the market day.**
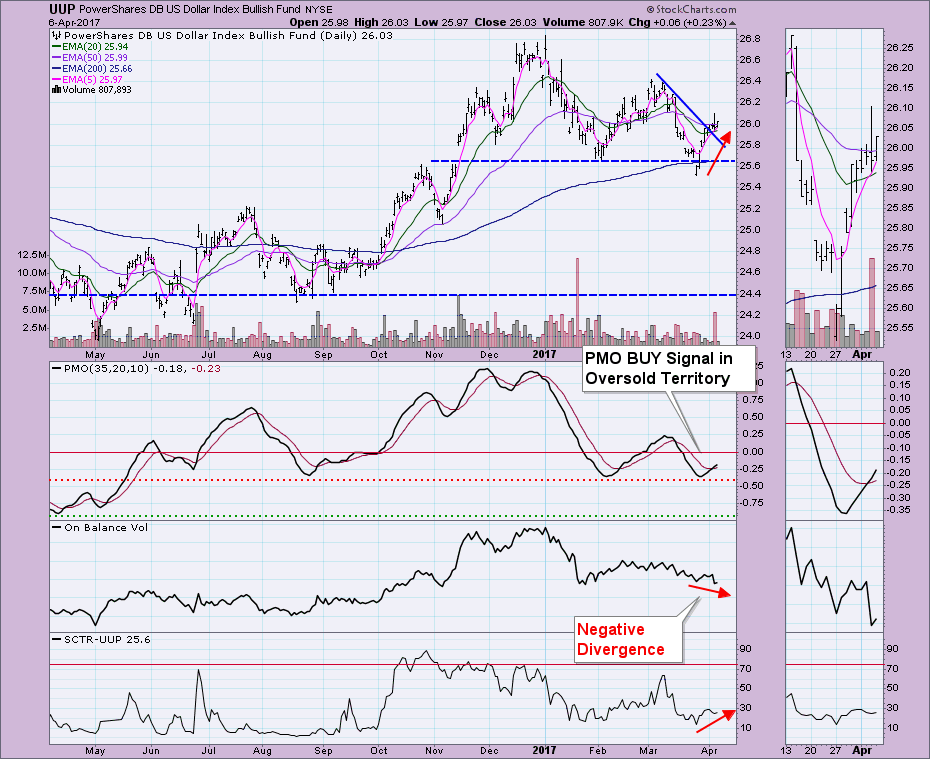
DOLLAR: As of 3/21/2017 the US Dollar Index ETF (UUP) is on an Intermediate-Term Trend Model Neutral signal. The Long-Term Trend Model, which informs our long-term outlook, is on a BUY signal as of 10/17/2016, so our long-term posture is bullish.
The Dollar continues to show strength. About the only negative on this chart would be the negative divergence between the OBV and price bottoms. This suggests we could see a pullback before the rally continues.
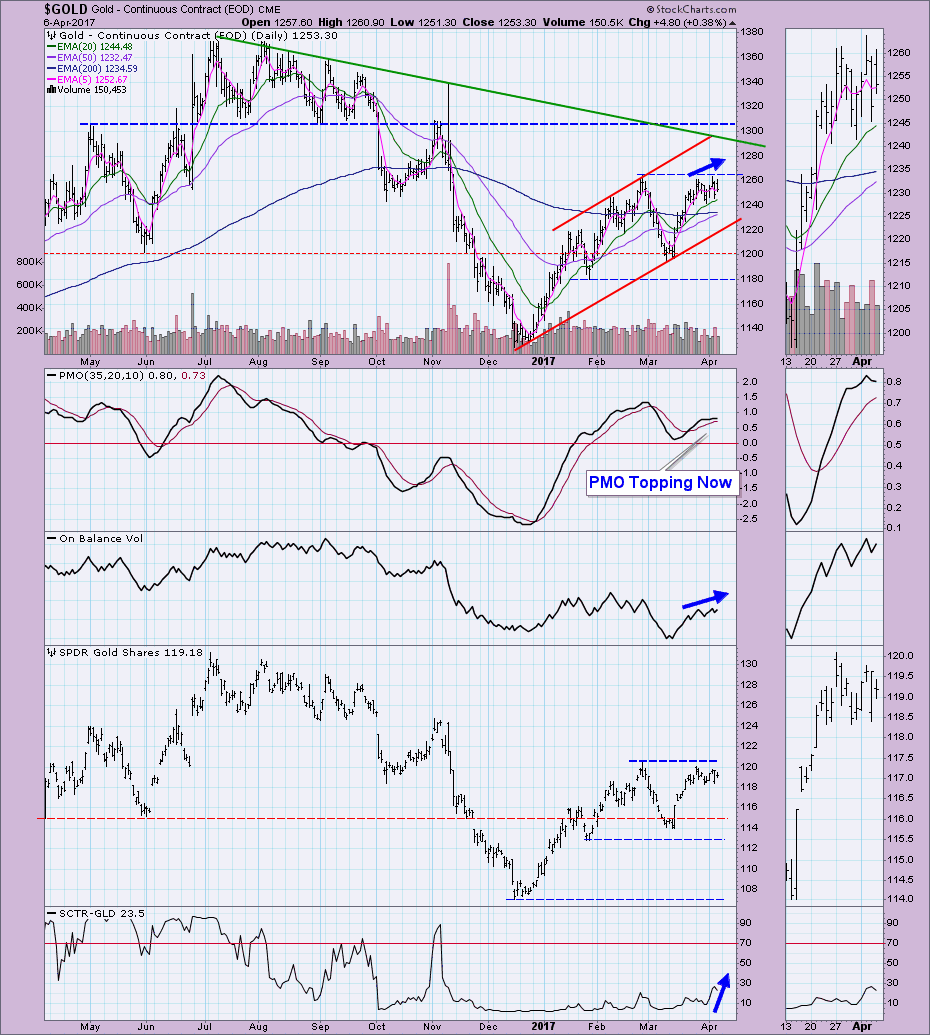
GOLD: As of 2/3/2016 Gold is on an Intermediate-Term Trend Model BUY signal. The Long-Term Trend Model, which informs our long-term outlook, is on a SELL signal as of 11/25/2016, so our long-term posture is bearish.
I'm still mostly bullish on Gold right now. I do think that price will have to test the bottom of this trend channel before it makes another attempt at reaching resistance along the declining tops trendline. The PMO is waffling but the OBV is still showing a bullish confirmation of rising price tops.
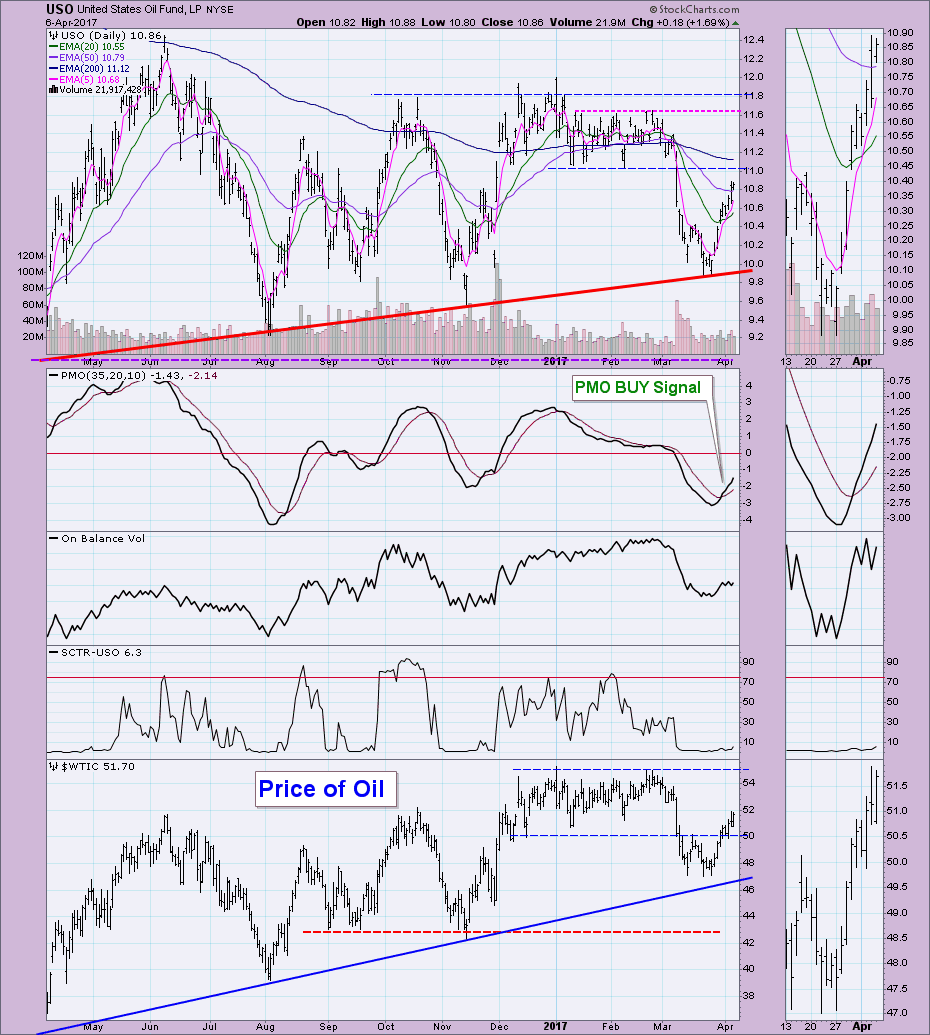
CRUDE OIL (USO): As of 3/8/2017 United States Oil Fund (USO) is on an Intermediate-Term Trend Model Neutral signal. The Long-Term Trend Model, which informs our long-term outlook, is on a SELL signal as of 3/9/2017, so our long-term posture is bearish.
Resistance is now looming at $11, but I think this rally could eek out more upside. The PMO is showing no signs of deceleration and it is far from being overbought...it hasn't even reached neutral territory yet. Oil has already beaten overhead resistance and has room to go test the top of the range at $55/barrel.
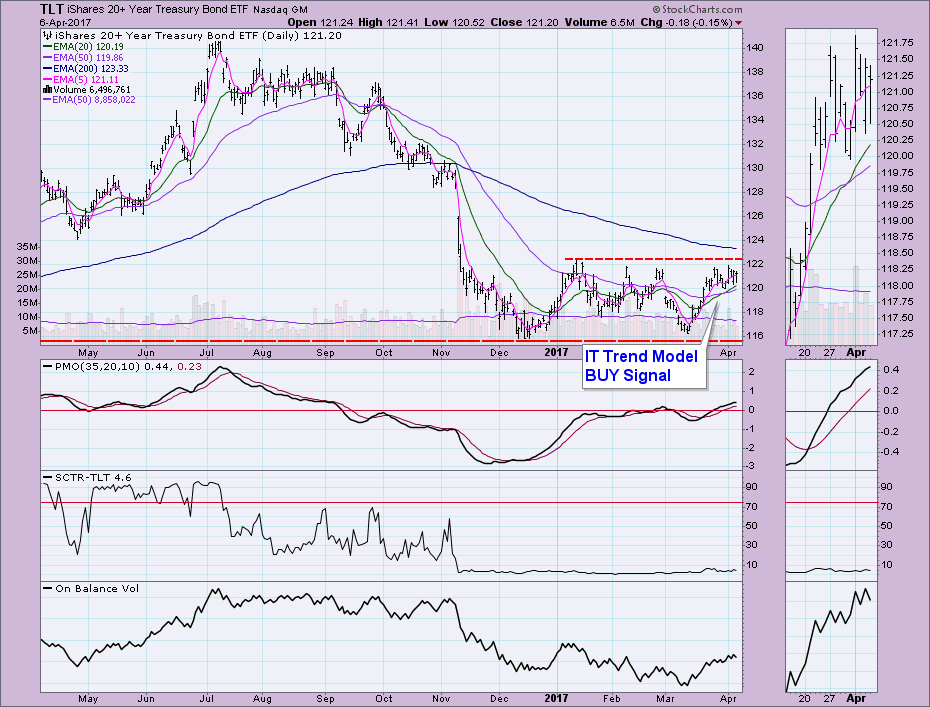
BONDS (TLT): As of 9/15/2016 The 20+ Year T-Bonds ETF (TLT) is on an Intermediate-Term Trend Model Neutral signal. The Long-Term Trend Model, which informs our long-term outlook, is on a SELL signal as of 11/17/2016, so our long-term posture is bearish.
The PMO is rising, but not convincingly in my opinion. Price just reached resistance and failed for a fourth time to overcome. The OBV still is rising with the PMO, but this price pattern looks toppy.
The DecisionPoint LIVE Shared ChartList has launched! Click on the link and you'll find webinar and blog chart spotlights. Be sure and bookmark it!
Technical Analysis is a windsock, not a crystal ball.
Happy Charting!
- Erin


