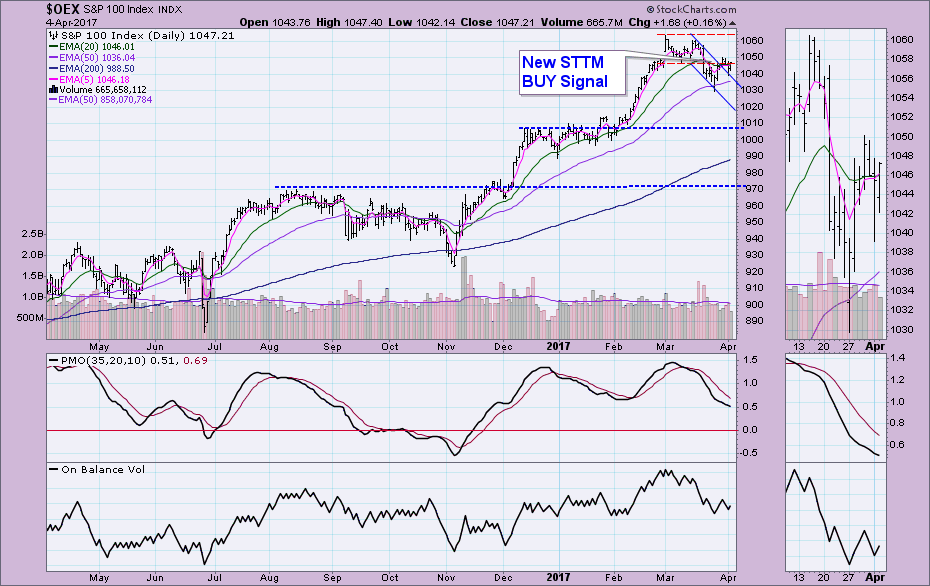
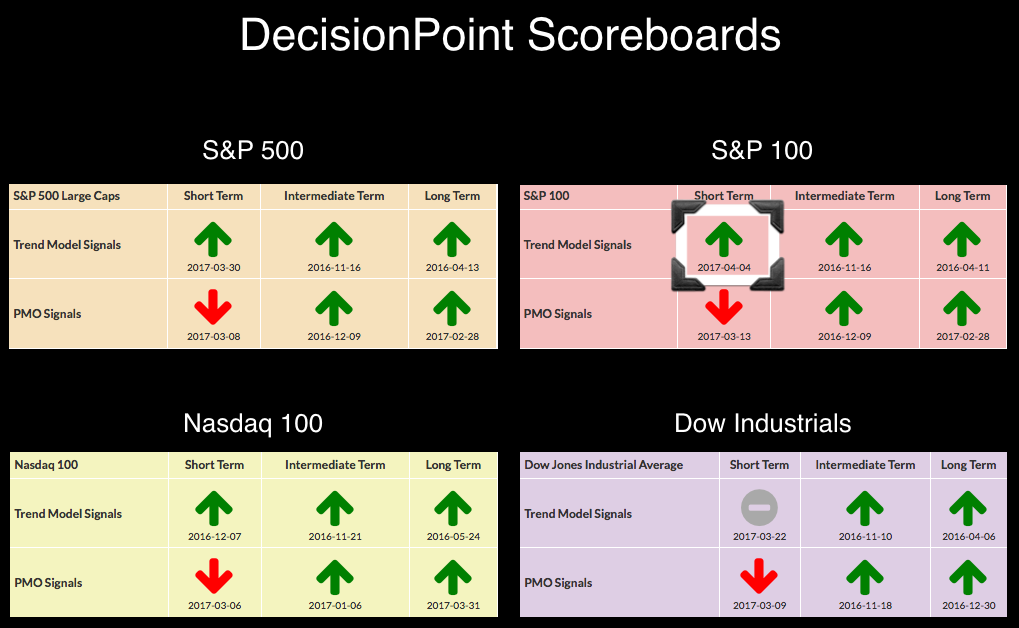
 The DecisionPoint Scoreboards updated with a new signal change today. The $OEX just managed a new Short-Term Trend Model BUY signal. The 5-EMA crossed above the 20-EMA triggering the signal. Right now price is running along the declining tops trendline. The PMO is no longer rising and that is a problem.
The purpose of the DecisionPoint Alert Daily Update is to quickly review the day's action, internal condition, and Trend Model status of the broad market (S&P 500), the nine SPDR Sectors, the U.S. Dollar, Gold, Crude Oil, and Bonds. To ensure that using this daily reference will be quick and painless, we are as brief as possible, and sometimes we let a chart speak for itself.
SIGNALS: Here we include charts of any important signal changes triggered today by our Intermediate-Term Trend Model.

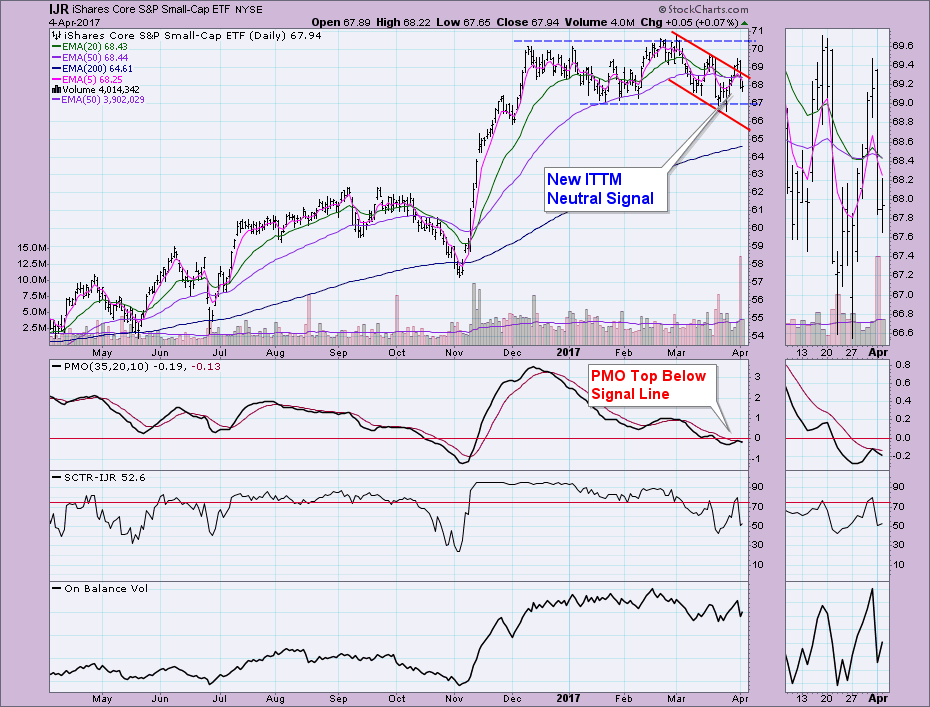
An IT Trend Model BUY signal was generated on the S&P 600 ETF (IJR). I was very bullish on small-caps last week, but they are losing their shine quickly. IJR sunk back below the declining tops trend line before even testing all time highs. Additionally, the PMO has turned down below its signal line, suggesting support at $67 could be in jeopardy.
NOTE: Mechanical trading model signals define the implied bias of the price index based upon moving average relationships, but they do not necessarily call for a specific action. They are information flags that should prompt chart review. Further, they do not call for continuous buying or selling during the life of the signal. For example, a BUY signal will probably return the best results if action is taken soon after the signal is generated. Additional opportunities for buying may be found as price zigzags higher, but the trader must look for optimum entry points. Conversely, exit points to preserve gains (or minimize losses) may be evident before the model mechanically closes the signal.
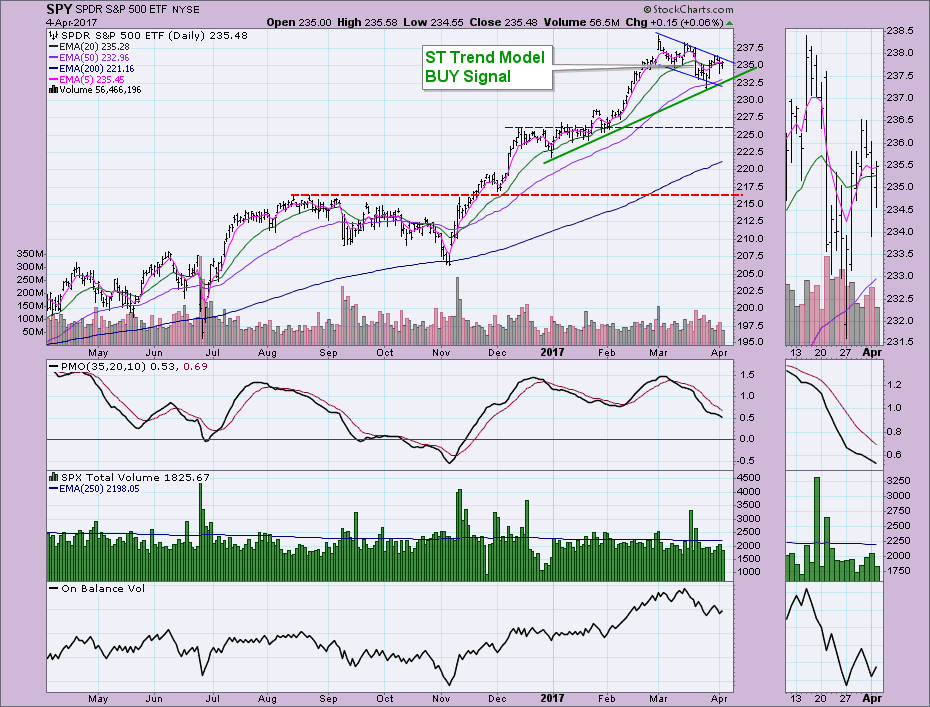
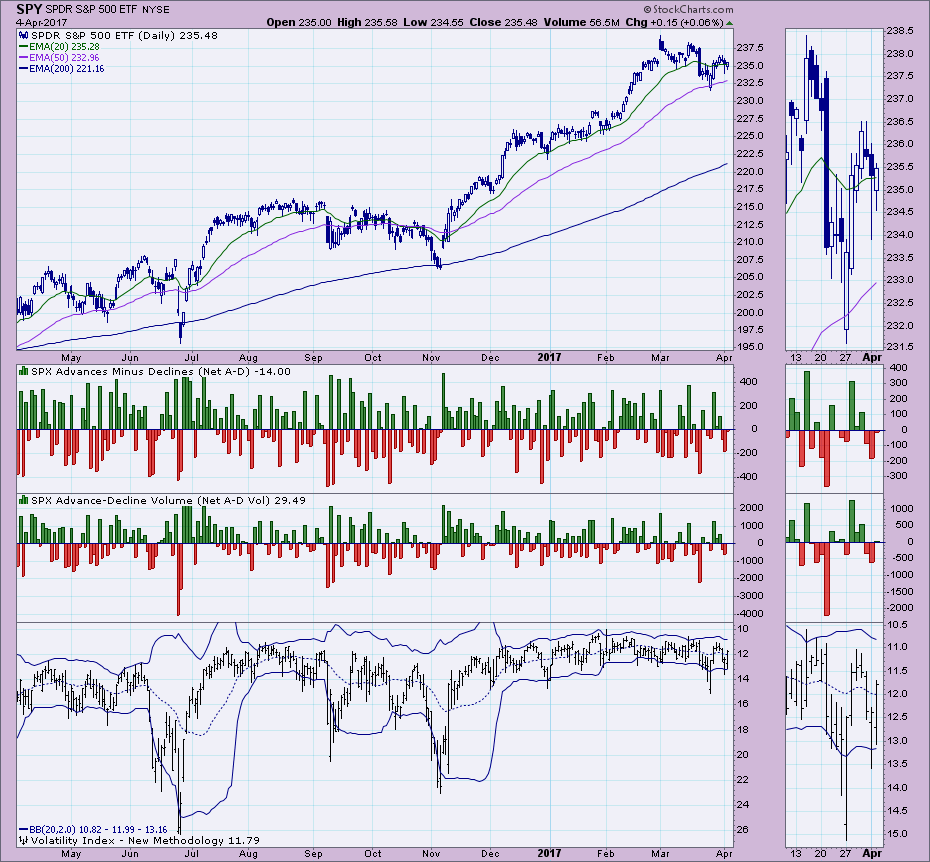
STOCKS: Based upon a 11/15/2016 Intermediate-Term Trend Model BUY signal, our current intermediate-term market posture for the S&P 500 (SPY) is bullish. The Long-Term Trend Model, which informs our long-term outlook, is on a BUY signal as of 4/1/2016 so our long-term posture is bullish.
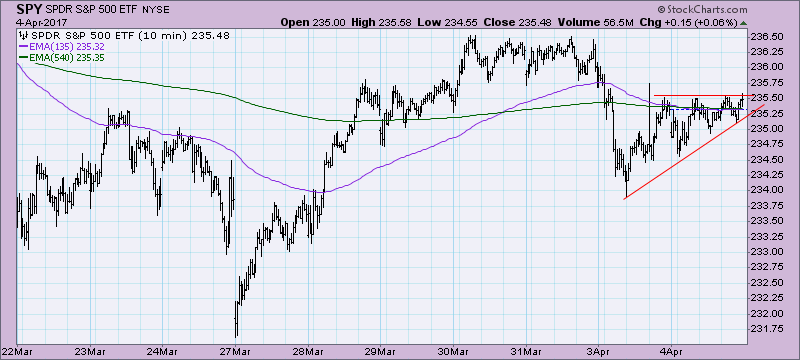
The ascending triangle formation on the 10-minute bar chart is bullish and favors a breakout above horizontal resistance.
While that breakout would be welcome, it not likely be able to push price out of the current declining trend channel. A decision point is rapidly nearing. Support along the rising bottoms trendline drawn from the December 2016 low held last time, but with the PMO declining and price unable to break out of the declining trend channel, I'm expecting it to break down.
Ultra-Short-Term Indicators: Nothing interesting here.
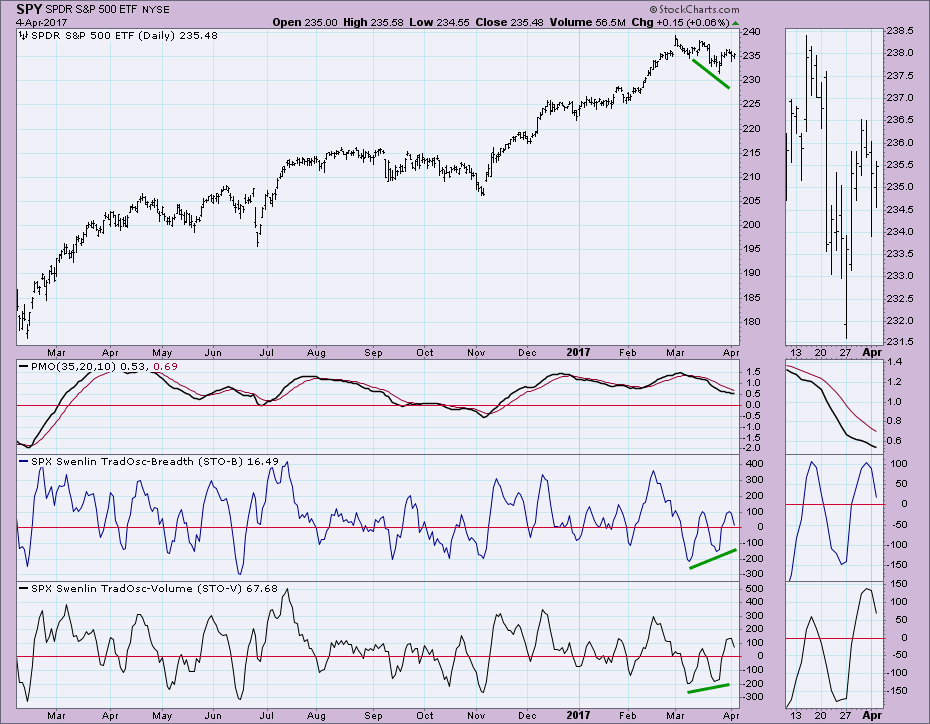
Short-Term Indicators: I'm afraid that the short rally last week is all we are going to get out of the positive divergences between indicator and price bottoms. Now that both have topped and are heading lower, I would expect price to follow.
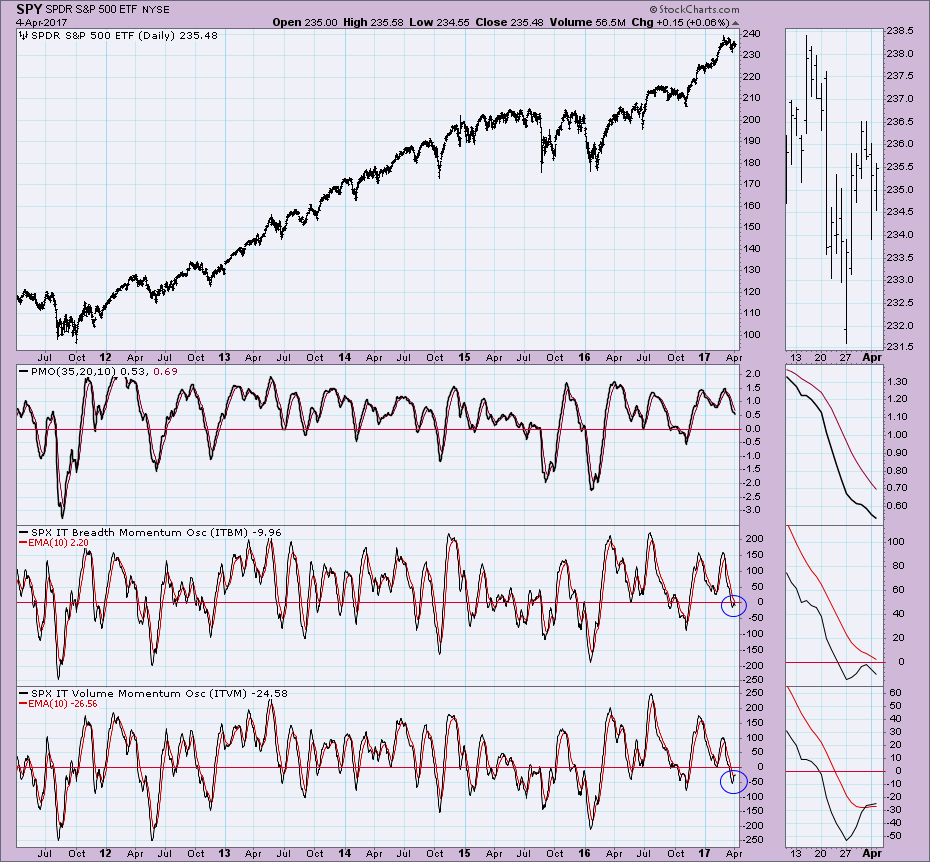
Intermediate-Term Indicators: These indicators are mixed with the ITBM turning down below its signal line and the ITVM on a positive crossover move. I don't think it is out of the question that these indicators will both bottom, but seeing the failure of the ITVM is bearish.
Conclusion: The short-term rally of last week ended as price fell back at resistance, staying in its declining trend channel. Indicators are looking bearish in the short-term and although we don't have confirmation on intermediate-term indicators yet, I am moving bearish in short term and neutral for intermediate term.
**Don't miss the DecisionPoint Alert Daily Commentary! Click on "Email Updates" at the end of this blog page to be notified as soon as it's published at the end of the market day.**
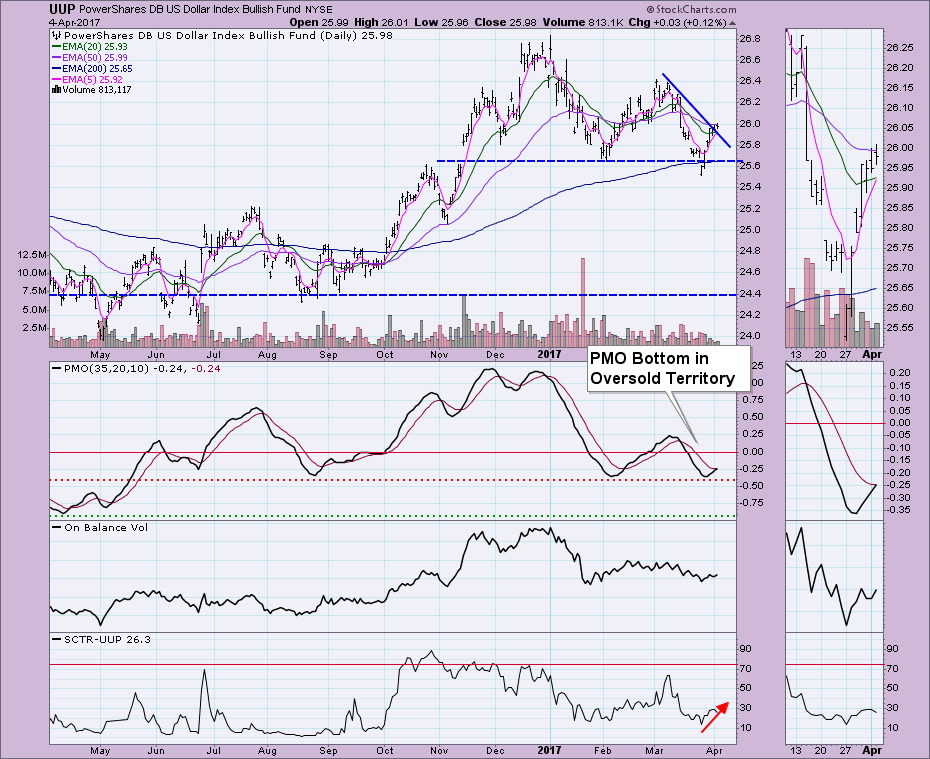
DOLLAR: As of 3/21/2017 the US Dollar Index ETF (UUP) is on an Intermediate-Term Trend Model Neutral signal. The Long-Term Trend Model, which informs our long-term outlook, is on a BUY signal as of 10/17/2016, so our long-term posture is bullish.
The Dollar is breaking out and the PMO is about to get a new BUY signal. I'd expect more rally.
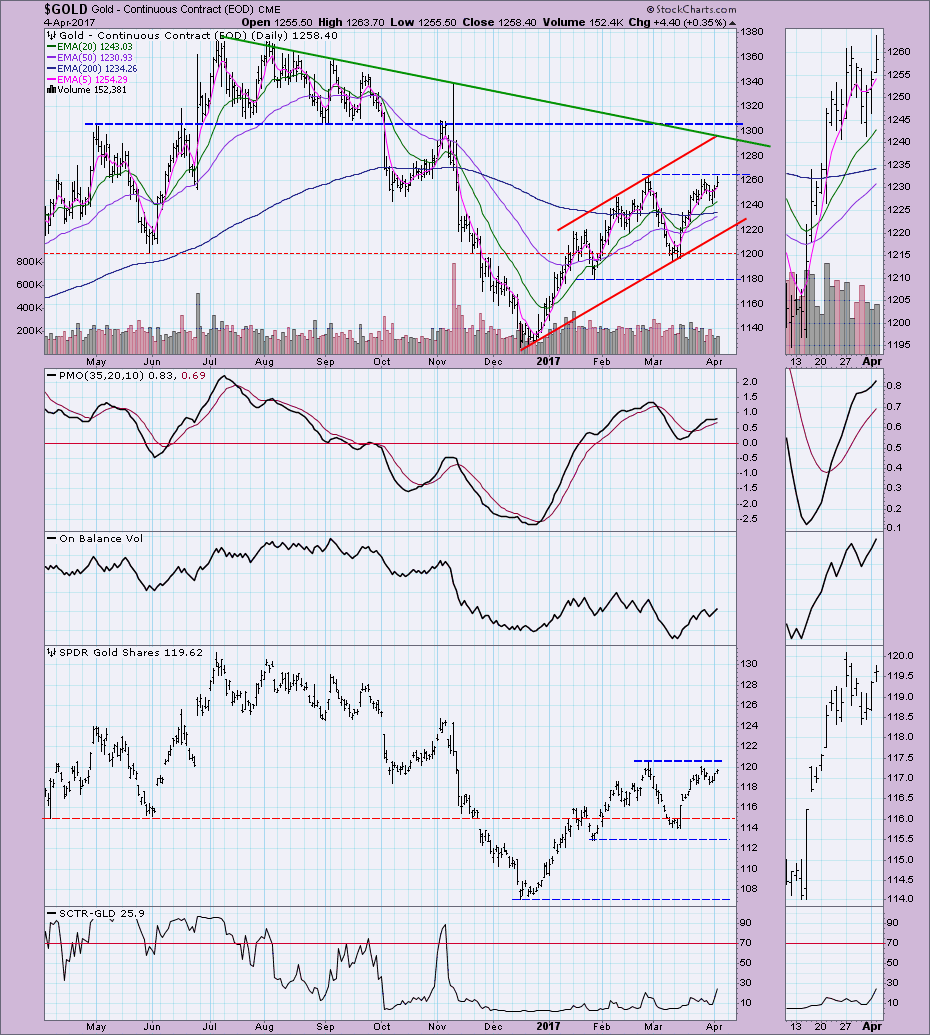
GOLD: As of 2/3/2016 Gold is on an Intermediate-Term Trend Model BUY signal. The Long-Term Trend Model, which informs our long-term outlook, is on a SELL signal as of 11/25/2016, so our long-term posture is bearish.
Resistance was hit, but not overcome. Looking at the favorable Dollar chart, I'm only cautiously optimistic on Gold. I like that the PMO has accelerated upward as price reached resistance. The OBV reading moved above the previous OBV top which is good.
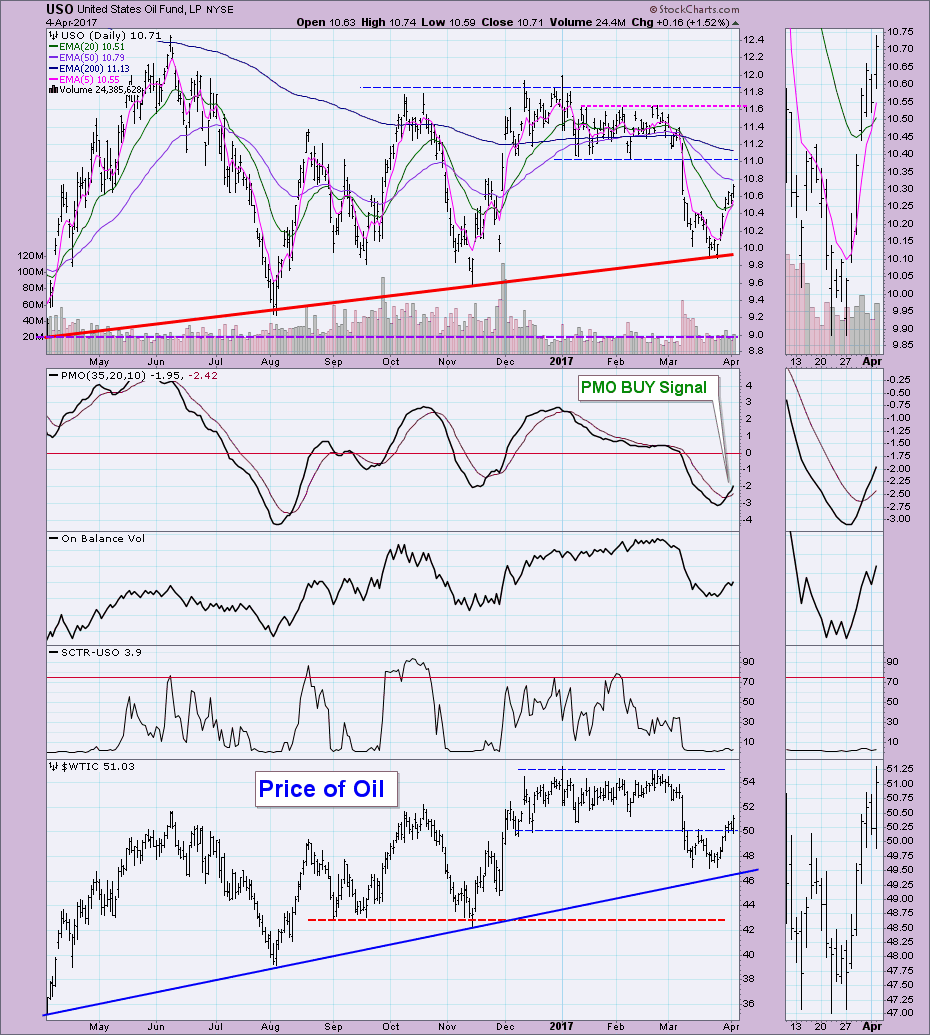
CRUDE OIL (USO): As of 3/8/2017 United States Oil Fund (USO) is on an Intermediate-Term Trend Model Neutral signal. The Long-Term Trend Model, which informs our long-term outlook, is on a SELL signal as of 3/9/2017, so our long-term posture is bearish.
I don't see anything here that suggests price won't reach the $11 resistance line for USO.
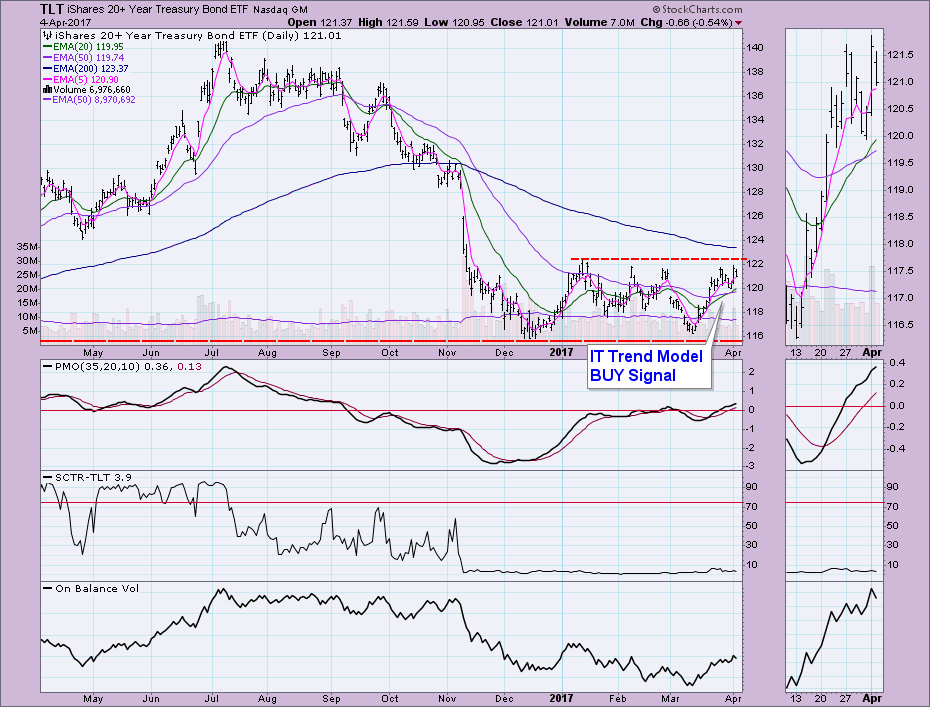
BONDS (TLT): As of 9/15/2016 The 20+ Year T-Bonds ETF (TLT) is on an Intermediate-Term Trend Model Neutral signal. The Long-Term Trend Model, which informs our long-term outlook, is on a SELL signal as of 11/17/2016, so our long-term posture is bearish.
TLT has failed yet again to scale resistance. The PMO is still rising and the OBV looks promising. I'm expecting a breakout given the ITTM BUY signal along with a bullish PMO and OBV.
The DecisionPoint LIVE Shared ChartList has launched! Click on the link and you'll find webinar and blog chart spotlights. Be sure and bookmark it!
Technical Analysis is a windsock, not a crystal ball.
Happy Charting!
- Erin

