
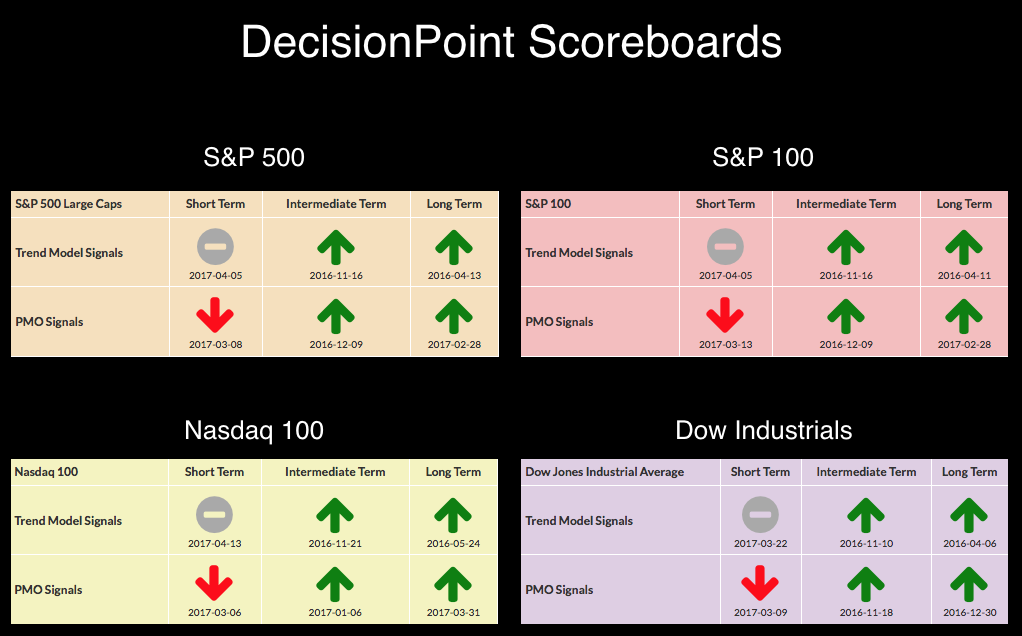
A look at the DecisionPoint Scoreboards reminds us that the short term is weak. Don't be fooled by the IT PMO BUY signals on the boards right now, I happen to know we have negative crossovers showing up on the weekly charts for three of these indexes. It's not surprising that our indicators are in line with the current scores.
The purpose of the DecisionPoint Alert Daily Update is to quickly review the day's action, internal condition, and Trend Model status of the broad market (S&P 500), the nine SPDR Sectors, the U.S. Dollar, Gold, Crude Oil, and Bonds. To ensure that using this daily reference will be quick and painless, we are as brief as possible, and sometimes we let a chart speak for itself.
SIGNALS: Here we include charts of any important signal changes triggered today by our Intermediate-Term Trend Model.
No new signals.
NOTE: Mechanical trading model signals define the implied bias of the price index based upon moving average relationships, but they do not necessarily call for a specific action. They are information flags that should prompt chart review. Further, they do not call for continuous buying or selling during the life of the signal. For example, a BUY signal will probably return the best results if action is taken soon after the signal is generated. Additional opportunities for buying may be found as price zigzags higher, but the trader must look for optimum entry points. Conversely, exit points to preserve gains (or minimize losses) may be evident before the model mechanically closes the signal.
STOCKS: Based upon a 11/15/2016 Intermediate-Term Trend Model BUY signal, our current intermediate-term market posture for the S&P 500 (SPY) is bullish. The Long-Term Trend Model, which informs our long-term outlook, is on a BUY signal as of 4/1/2016 so our long-term posture is bullish.
Rising bottoms support was broken. I don't think this decline is finished based on the negative divergence that is showing on the OBV and price bottoms.
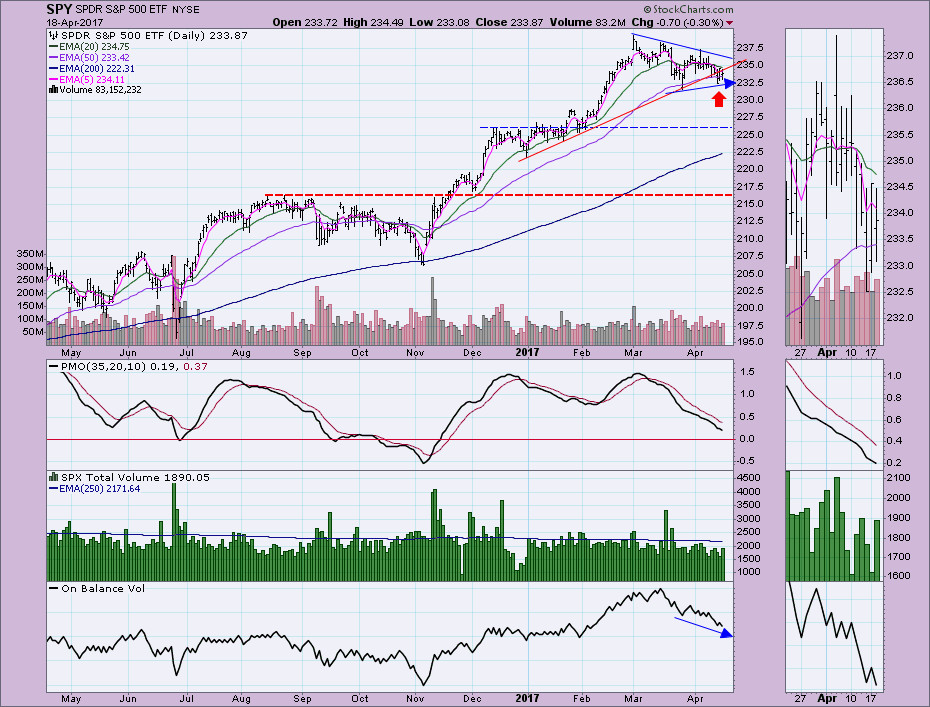
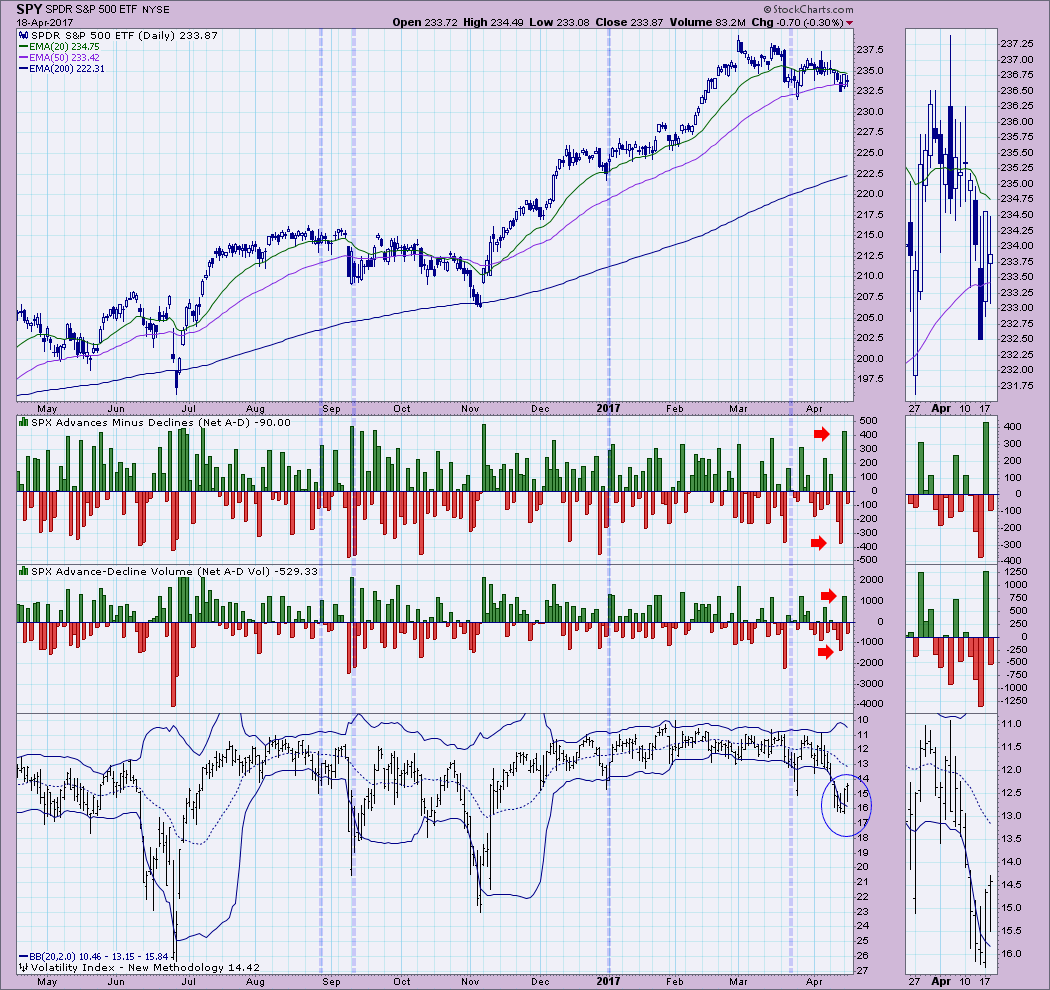
Ultra-Short-Term Indicators: No climactic activity to report today and the VIX is comfortably within the Bollinger Bands for now.
Short-Term Indicators: It had appeared that these indicators had put in a bottom, but with today's weak price movement, they have turned down once again. Note that the recent bottoms are lower than the previous April bottoms. This suggests lower prices, but not likely a correction. These indicators are sitting in oversold territory already.
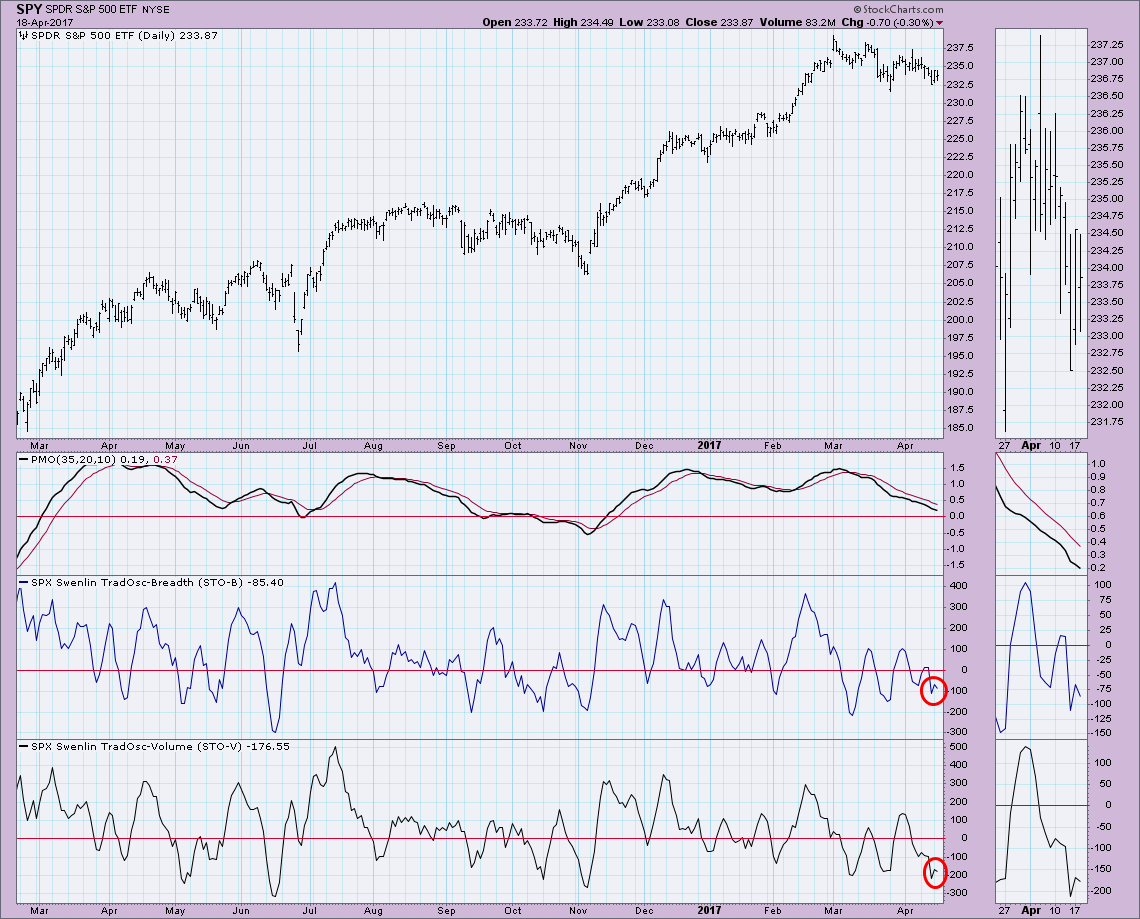
Intermediate-Term Indicators: These indicators are also bearish in the descent, but they are also somewhat oversold so this decline may be short-lived along with price.
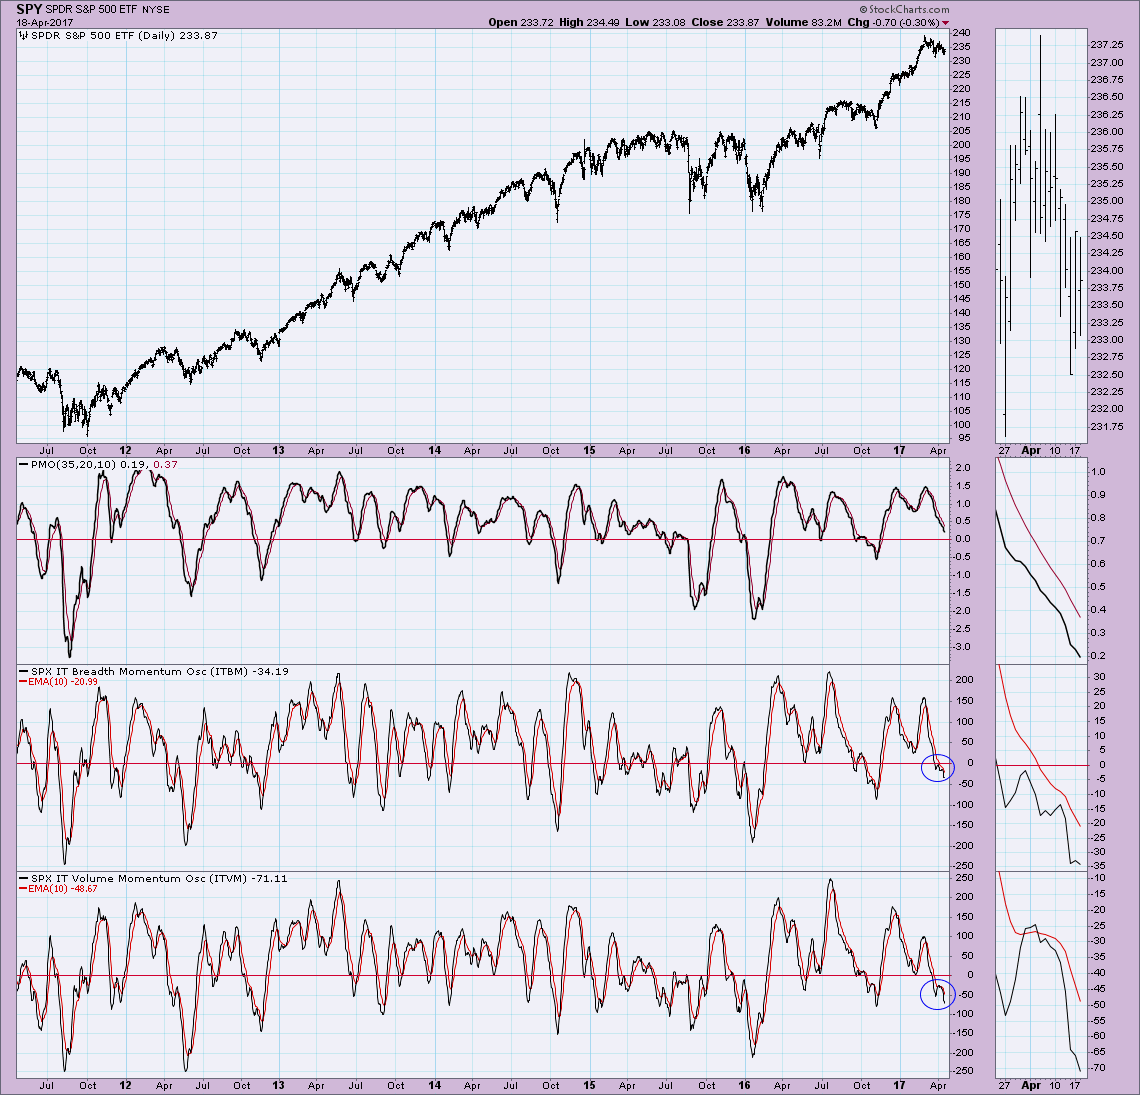
Conclusion: Indicators are bearish and price just closed beneath rising bottoms line support. The negative divergence with the OBV also suggests a decline. With indicators in oversold territory, this decline may not be painful and isn't likely the beginning of a major correction.
**Don't miss the DecisionPoint Alert Daily Commentary! Click on "Email Updates" at the end of this blog page to be notified as soon as it's published at the end of the market day.**
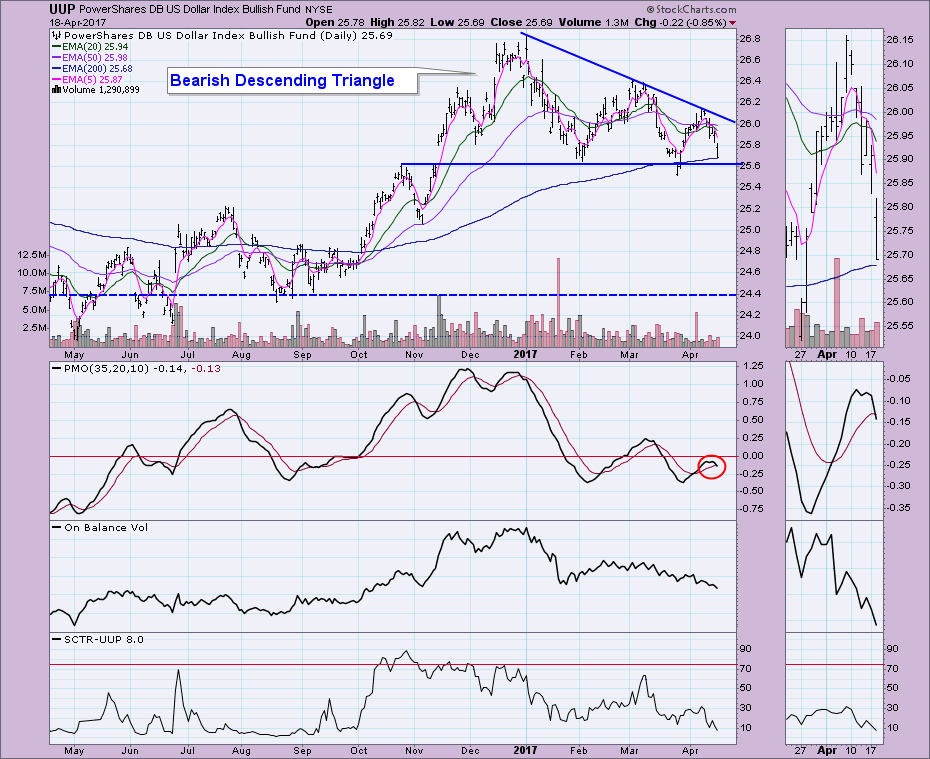
DOLLAR: As of 3/21/2017 the US Dollar Index ETF (UUP) is on an Intermediate-Term Trend Model Neutral signal. The Long-Term Trend Model, which informs our long-term outlook, is on a BUY signal as of 10/17/2016, so our long-term posture is bullish.
Price is about to test the bottom of the bearish descending triangle. The new PMO SELL signal tells me that the pattern will likely fulfill with a breakdown. Using the measure of the height of the pattern ($25.60 to $26.80), the downside target is conveniently the previous horizontal support line at $24.40. There is support available at the July high of $25.20.
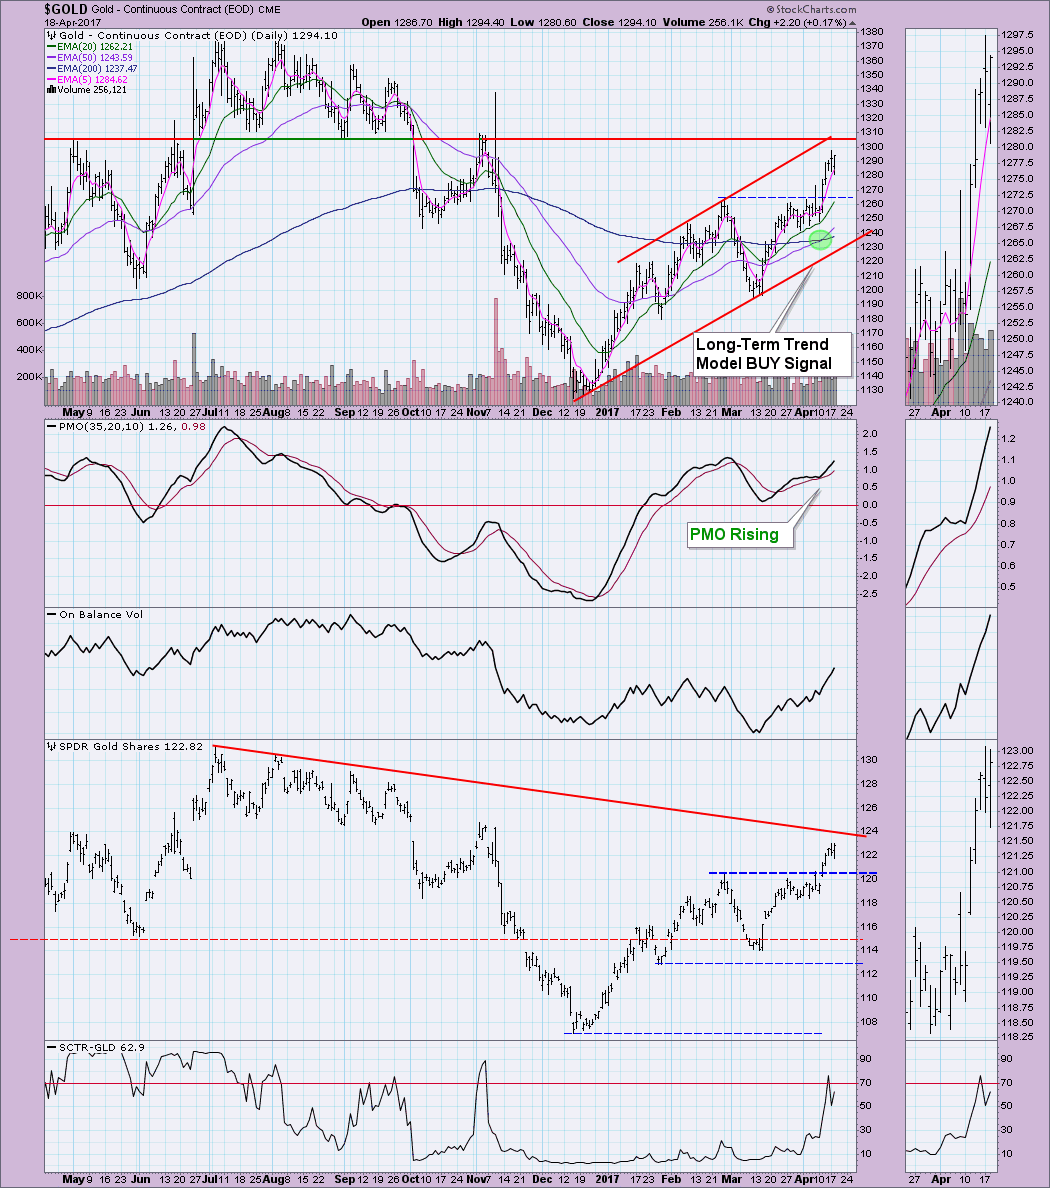
GOLD: As of 2/3/2016 Gold is on an Intermediate-Term Trend Model BUY signal. The Long-Term Trend Model, which informs our long-term outlook, is on a SELL signal as of 4/11/2017, so our long-term posture is bearish.
Gold is now reaching a critical decision point. Indicators are lined up nicely and suggest a move above $1300. This would be a great feat given multiple areas of resistance in this area, denoted by the top of the rising trend channel and horizontal resistance just above $1300.
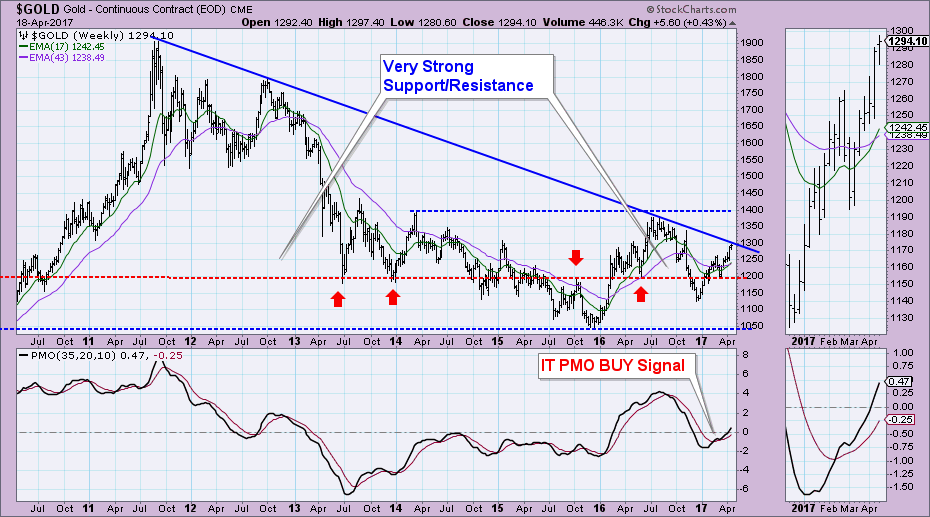
Not only does Gold have to deal with the resistance on the daily chart, the weekly chart shows long-term overhead resistance along a declining tops line that comes right around $1300 also.
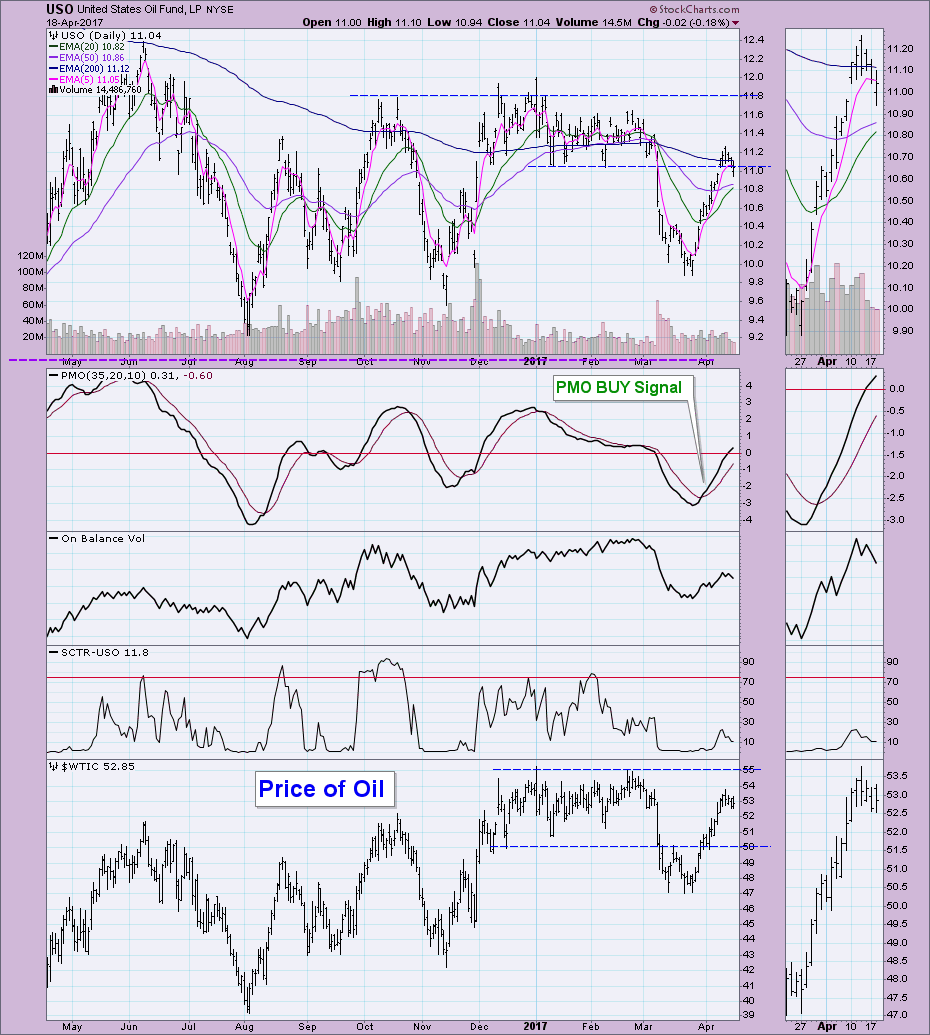
CRUDE OIL (USO): As of 3/8/2017 United States Oil Fund (USO) is on an Intermediate-Term Trend Model Neutral signal. The Long-Term Trend Model, which informs our long-term outlook, is on a SELL signal as of 3/9/2017, so our long-term posture is bearish.
USO had managed to leap frog resistance at $11.00 but today it retreated back below. Looking at the price of Oil, I would expect a pullback toward support at $50. That would put USO around $10.40 or so.
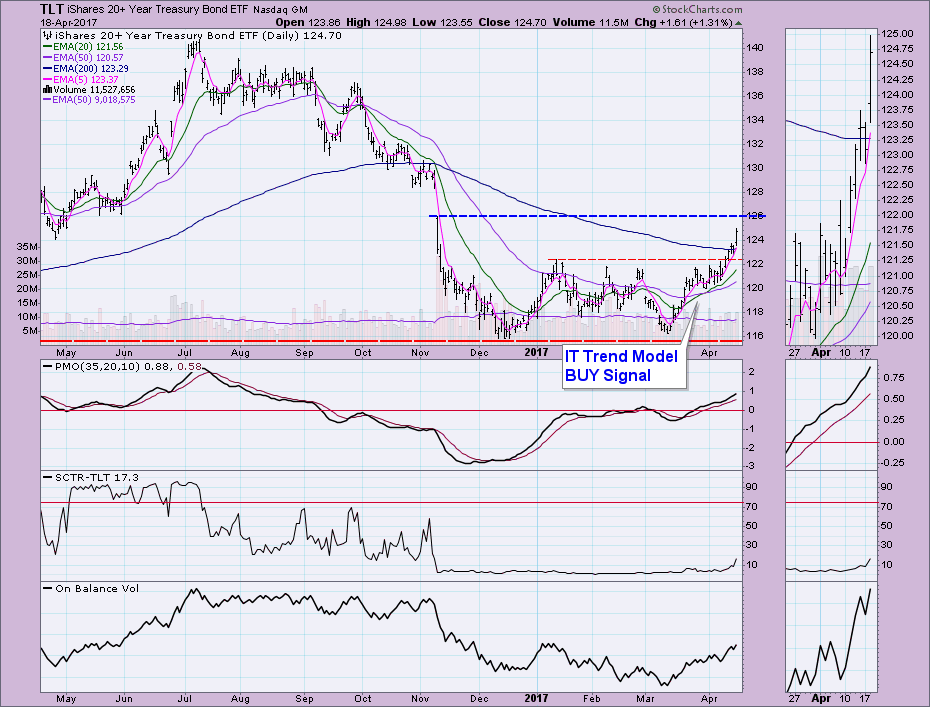
BONDS (TLT): As of 9/15/2016 The 20+ Year T-Bonds ETF (TLT) is on an Intermediate-Term Trend Model Neutral signal. The Long-Term Trend Model, which informs our long-term outlook, is on a SELL signal as of 11/17/2016, so our long-term posture is bearish.
Bonds like Gold is experiencing a nice rally. Overhead resistance is looming at the bottom of the gap in November. The PMO could rise higher before getting overbought and the SCTR is waking up. The OBV is in line with price movement. This would be a good opportunity for a breakout given rising momentum and bullish confirmation on OBV and SCTR.
The DecisionPoint LIVE Shared ChartList has launched! Click on the link and you'll find webinar and blog chart spotlights. Be sure and bookmark it!
Technical Analysis is a windsock, not a crystal ball.
Happy Charting!
- Erin


