Tom Bowley and I host the MarketWatchers LIVE webcast M/W/F 12:00p - 1:30p EST. During Monday's second market update, I like to review the DecisionPoint indicators to look at indicator expectations for the week. The chart that really stood out to me was the ultra-short-term indicator chart.
First, this timeframe, "ultra-short term", is measured in hours to a day or two. While climactic readings on this chart can develop into something bigger over a longer timeframe, we should consider the actual timeframe for signals on this chart to be curtailed.
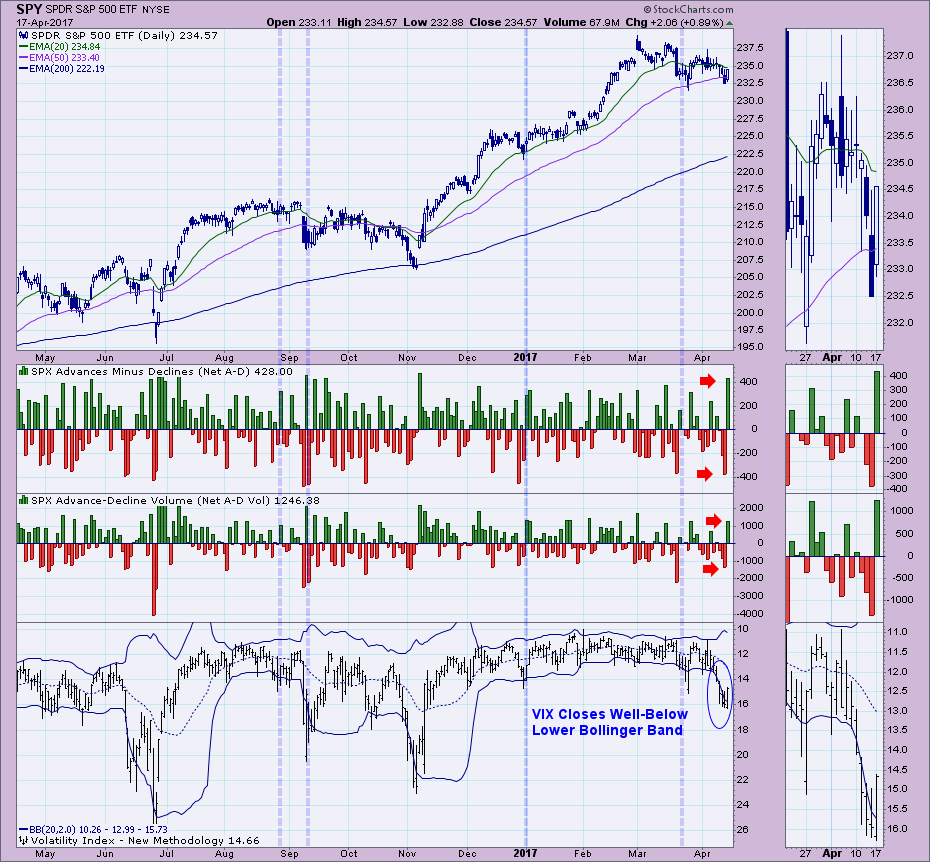
During the show, we didn't have the luxury of seeing today's readings but I did expect to see some climactic readings based on market action. I pointed out the very high negative breadth readings from Thursday as a selling exhaustion, especially when combined with the VIX closing beneath the lower Bollinger Band. I stand by that selling exhaustion and I think today's rally fit the bill. But will there be follow-through?
What is questionable right now are today's positive climactic readings along with the VIX penetration (though not a close today) beneath the lower band. Given today's rally pop, I'd say that exhaustion was fulfilled. Now to determine what these positive climactic readings are telling us. Are they a buying exhaustion or buying initiation?
On face value, given the decline we've endured this month, the penetration of the lower band by the VIX and climactic readings to the upside in breadth, I would look for today's rally to have some follow-through.
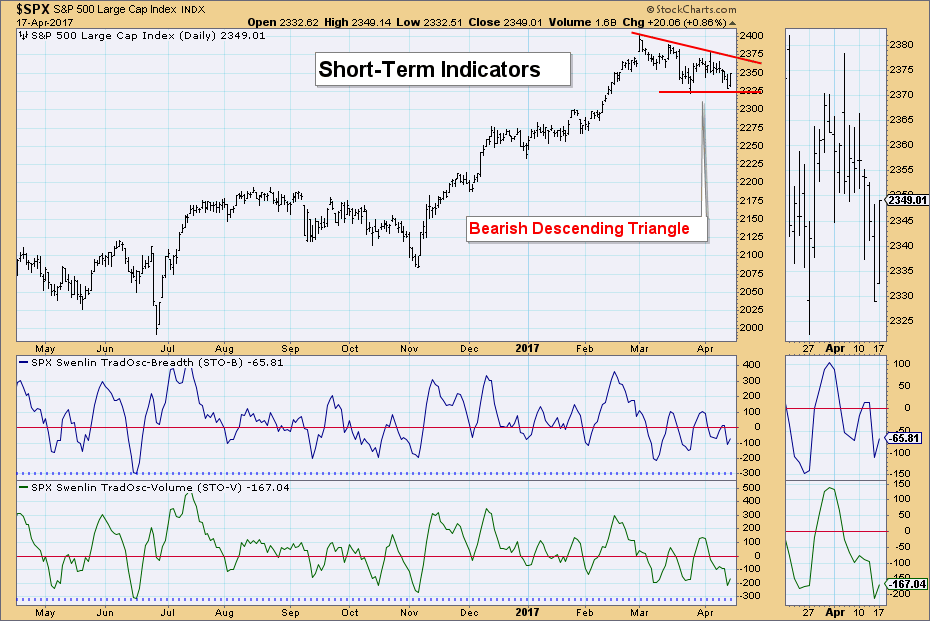
 Price action and short-term indicators are mixed. The Swenlin Trading Oscillators have turned up which is bullish, but the bearish descending triangle is a problem. I wouldn't be surprised to see price test the declining tops trendline quickly as ultra-short-term indicators suggest and then see a breakdown below horizontal support to fulfill the chart pattern.
The DecisionPoint LIVE Shared ChartList is available now! Click on the link and you'll find all your favorite DP charts all annotated! Be sure and bookmark it!
Technical Analysis is a windsock, not a crystal ball.
Happy Charting!
- Erin


