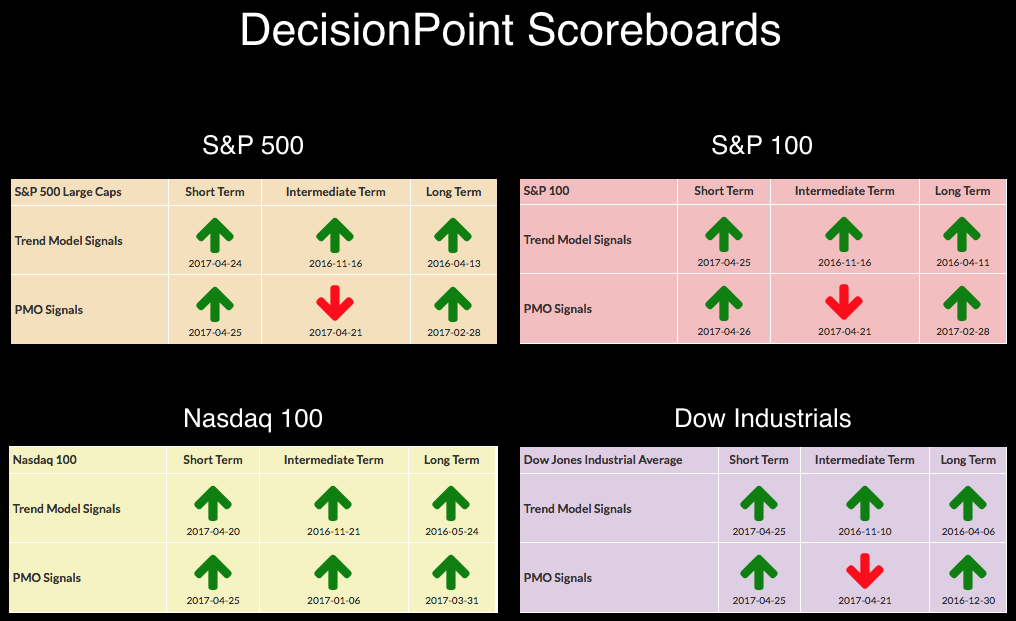
 The short term remains bullish in terms of the DecisionPoint Scoreboards. The long term also is showing all bullish BUY signals. Momentum looks to be a problem in the intermediate term. The SELL signals on all but the NDX come from the Price Momentum Oscillator (PMO) on the weekly chart. You can go look at them with annotations in the DP LIVE shared ChartList right here.
The purpose of the DecisionPoint Alert Daily Update is to quickly review the day's action, internal condition, and Trend Model status of the broad market (S&P 500), the nine SPDR Sectors, the U.S. Dollar, Gold, Crude Oil, and Bonds. To ensure that using this daily reference will be quick and painless, we are as brief as possible, and sometimes we let a chart speak for itself.
SIGNALS: Here we include charts of any important signal changes triggered today by our Intermediate-Term Trend Model.
NO NEW SIGNALS TO REPORT.
NOTE: Mechanical trading model signals define the implied bias of the price index based upon moving average relationships, but they do not necessarily call for a specific action. They are information flags that should prompt chart review. Further, they do not call for continuous buying or selling during the life of the signal. For example, a BUY signal will probably return the best results if action is taken soon after the signal is generated. Additional opportunities for buying may be found as price zigzags higher, but the trader must look for optimum entry points. Conversely, exit points to preserve gains (or minimize losses) may be evident before the model mechanically closes the signal.
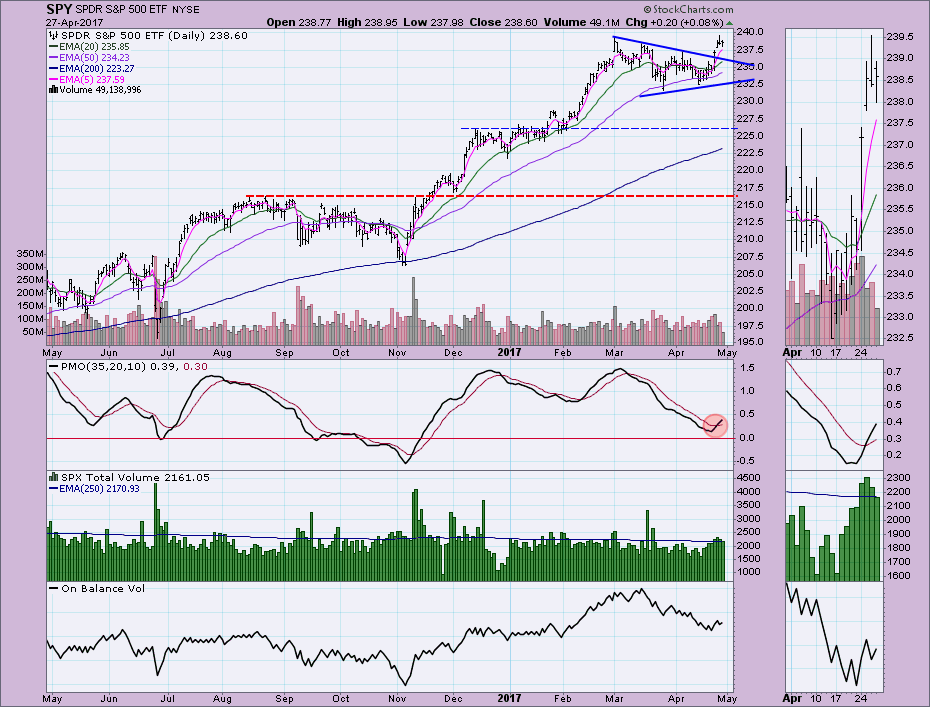
STOCKS: Based upon a 11/15/2016 Intermediate-Term Trend Model BUY signal, our current intermediate-term market posture for the S&P 500 (SPY) is bullish. The Long-Term Trend Model, which informs our long-term outlook, is on a BUY signal as of 4/1/2016 so our long-term posture is bullish.
The market traveled mostly sideways to finish nearly unchanged. A new top was put in yesterday.
I like the possible breakaway gap we saw on Tuesday that pushed price above declining tops line resistance and executed the symmetrical triangle continuation pattern. I was originally concerned about a possible island reversal, it wouldn't take much to close the recent gap and it would provide price an opportunity to bounce off support. I'm not worried about a correction. The new PMO BUY signal is intact.
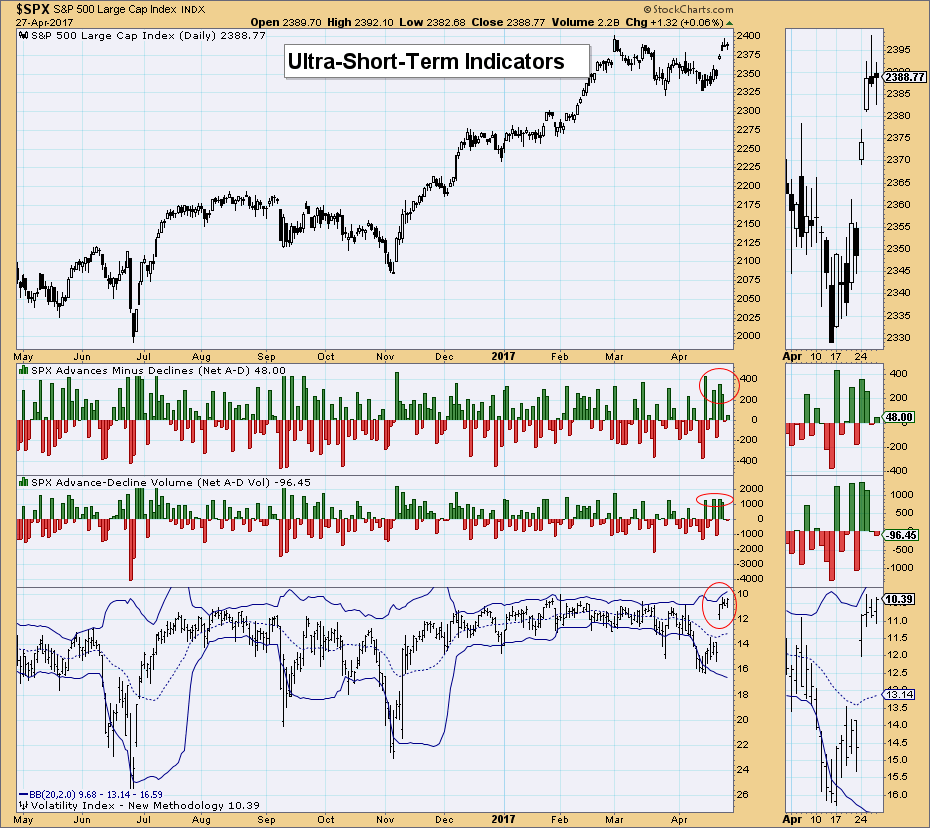
 Ultra-Short-Term Indicators: Today the readings were nearly non-existent on breadth. The VIX continues to flirt with the upper Bollinger Band, but hasn't penetrated it. With price backing off today, I would say the buying exhaustion noted by climactic breadth readings, may have concluded with today's small decline. However, I am keeping alert to the movement of the VIX and possible breakouts/breakdowns on Bollinger Bands.
Short-Term Indicators: A lot of annotations here. First, note that both indicators have turned down. I'm not overly concerned about this yet. The STO-B bottoms showed a nice positive divergence, signaling the upcoming rally. The STO-V had a positive divergence at that same time and now is showing a bullish confirmation of the rally.
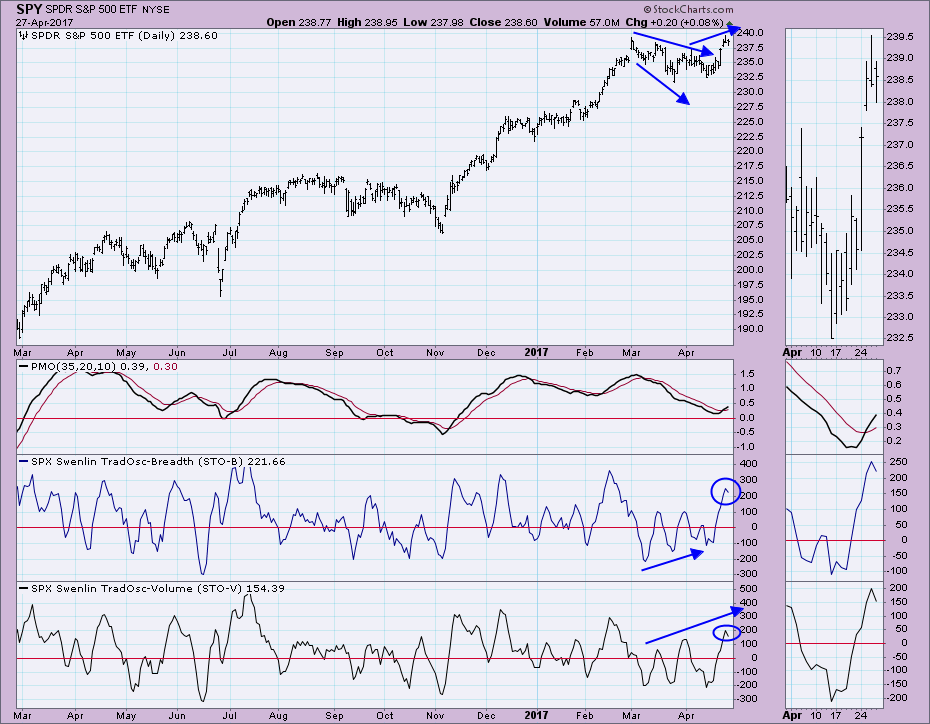
Intermediate-Term Indicators: They are both rising bullishly in neutral territory.
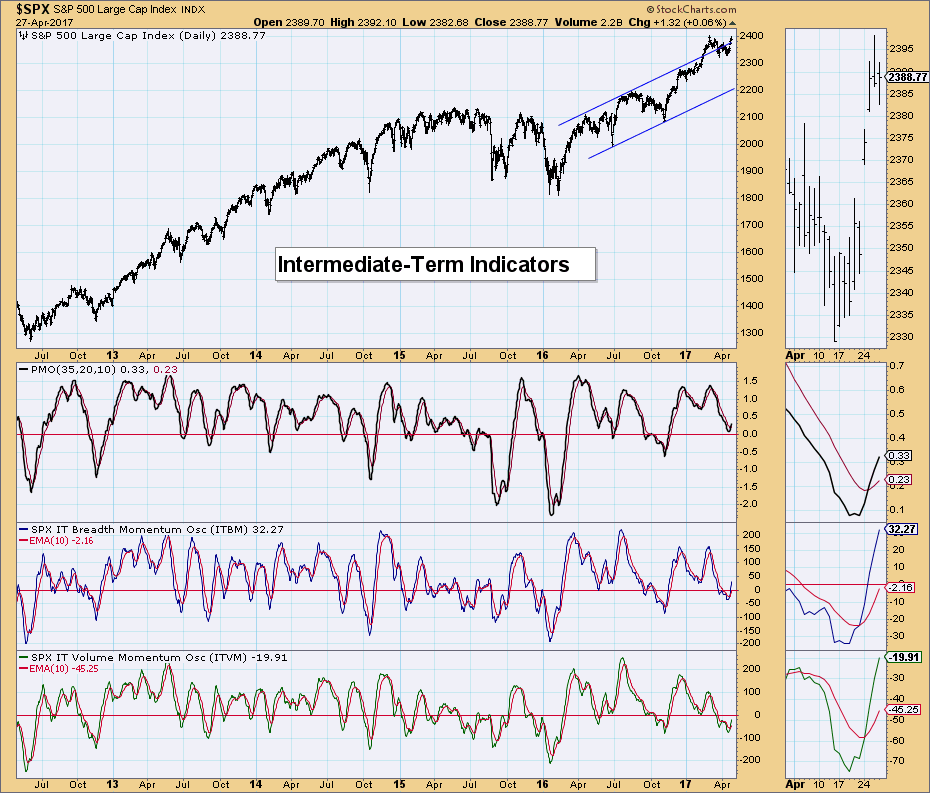
Conclusion: Although ST indicators have turned down, IT indicators are looking quite bullish. I suspect after this pause, we will see a small pullback to test support around 235 before another rally higher in the next week.
**Don't miss the DecisionPoint Alert Daily Commentary! Click on "Email Updates" at the end of this blog page to be notified as soon as it's published at the end of the market day.**
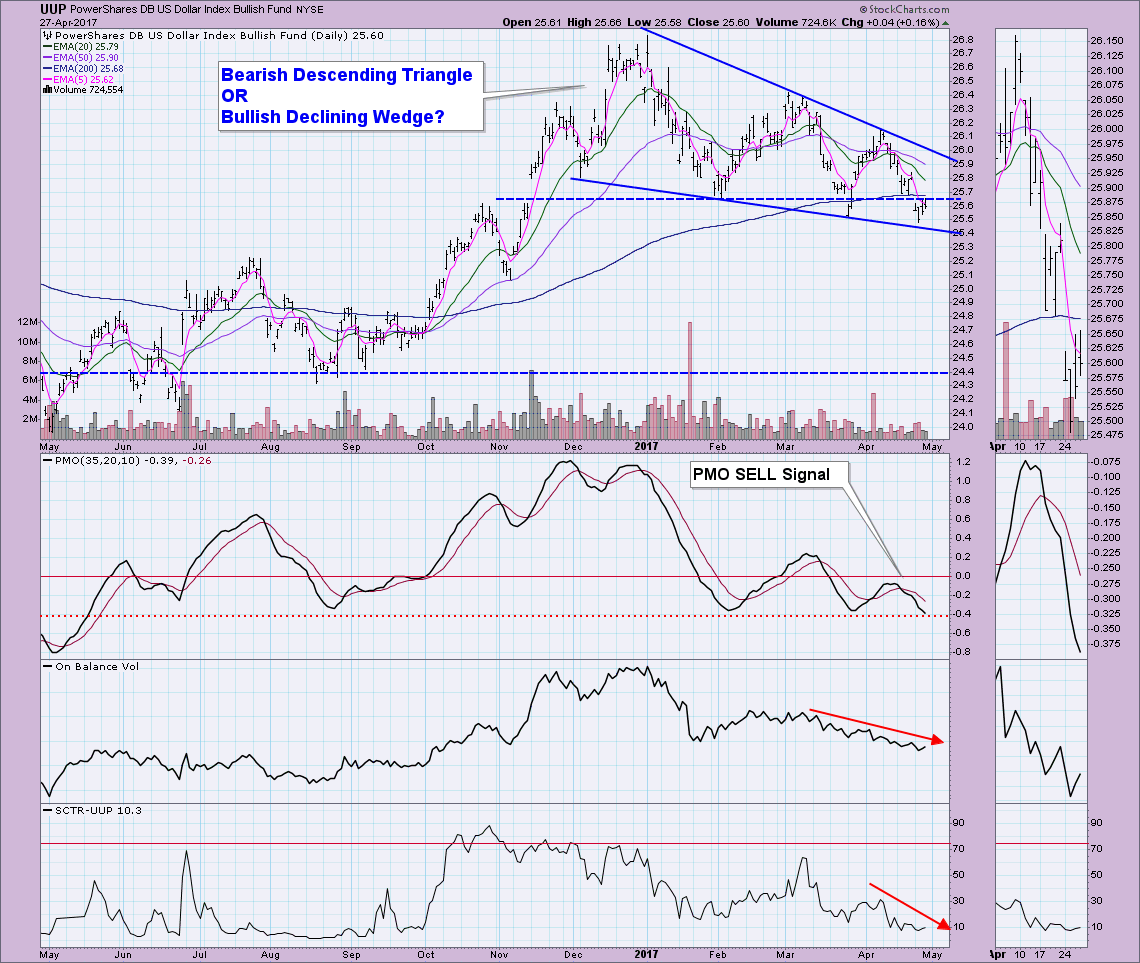
DOLLAR: As of 3/21/2017 the US Dollar Index ETF (UUP) is on an Intermediate-Term Trend Model Neutral signal. The Long-Term Trend Model, which informs our long-term outlook, is on a BUY signal as of 10/17/2016, so our long-term posture is bullish.
At this point, UUP indicators are still bearish which has mean leaning toward a bearish descending triangle formation. If we see price pop back above resistance at the November gap start, I will switch my view to a declining wedge, bullish.
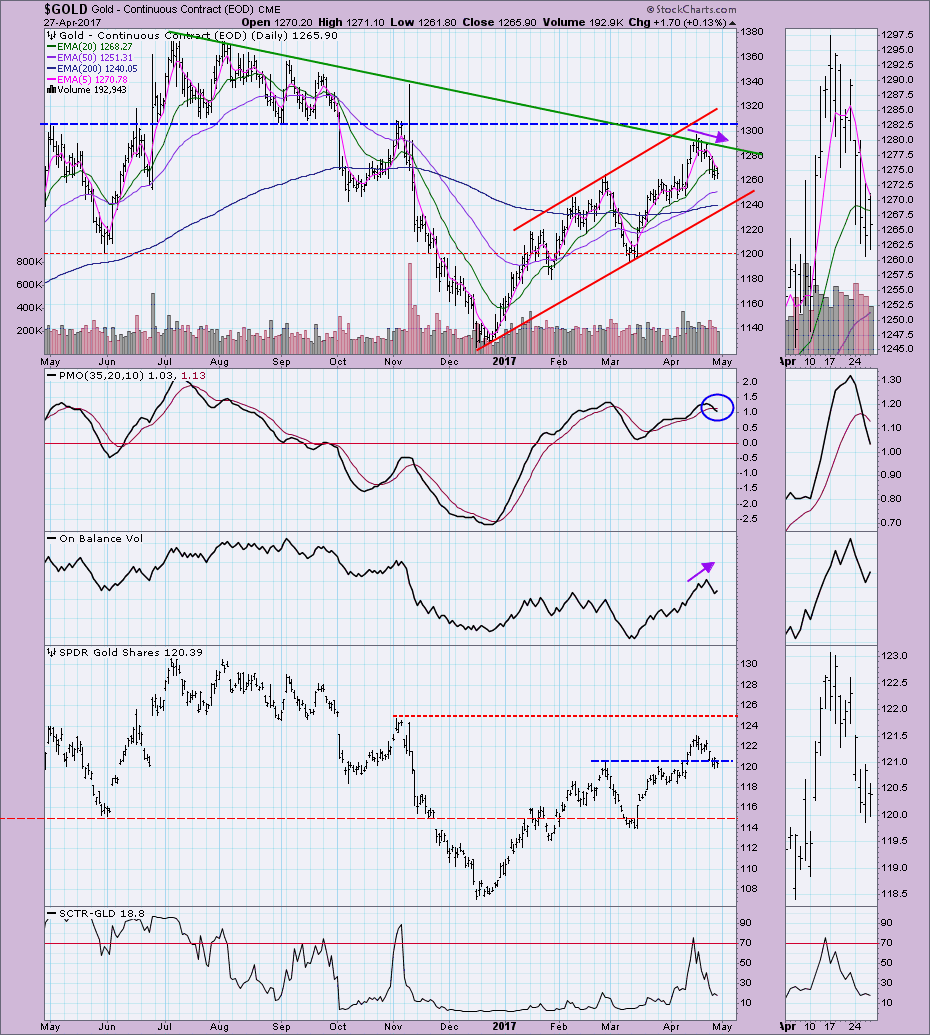
GOLD: As of 2/3/2016 Gold is on an Intermediate-Term Trend Model BUY signal. The Long-Term Trend Model, which informs our long-term outlook, is on a BUY signal as of 4/11/2017, so our long-term posture is bullish.
Gold is moving lower to likely test the bottom of this rising trend channel. It is no surprise on this pullback to see a PMO SELL signal. However, if the 1240 support area is breached, Gold is probably in for a long decline. If the Dollar turns around and rallies, this would fuel Gold's decline.
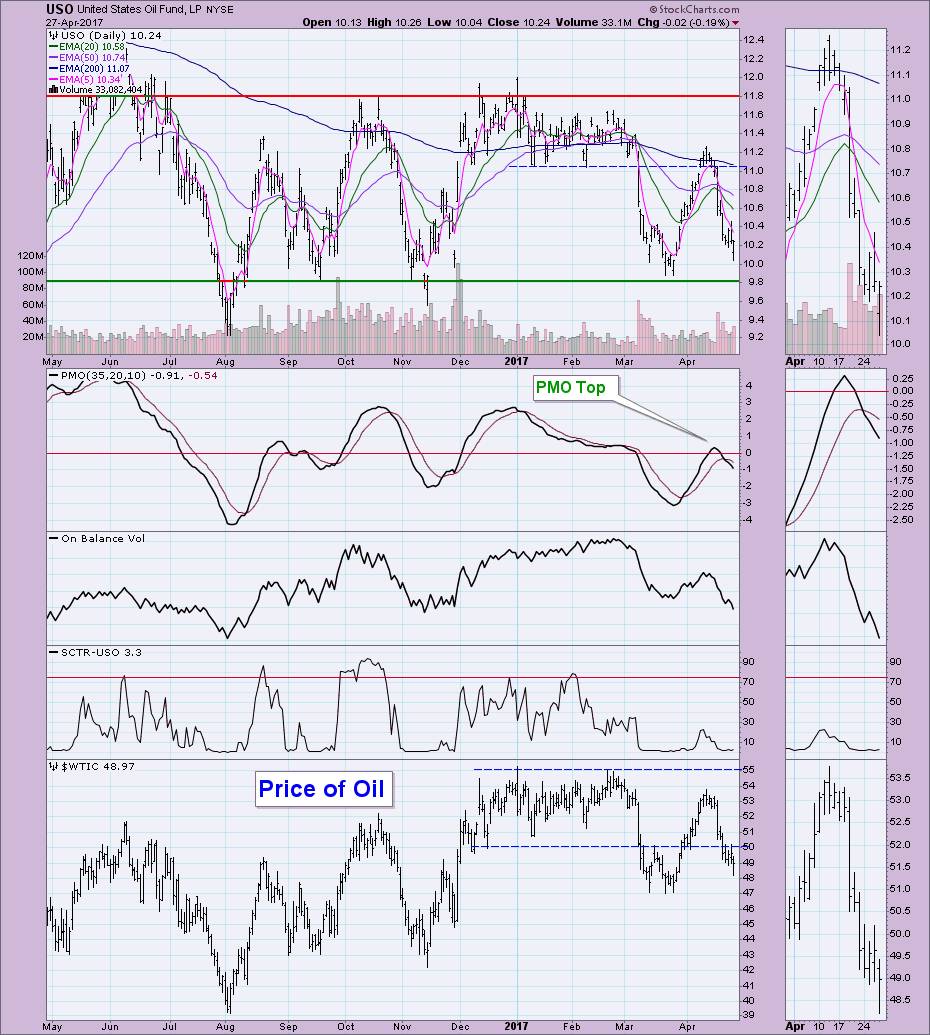
CRUDE OIL (USO): As of 3/8/2017 United States Oil Fund (USO) is on an Intermediate-Term Trend Model Neutral signal. The Long-Term Trend Model, which informs our long-term outlook, is on a SELL signal as of 3/9/2017, so our long-term posture is bearish.
Still making new intraday lows. I expect to see USO pull back further. There also seems a high likelihood that that the $9.80 support won't hold. The PMO is very bearish, along with the OBV and SCTR. Oil should test the $47/barrel support level.
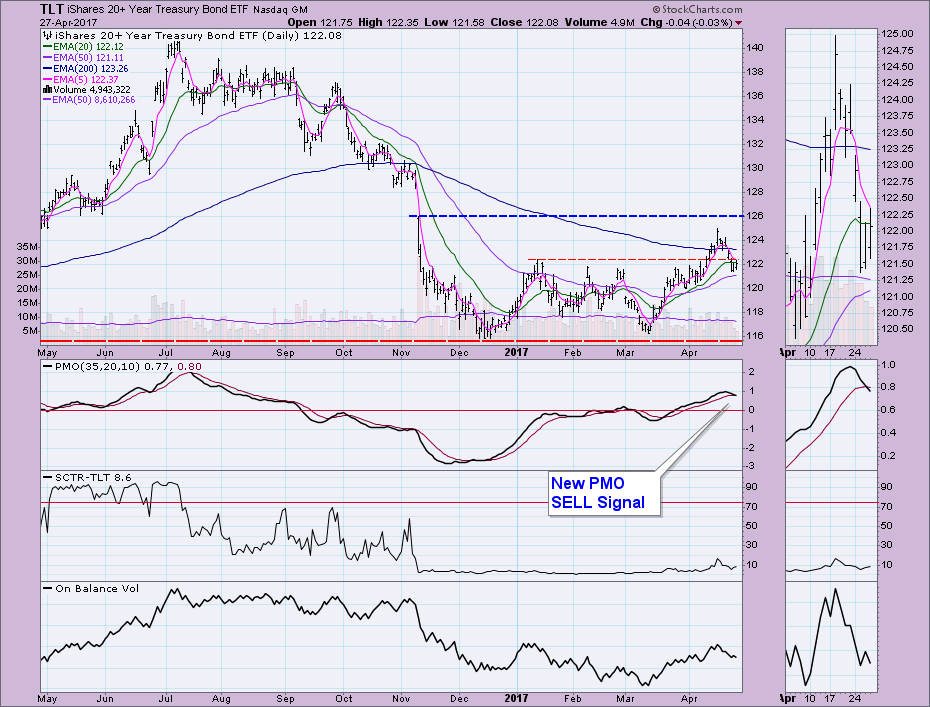
BONDS (TLT): As of 3/31/2017 The 20+ Year T-Bonds ETF (TLT) is on an Intermediate-Term Trend Model BUY signal. The Long-Term Trend Model, which informs our long-term outlook, is on a SELL signal as of 11/17/2016, so our long-term posture is bearish.
The rally failed at overhead resistance. After dropping back below support at $122, it triggered a PMO SELL signal. The 50-EMA is currently holding as short-term support. A drop below that would signal a deeper decline on the way.
The DecisionPoint LIVE Shared ChartList has launched! Click on the link and you'll find webinar and blog chart spotlights. Be sure and bookmark it!
Technical Analysis is a windsock, not a crystal ball.
Happy Charting!
- Erin


