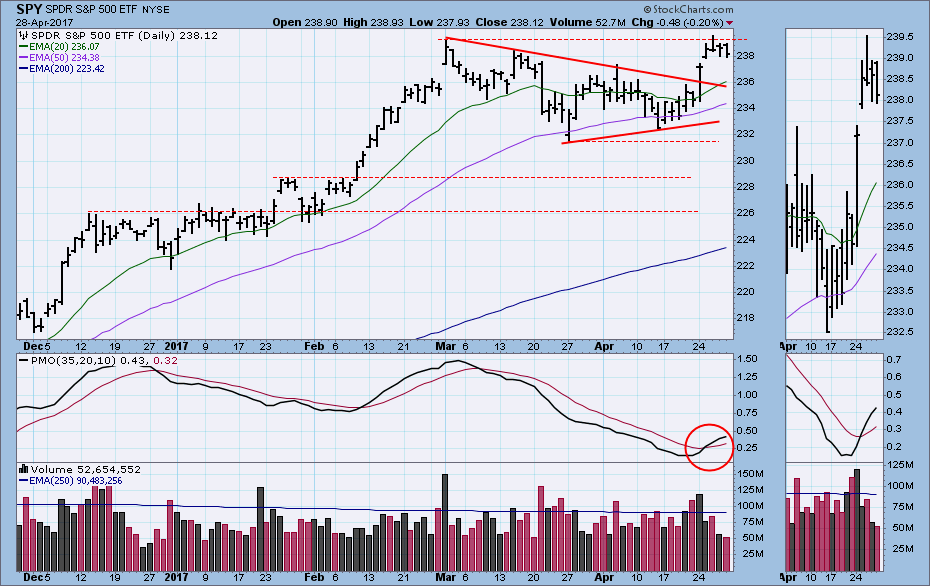
Last week I wrote: "My posture is to look for an up move next week, and as last week, a daily PMO bottom will be the first, if not infallible, clue that the market is done correcting. If an upside breakout follows, I will believe it." As it turned out, we got the breakout and PMO (Price Momentum Oscillator) bottom on Monday. There was nice follow through on Tuesday, but overhead resistance drawn from the March all-time high put a stop to forward progress. Let's dig into the technicals and see what next week may have in store.
The DecisionPoint Weekly Wrap presents an end-of-week assessment of the trend and condition of the stock market (S&P 500), the U.S. Dollar, Gold, Crude Oil, and Bonds.
STOCKS
IT Trend Model: BUY as of 11/15/2016
LT Trend Model: BUY as of 4/1/2016
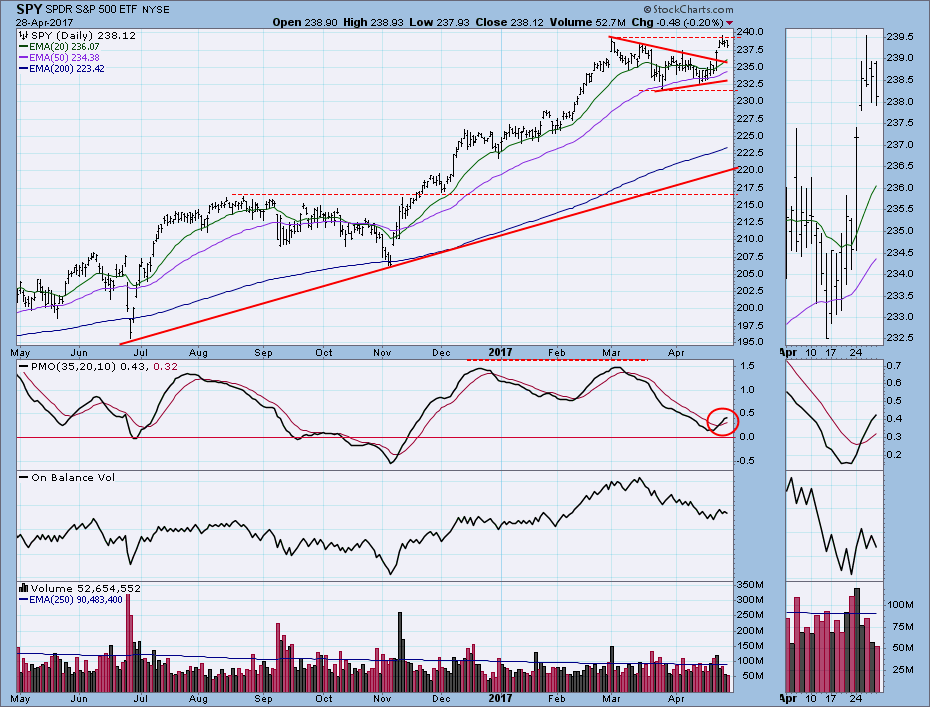
Not only did the daily PMO turn up, it also crossed up through its signal line, generating a short-term BUY signal. The price action this week has formed a flag formation, as the price consolidation for the last four days of the week attached itself to Monday's flag pole. I consider this to be bullish.
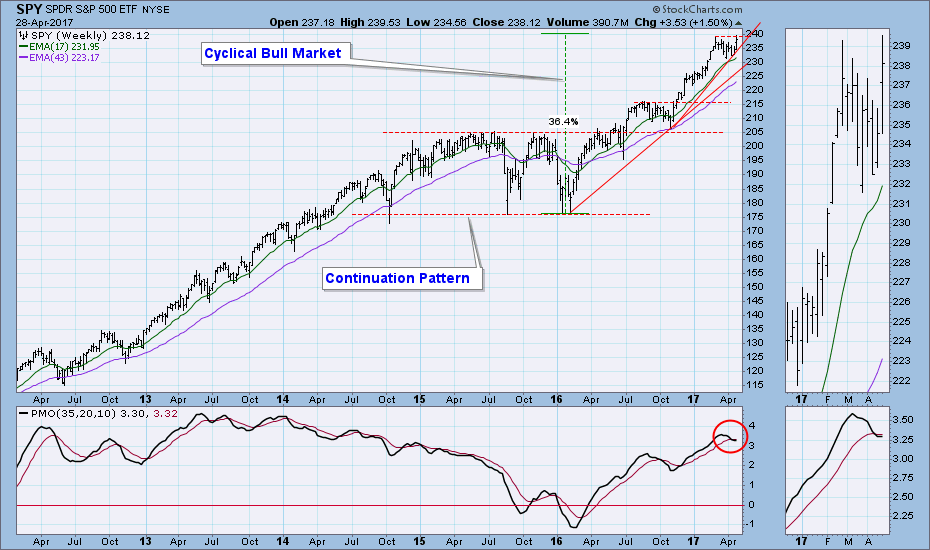
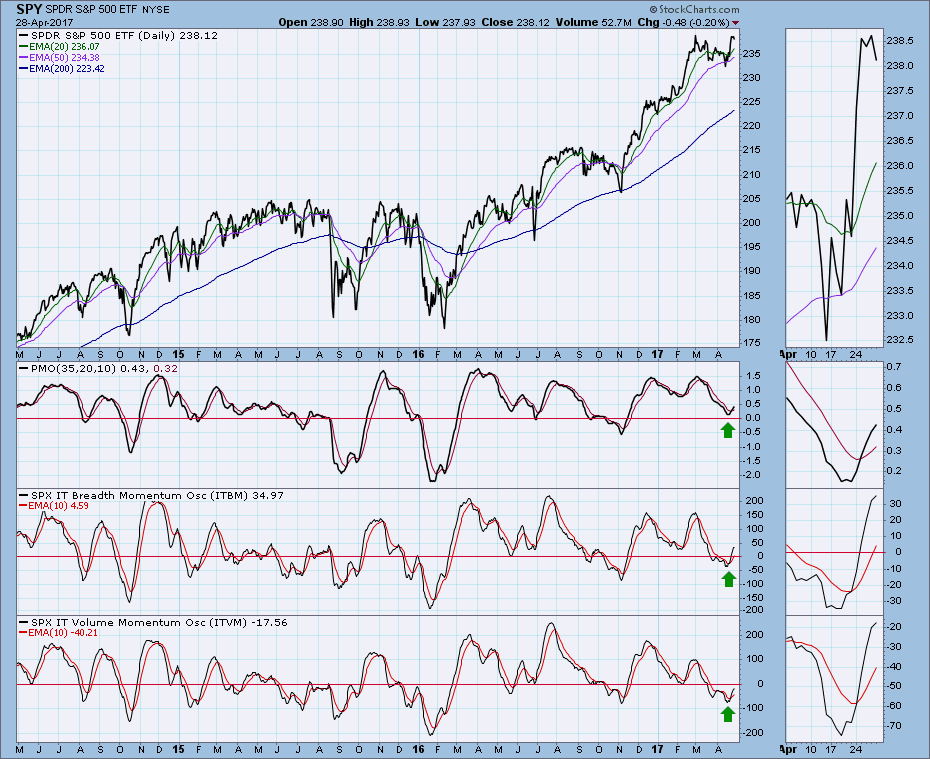
Last week the weekly PMO was falling below its signal line, but I said that didn't concern me because there was plenty of room for price to correct without doing serious technical damage. Now this week's reading is the same as last week's, except the PMO is now rising.
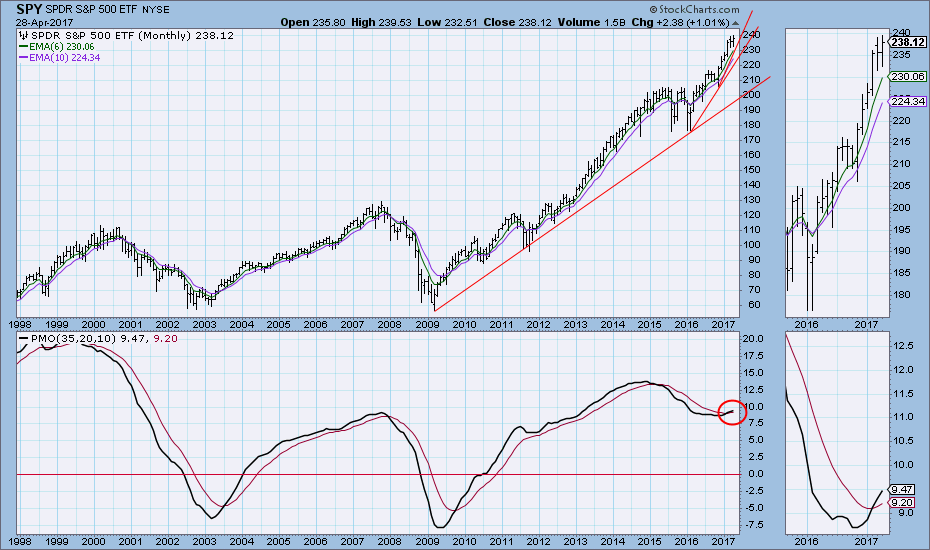
The monthly PMO is in a bullish configuration, but the angle of ascent for price has become quite steep, as evidenced by the top rising trend line. It could be sustained for several months, but it begs for eventual correction. Keep in mind that our brains tend to think a lot faster than the monthly chart moves.
Short-Term Market Indicators: These indicators have topped, a bit too soon to suit me, but note how overbought indicator tops tend to lead price tops by a few weeks.
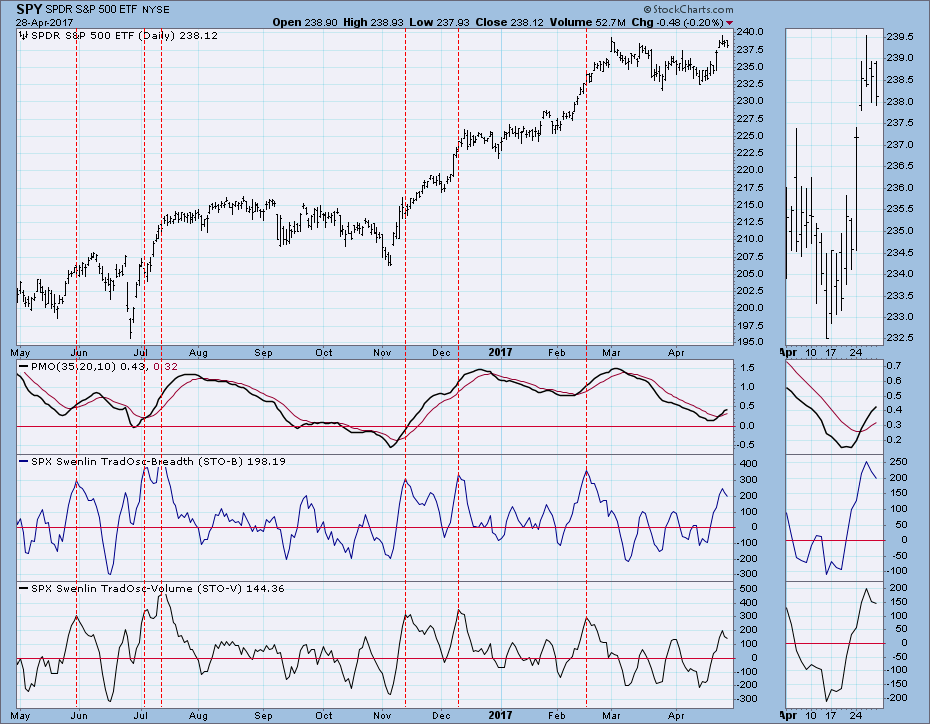
Intermediate-Term Market Indicators: We have solid bottoms on all of these indicators, and there is plenty of room for them to move higher.
Seasonality: We should be aware that from May through October seasonal factors tend to exert negative pressure on the market, but "Sell in May, and go away" is not a hard and fast rule. The best example of how the rule doesn't always work is the May through October period in 2016 (see the daily chart above) -- the market actually closed higher, not lower. Now six-month seasonality is bearish and could work against the market rally, but just make note of it as a background issue, because we have no way of knowing how much it will influence price movement.
Conclusion: This week a flag formation popped out of a nearly two-month-long consolidation, and price is now consolidating just below resistance at all-time highs. Consolidation may continue for a bit, and it is possible that price will move lower toward the point of breakout and fill Tuesday's gap; however, the charts in all three time frames are bullish, and I favor a breakout to new all-time highs next week.
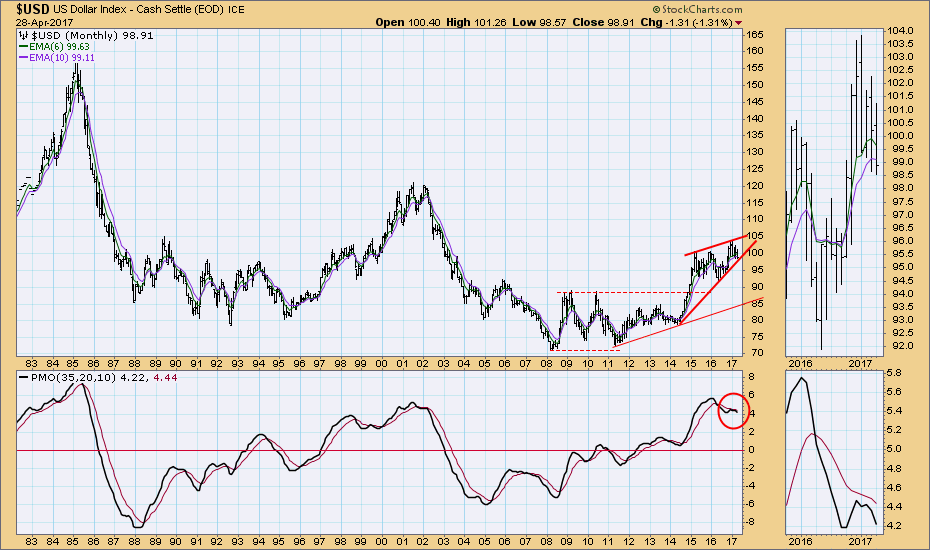
DOLLAR
IT Trend Model: NEUTRAL as of 3/21/2016
LT Trend Model: BUY as of 10/17/2016
The falling wedge formation dominates the daily chart, and the technical expectation is for it to resolve to the upside.
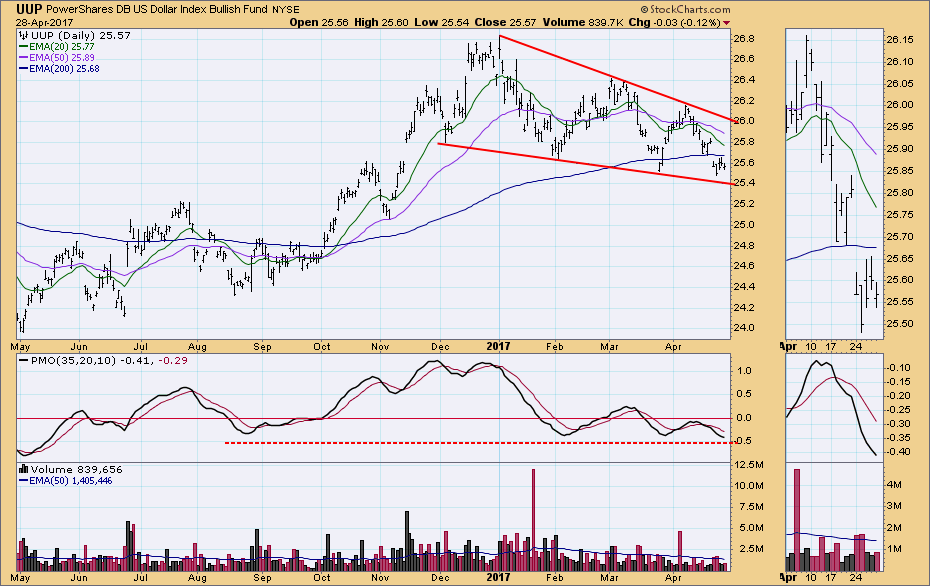
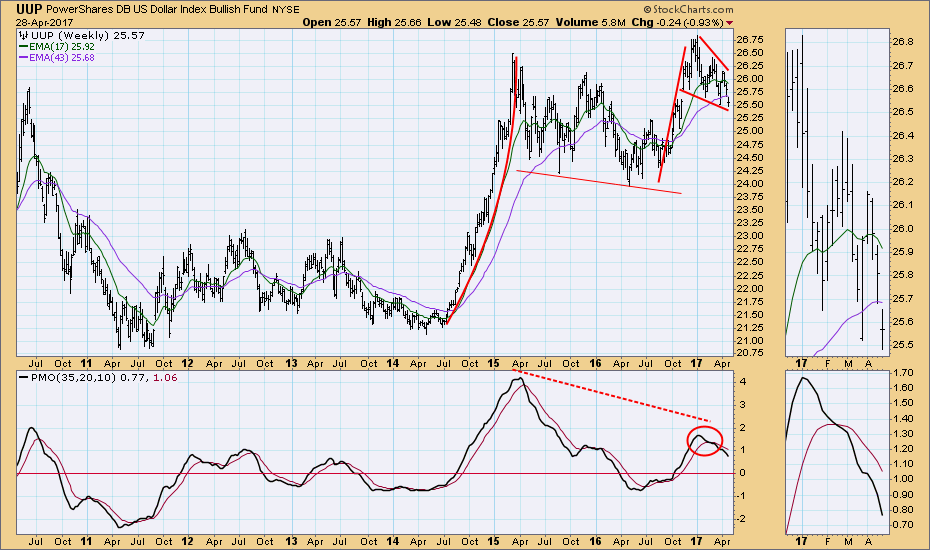
The weekly PMO is currently negative, falling below its signal line, as well as forming a negative divergence; however, price is still in a bullish flag formation. Kind of a neutral situation.
I am using the monthly chart of $USD because it gives us a longer look than the shorter data available for UUP. The monthly PMO has turned down below its signal line (really bearish), and the dominant feature on the price chart is a rising wedge. Both these items favor price breaking down through its rising trend line.
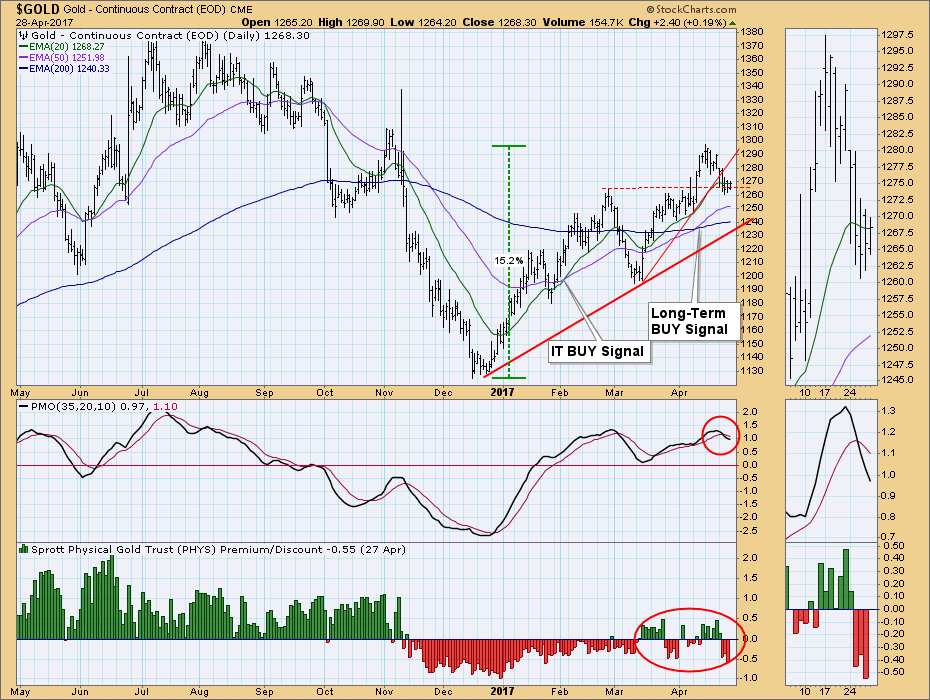
GOLD:
IT Trend Model: BUY as of 2/3/2016
LT Trend Model: BUY as of 4/12/2017
The picture for gold turned short-term negative on the daily chart when price broke down through a rising trend line, and the daily PMO topped and crossed down through its signal line. This may be no more serious than the correction from the February top to the March bottom -- just a normal correction in an up trend. Sentiment shown on the bottom panel is basically neutral.
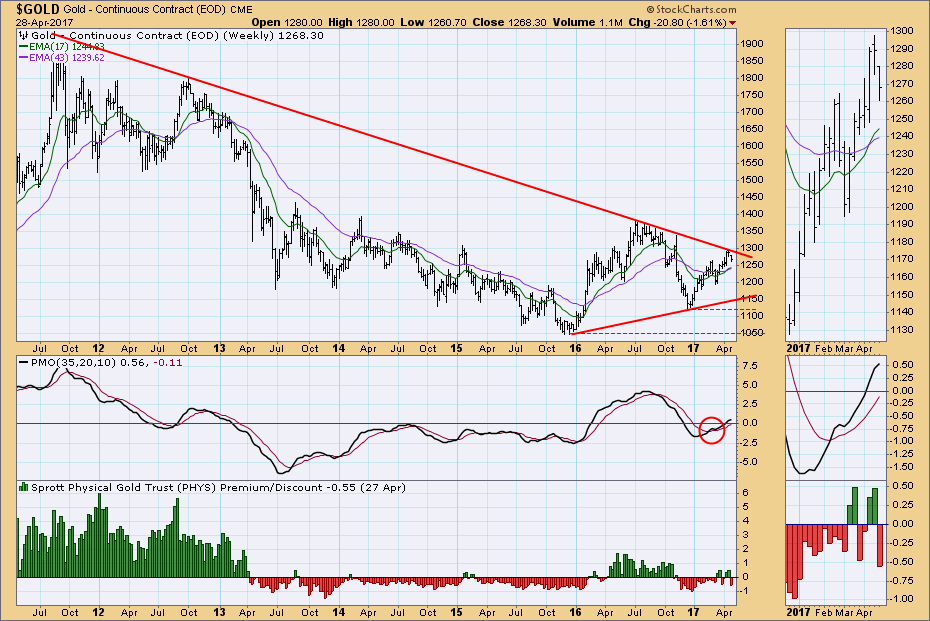
On the weekly chart price has been turned back from the long-term declining tops line, possibly to build compression for an eventual breakout. The weekly PMO is positive, rising above its signal line.
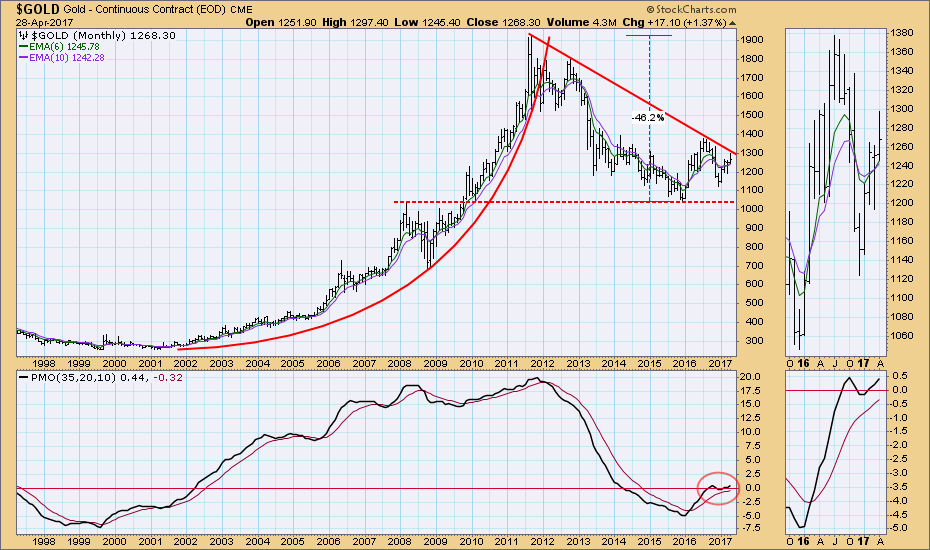
On the monthly chart we have a better perspective of how gold is challenging a long-term declining tops line drawn from the 2011 all-time high. The monthly PMO is rising, which favors a price breakout.
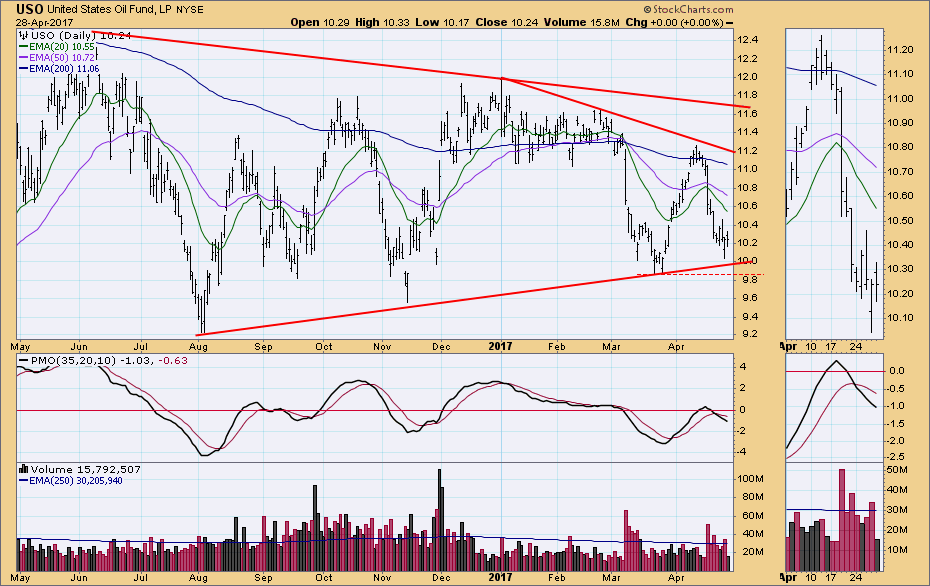
CRUDE OIL (USO)
IT Trend Model: NEUTRAL as of 3/8/2017
LT Trend Model: SELL as of 3/9/2017
The PMO crossed down through its signal line this week, generating a SELL signal, but price seems to be starting a bounce off the rising bottoms line.
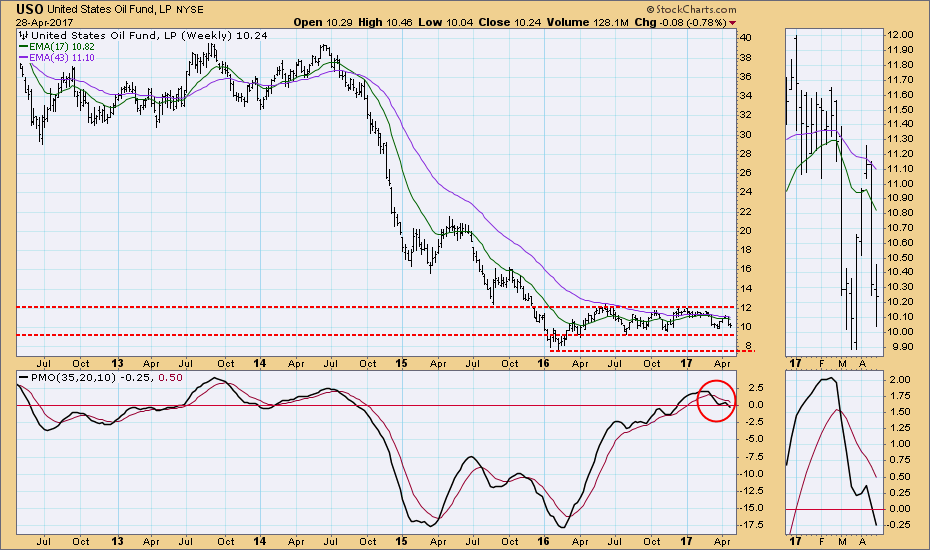
The weekly PMO is negative, and price is in a basing pattern that may last for years due to an abundance of oil.
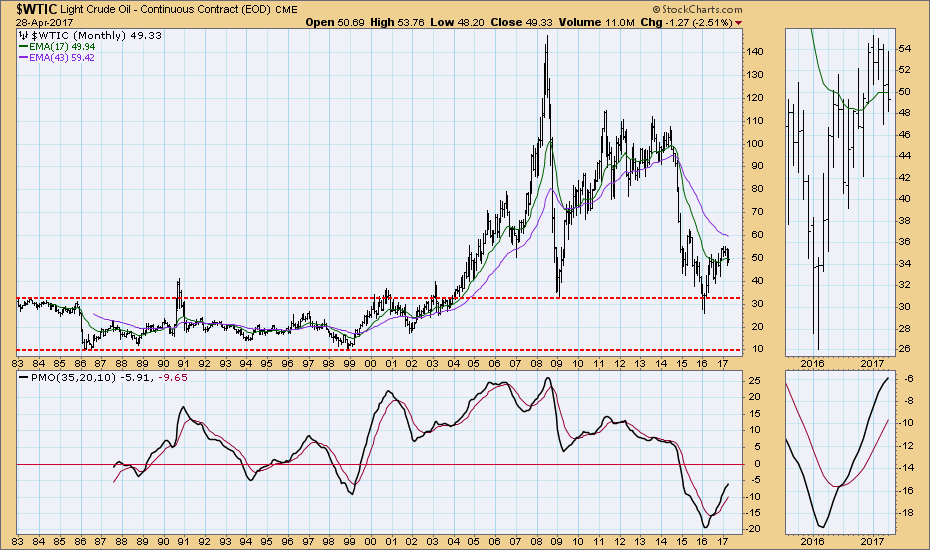
I'm using $WTIC for the monthly chart to enhance our long-term perspective. Major support is at about 33.00; although, 2016 saw a brief drop below that level, . The monthly PMO is currently rising, though decelerating, but the weekly chart above hints that the recent crude oil rally is about done.
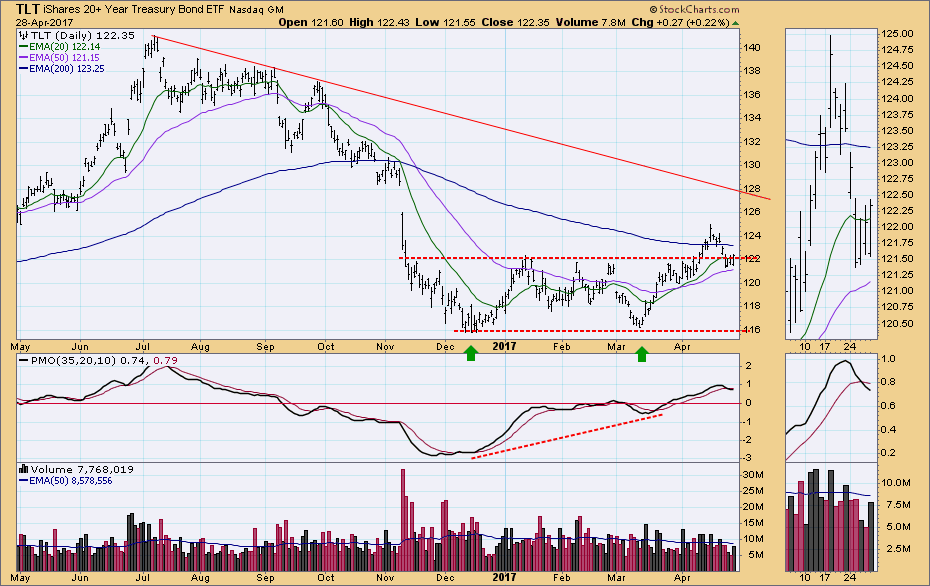
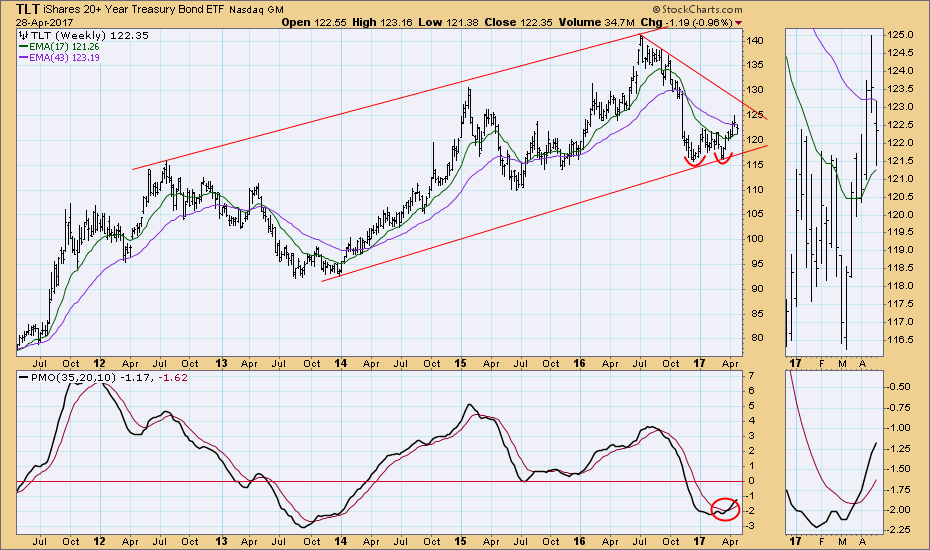
BONDS (TLT)
IT Trend Model: BUY as of 3/31/2017
LT Trend Model: SELL as of 11/17/2016
The breakout above the double bottom confirmation line at 122.00 reversed this week, and a PMO SELL signal was generated.
The weekly PMO remains positive, which puts it out of step with the daily and monthly PMOs.
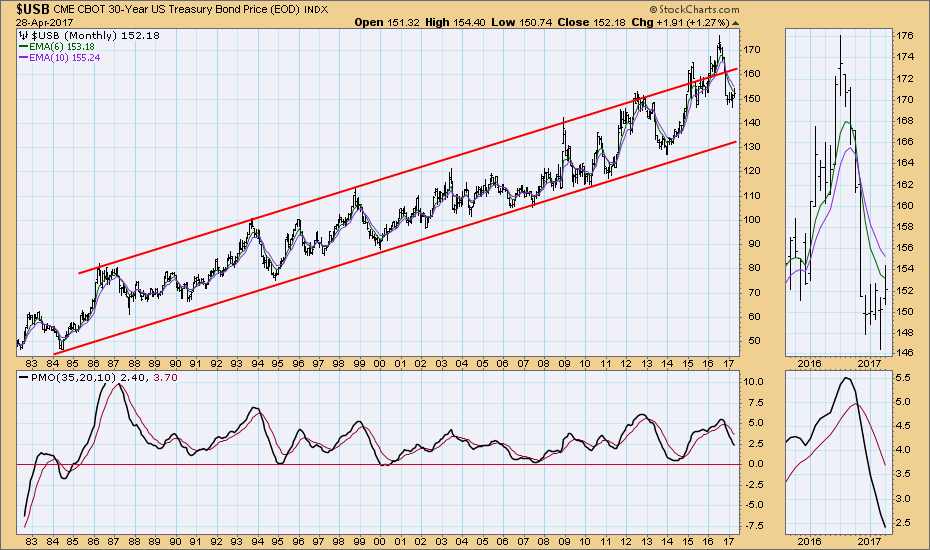
$USB bounced this month, but it closed well off of its highs for the month. The monthly PMO is falling, implying that price has farther down to go.
NOTE: The signal status reported herein is based upon mechanical trading model signals, specifically, the DecisionPoint Trend Model. They define the implied bias of the price index based upon moving average relationships, but they do not necessarily call for a specific action. They are information flags that should prompt chart review. Further, they do not call for continuous buying or selling during the life of the signal. For example, a BUY signal will probably (but not necessarily) return the best results if action is taken soon after the signal is generated. Additional opportunities for buying may be found as price zigzags higher, but the trader must look for optimum entry points. Conversely, exit points to preserve gains (or minimize losses) may be evident before the model mechanically closes the signal.
The DecisionPoint LIVE Shared ChartList has launched! Click on the link and you'll find webinar and blog chart spotlights. Be sure and bookmark it!
Technical Analysis is a windsock, not a crystal ball.
Happy Charting!
- Carl


