Last week I wrote regarding SPY: "Consolidation may continue for a bit, and it is possible that price will move lower toward the point of the breakout and fill Tuesday's gap; however, the charts in all three time frames are bullish, and I favor a breakout to new all-time highs next week." Had I remembered that there was to be a Fed announcement on Wednesday, I would have anticipated that the market would probably churn until after that. Nevertheless, the market did break out ever so slightly before the close on Friday, but obviously, more work needs to be done before the move can be considered decisive.
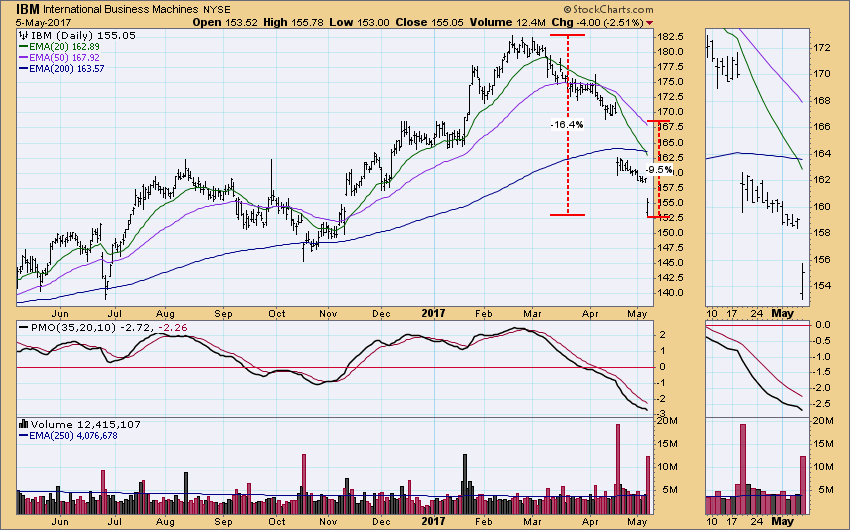
A significant problem for the market is that IBM has tanked, thanks in large part to Warren Buffet having dumped the stock. IBM is heavily weighted in the Dow and S&P 500 (as well as others), so there is a major drag on those indexes, particularly since mid-April.
The DecisionPoint Weekly Wrap presents an end-of-week assessment of the trend and condition of the stock market (S&P 500), the U.S. Dollar, Gold, Crude Oil, and Bonds.
STOCKS
IT Trend Model: BUY as of 11/15/2016
LT Trend Model: BUY as of 4/1/2016
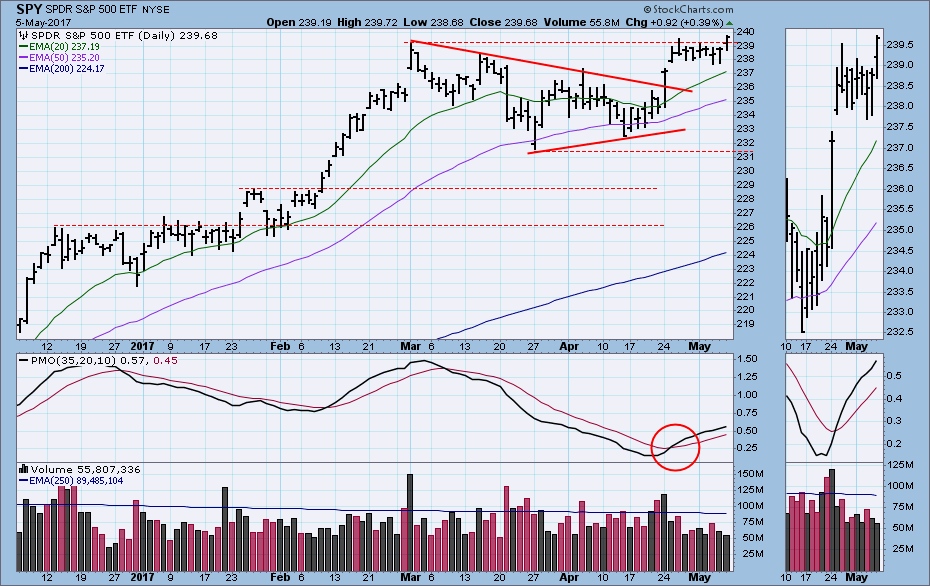
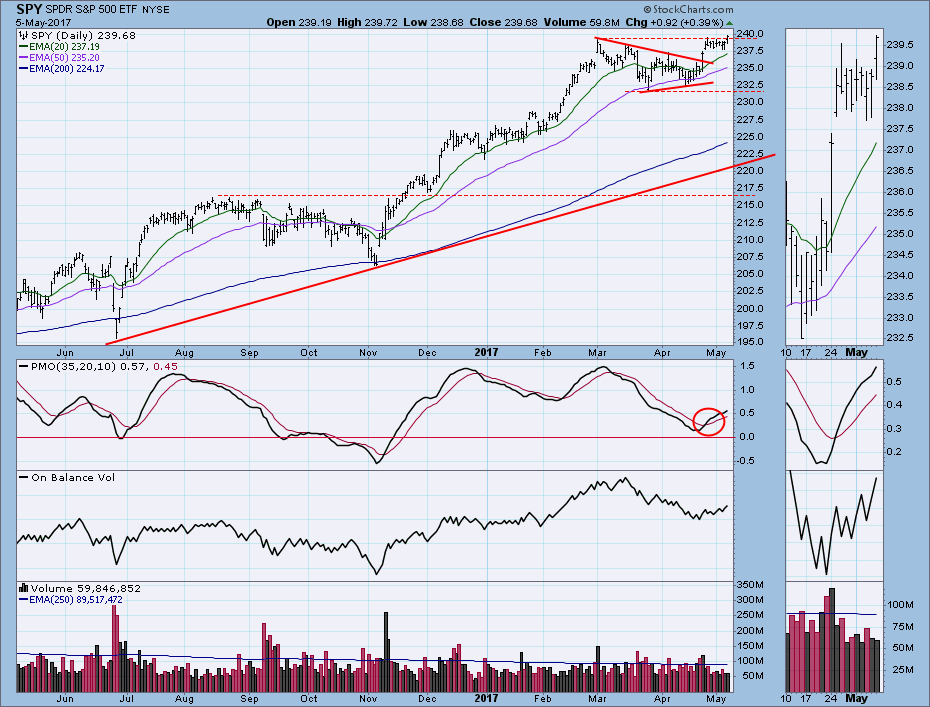
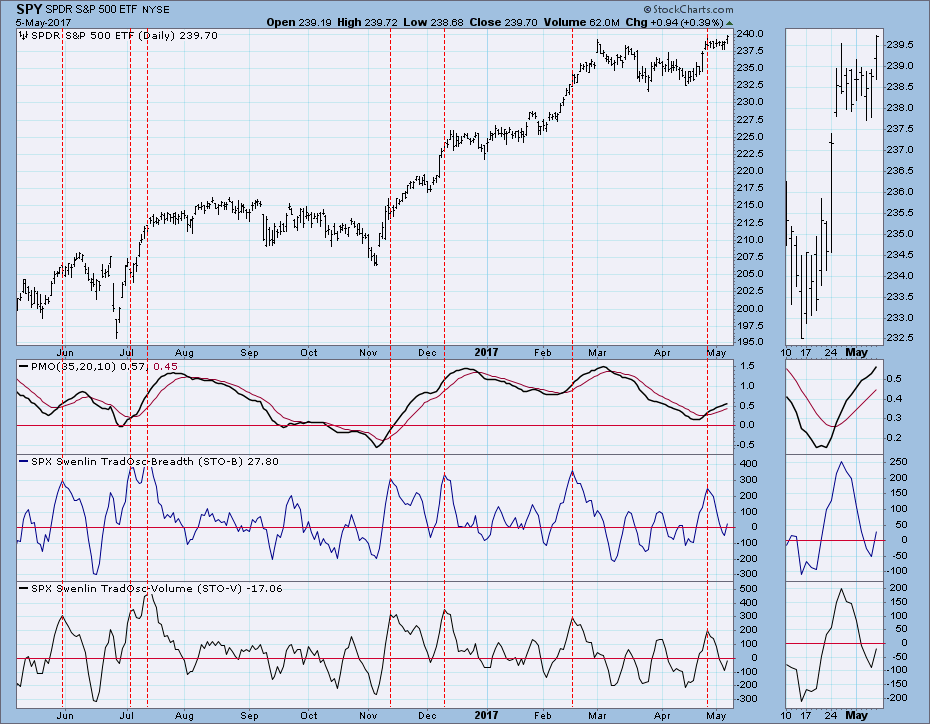
SPY is poised positively in almost every regard. It has moved to new, all-time highs, and the daily PMO (Price Momentum Oscillator) is rising above the signal line. OBV is sluggish, but that could be remedied with a pick up in volume associated with a continuation of the breakout.
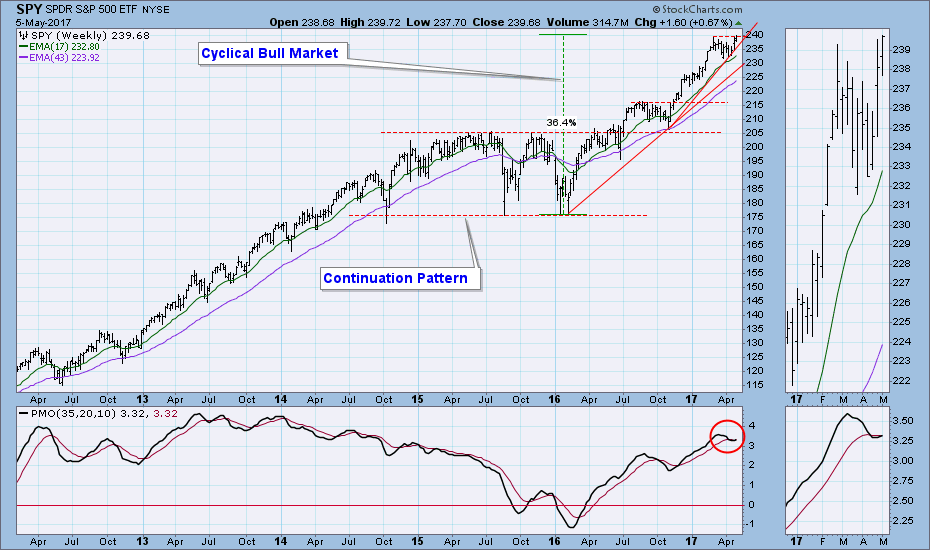
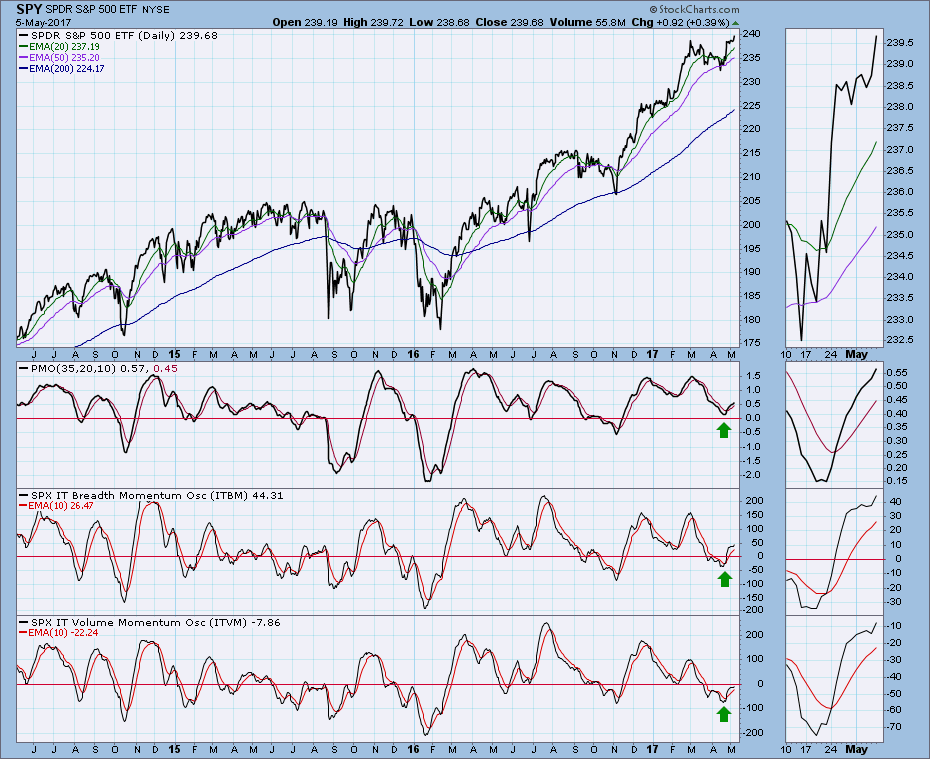
The weekly PMO has bottomed and it is about to move above the signal line.
Short-Term Market Indicators: The STO-B and STO-V have bottomed and are now in sync with the PMO. The indicators were sufficiently oversold for a bull market, and they have plenty of room to move higher before they become overbought.
Intermediate-Term Market Indicators: The ITBM and ITVM had topped midweek, but they are rising again along with the PMO. As with the short-term indicators above, these indicators have plenty of room to move higher.
Conclusion: While Friday's breakout to new, all-time highs was pretty slim, I don't think it is a fakeout. Rather I think it is the beginning of another up leg to the bull market. IBM has managed to get itself into its own personal bear market, and that has been dragging down the major market indexes. However, other stocks have been correcting or consolidating as well, and when they resume their rally, I think they will bury the negative effects of IBM. Bottom Line: I remain bullish on stocks.
DOLLAR
IT Trend Model: NEUTRAL as of 3/21/2016
LT Trend Model: BUY as of 10/17/2016
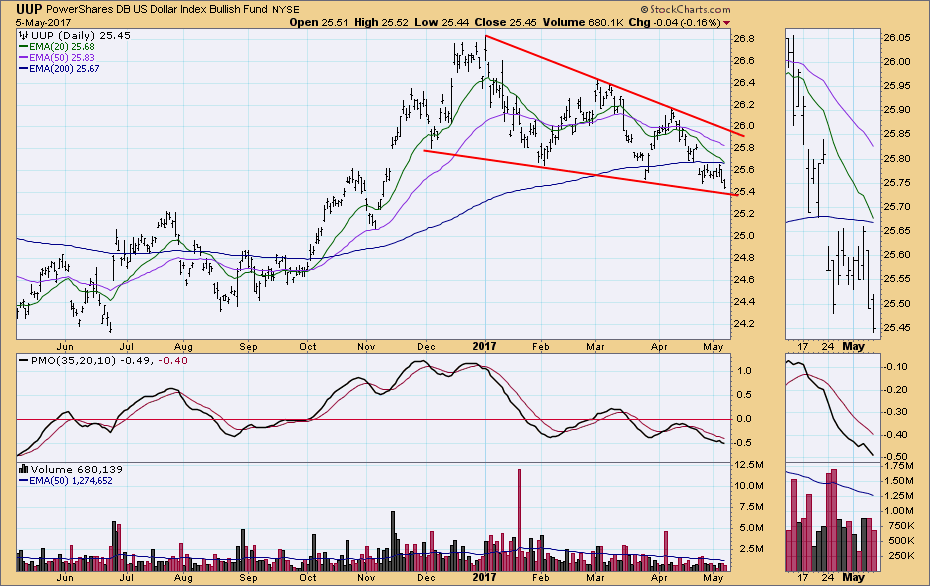
The dominant feature on the UUP daily chart is a falling wedge, which is usually bullish because we normally expect them to resolve upward; however, note that the bounce off the April low has stalled and a lower low was made on Friday. I'm beginning to think we're going to see a breakdown rather than a breakout.
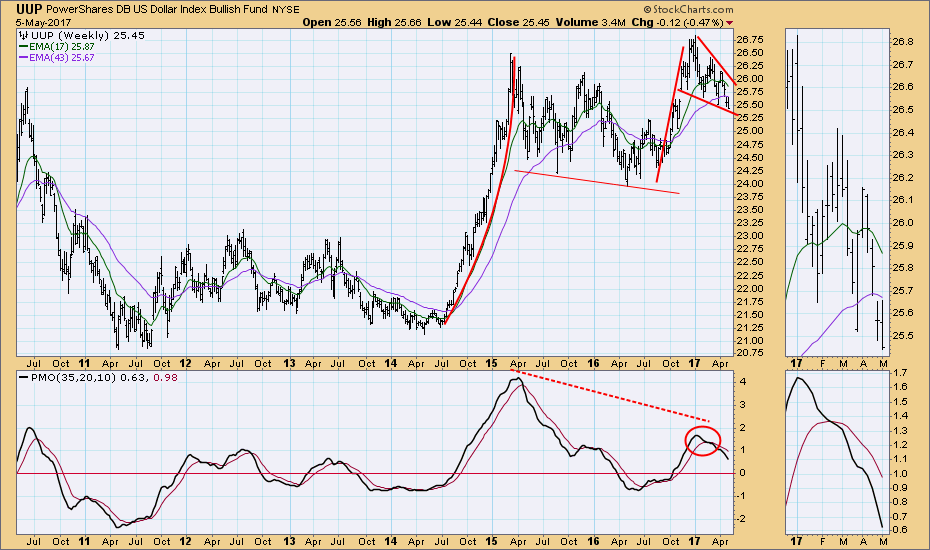
The UUP weekly chart has a bullish pennant formation, but there is a PMO negative divergence across the 2015 and 2016 price tops, and the weekly PMO is falling. UUP could rebound, but now I anticipate a negative outcome.
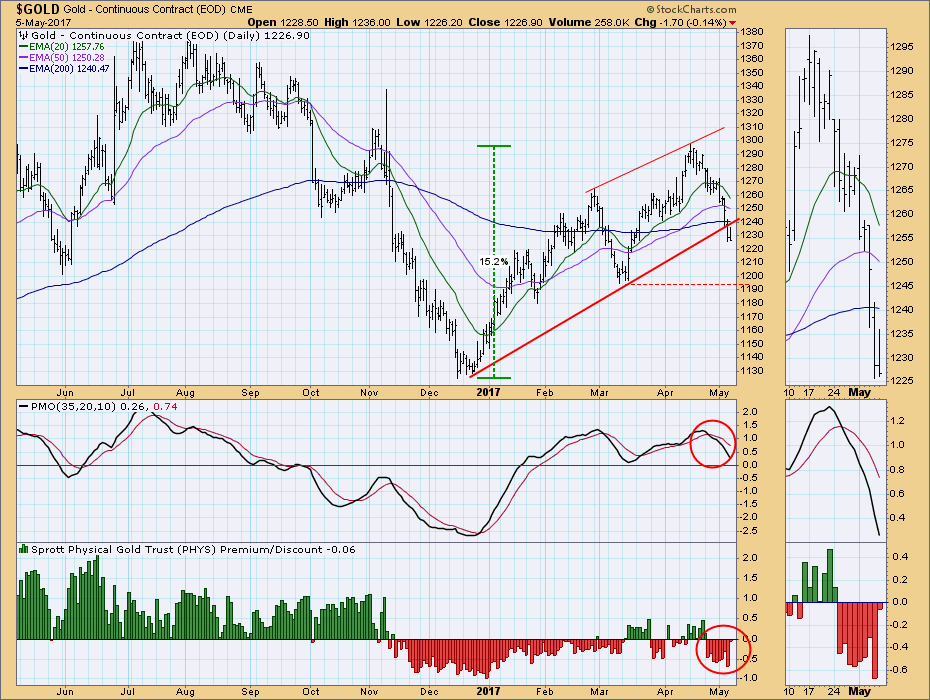
GOLD
IT Trend Model: BUY as of 2/3/2017
LT Trend Model: BUY as of 4/12/2017
Gold violated the rising trend line drawn from the December 2016 low, which is also the low for the bear market that began in 2011. While the IT and LT Trend Models are on BUY signals, they will be reversed if price remains below the three moving averages shown on the daily chart. Sentiment has been running neutral to slightly bearish -- not a factor.
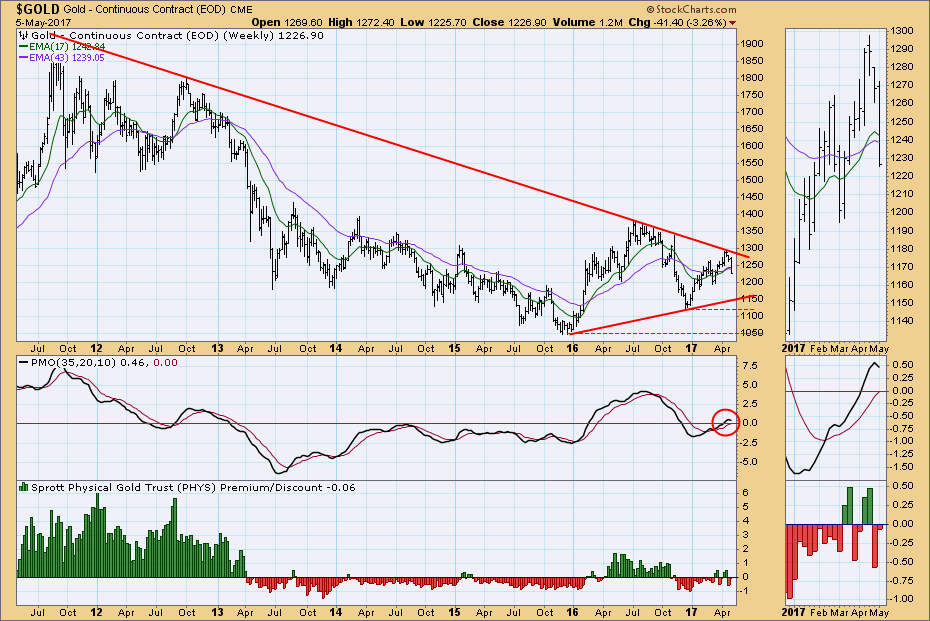
On the weekly chart price has been turned back from the long term declining tops line, and the weekly PMO topped this week. While I have been operating on the premature assumption that the 2011 gold bear market is over, in fact, price needs to break above the declining tops line before a new bull market is officially in progress. In the meantime, the triangle (indecision pattern) is still the dominant formation on the chart.
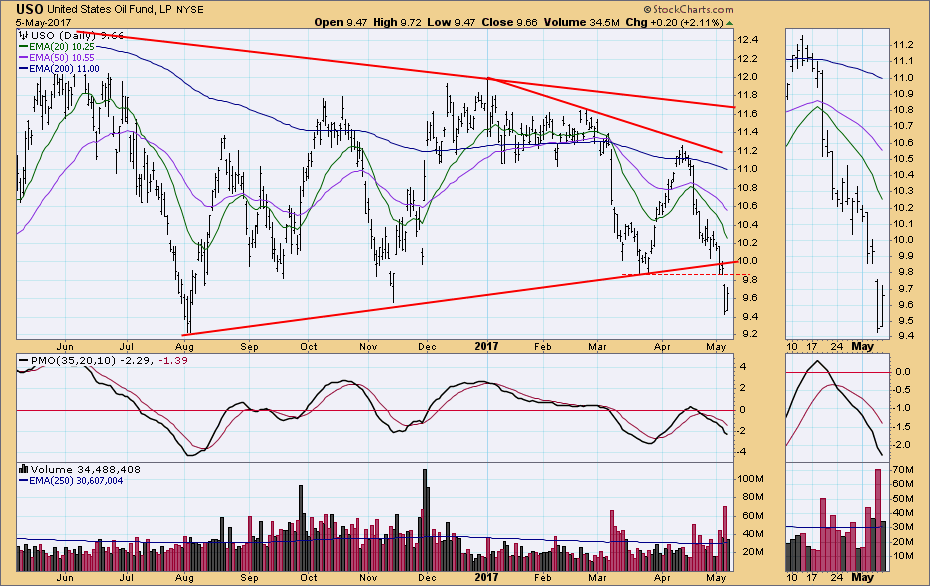
CRUDE OIL (USO)
IT Trend Model: NEUTRAL as of 3/8/2017
LT Trend Model: SELL as of 3/9/2017
Crude oil continued its dive from the April top, losing almost 10% this week.
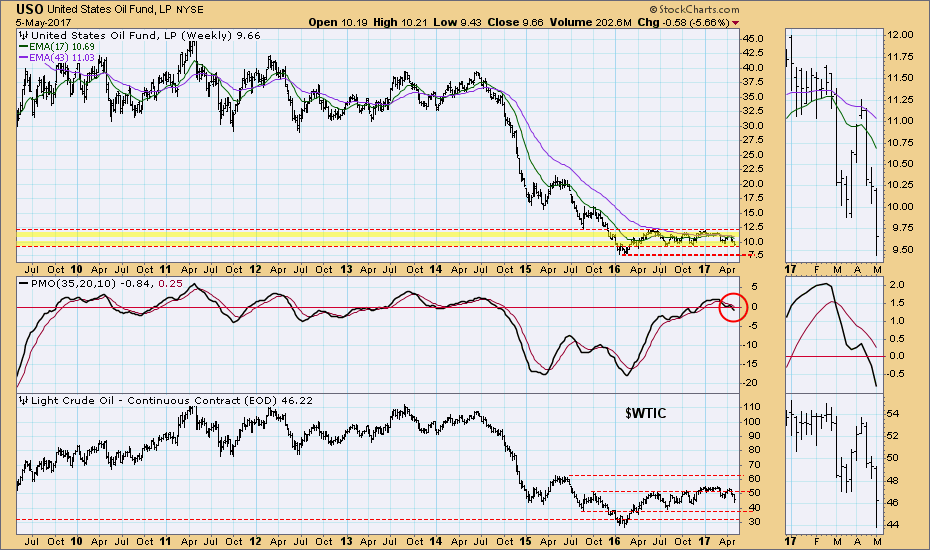
On the weekly chart USO has reached the bottom of the one-year trading channel, but $WTIC, which represents futures contracts, remains near the center of a similar trading range. Continued weakness in $WTIC could drive USO down to test the low set in 2016. The current weekly PMO configuration (PMO topping below the signal line) is very negative.
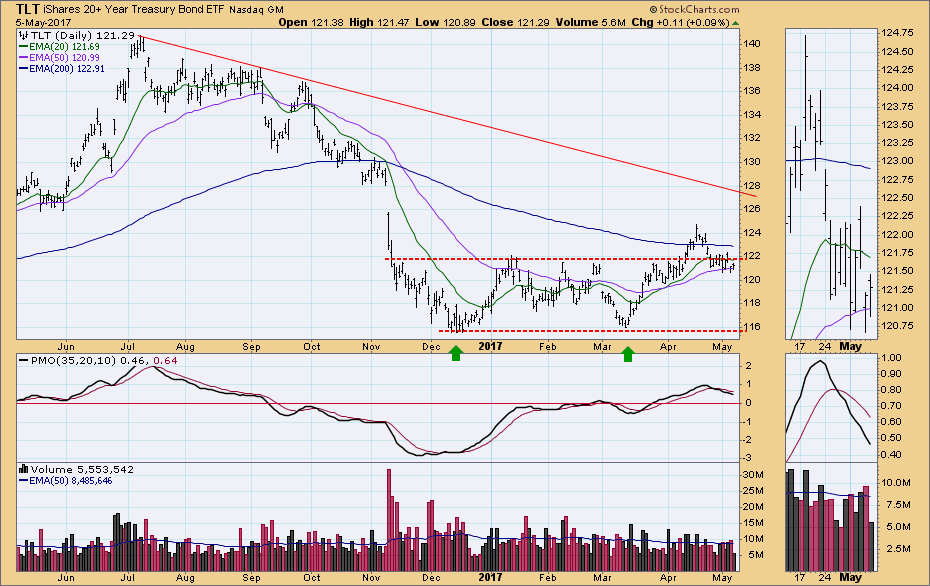
BONDS (TLT)
IT Trend Model: BUY as of 3/31/2017
LT Trend Model: SELL as of 11/17/2016
In early April TLT broke above the resistance of the double bottom confirmation line, but two weeks ago the breakout failed after the PMO topped. The FOMC did not raise interest rates this week, so there was no increase in downside pressure for bonds, but with future interest rate increases projected, the upside potential for bonds seems rather limited.
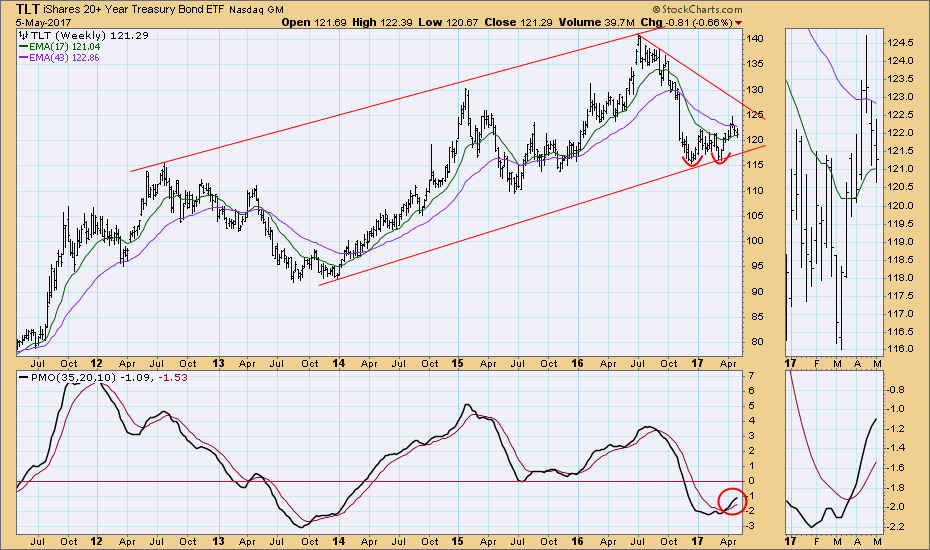
 The weekly PMO is still rising, but we can see that it is decelerating.
NOTE: The signal status reported herein is based upon mechanical trading model signals, specifically, the DecisionPoint Trend Model. They define the implied bias of the price index based upon moving average relationships, but they do not necessarily call for a specific action. They are information flags that should prompt chart review. Further, they do not call for continuous buying or selling during the life of the signal. For example, a BUY signal will probably (but not necessarily) return the best results if action is taken soon after the signal is generated. Additional opportunities for buying may be found as price zigzags higher, but the trader must look for optimum entry points. Conversely, exit points to preserve gains (or minimize losses) may be evident before the model mechanically closes the signal.
The DecisionPoint LIVE Shared ChartList has launched! Click on the link and you'll find webinar and blog chart spotlights. Be sure and bookmark it!
Technical Analysis is a windsock, not a crystal ball.
Happy Charting!
- Carl


