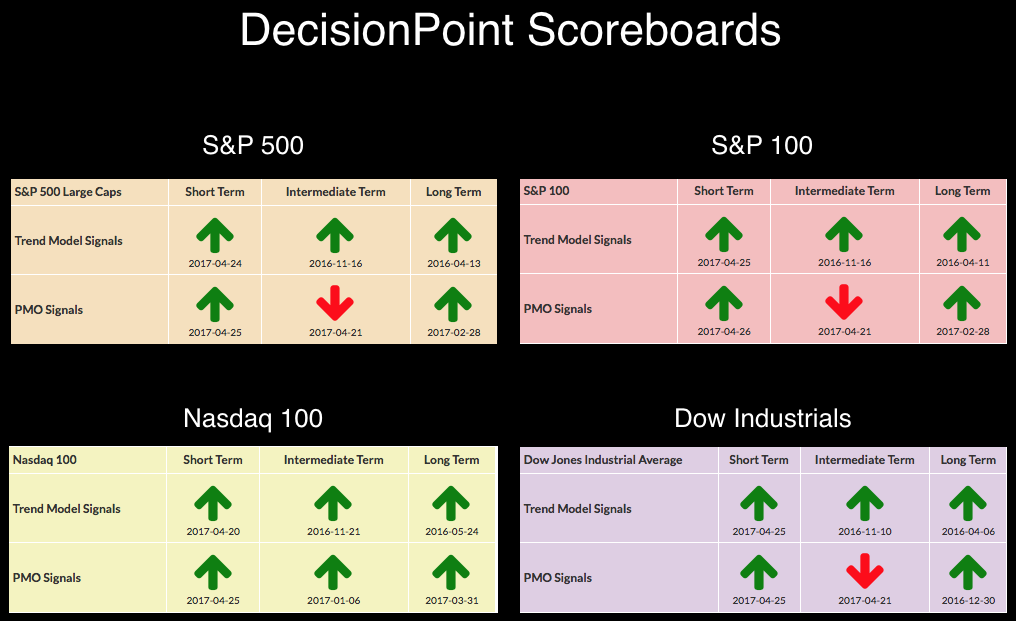
 The market hasn't really done much this week which is keeping the DP Scoreboards in a holding pattern. I've been getting regular 'technical alerts' that the OEX IT Price Momentum Oscillator (PMO) signal has changed, meaning that whipsaw is happening daily. We won't know the actual signal until the weekly chart goes final tomorrow afternoon. I'll keep you apprised.
The purpose of the DecisionPoint Alert Daily Update is to quickly review the day's action, internal condition, and Trend Model status of the broad market (S&P 500), the nine SPDR Sectors, the U.S. Dollar, Gold, Crude Oil, and Bonds. To ensure that using this daily reference will be quick and painless, we are as brief as possible, and sometimes we let a chart speak for itself.
SIGNALS: Here we include charts of any important signal changes triggered today by our Intermediate-Term Trend Model.
NO SIGNAL CHANGES TO REPORT.
NOTE: Mechanical trading model signals define the implied bias of the price index based upon moving average relationships, but they do not necessarily call for a specific action. They are information flags that should prompt chart review. Further, they do not call for continuous buying or selling during the life of the signal. For example, a BUY signal will probably return the best results if action is taken soon after the signal is generated. Additional opportunities for buying may be found as price zigzags higher, but the trader must look for optimum entry points. Conversely, exit points to preserve gains (or minimize losses) may be evident before the model mechanically closes the signal.
STOCKS: Based upon a 11/15/2016 Intermediate-Term Trend Model BUY signal, our current intermediate-term market posture for the S&P 500 (SPY) is bullish. The Long-Term Trend Model, which informs our long-term outlook, is on a BUY signal as of 4/1/2016 so our long-term posture is bullish.
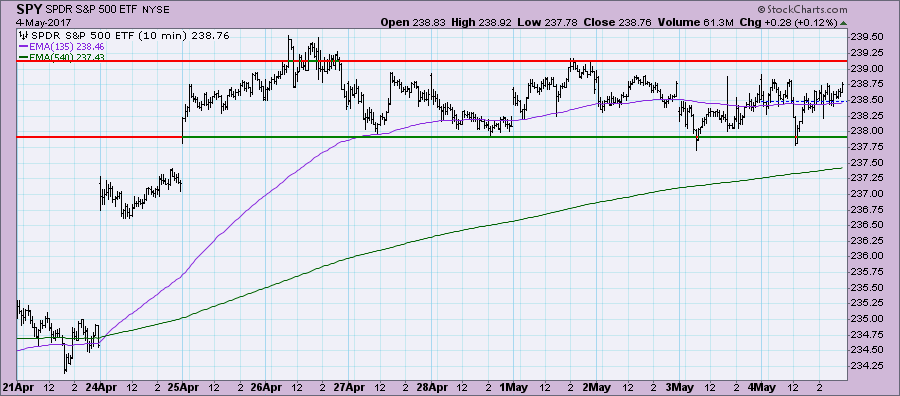
The market's holding pattern is quite clear on the 10-minute bar chart.
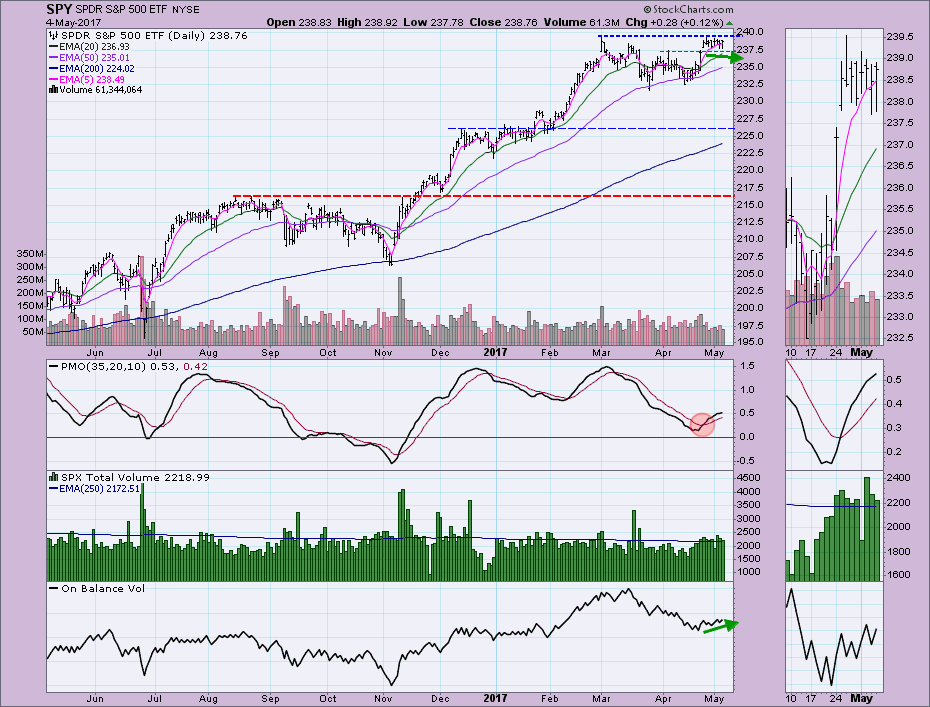
This is actually adding a positive spin. If the market is moving sideways, yet the PMO and OBV are rising in a positive divergence. I don't like that the PMO is decelerating, but it is naturally going to happen if price isn't moving higher. The OBV bottoms have been rising even as price bottoms have been sinking.
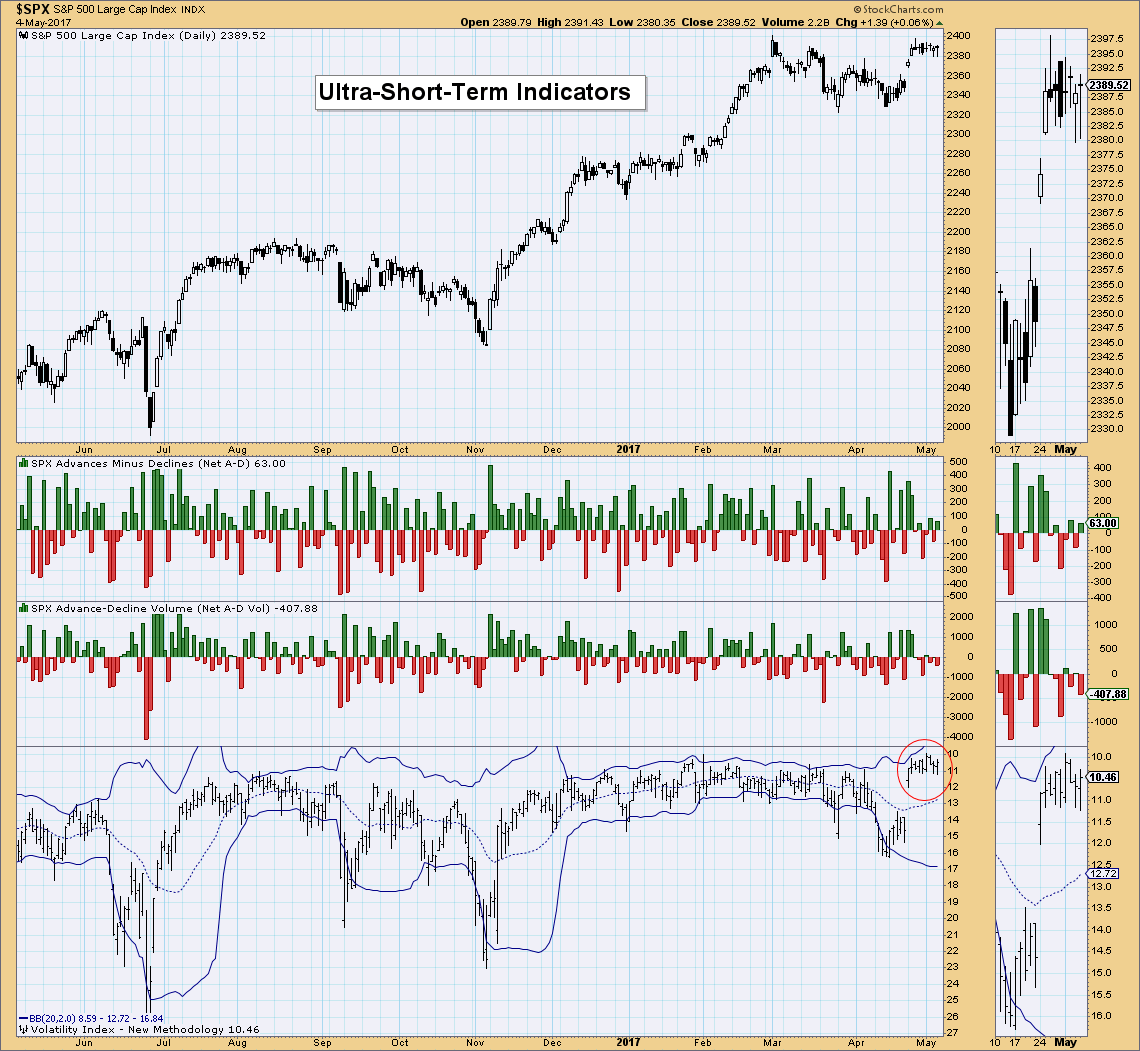
Ultra-Short-Term Indicators: No climactic breadth readings today. The VIX continues to hover above its moving average (inverted scale) which means that investors are complacent and somewhat bullish. If exuberance pushes high enough (an upper band penetration), that would be considered bearish. When headlines on magazines, news items and investor psychology turns extra bullish, that is generally the time to look for a decline or correction. I don't see these readings as a problem yet.
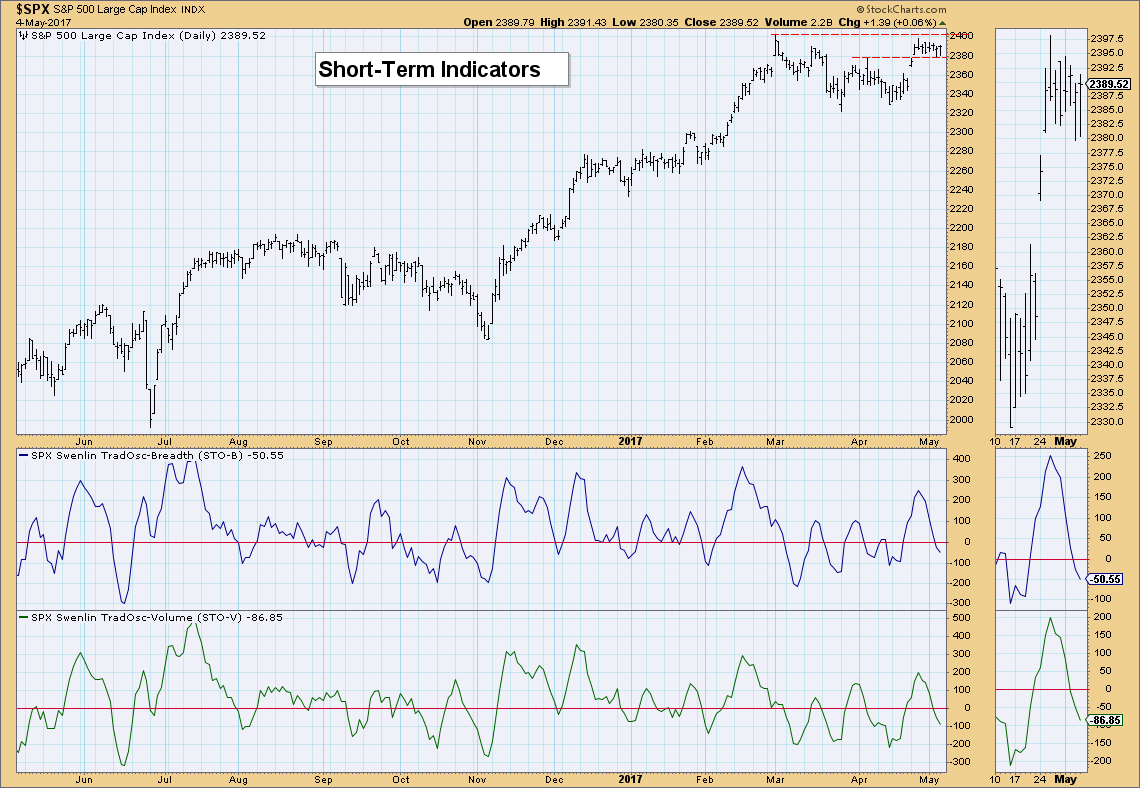
Short-Term Indicators: The market has complied with declining short-term indicators with sideways movement rather than a drop. This suggests internal strength or at least protection from a surprise correction. They are getting oversold, likely preparing for the next push higher.
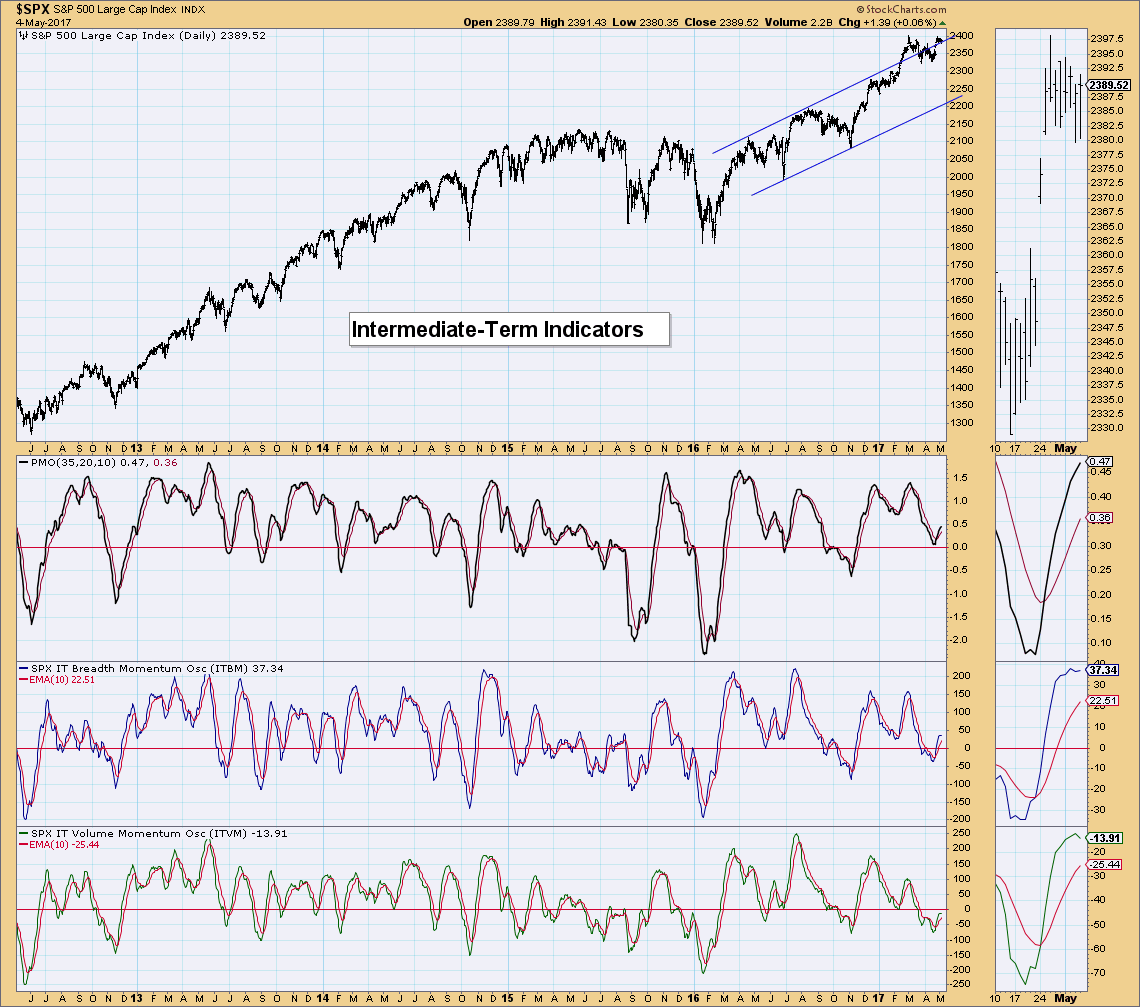
Intermediate-Term Indicators: These indicators have looked very bullish since the positive crossovers their signal lines. Today we are now seeing some hesitation in their advance. The ITVM has actually turned lower. I am not that concerned about this just yet. If we see a negative crossover, that will be the time to reassess.
Conclusion: The market has been consolidating sideways. Indicators are neutral in my estimation. ST indicators are nearly oversold and IT indicators haven't really succumbed to a decline. Tom and I will likely be discussing implications of fading commodities and Gold, but a Dollar that is also struggling right now. Be sure to tune in M/W/F at 12:00p - 1:30p EST for MarketWatchers LIVE to get our latest outlook on the market and all that goes with it from a technical perspective.
**Don't miss the DecisionPoint Alert Daily Commentary! Click on "Email Updates" at the end of this blog page to be notified as soon as it's published at the end of the market day.**
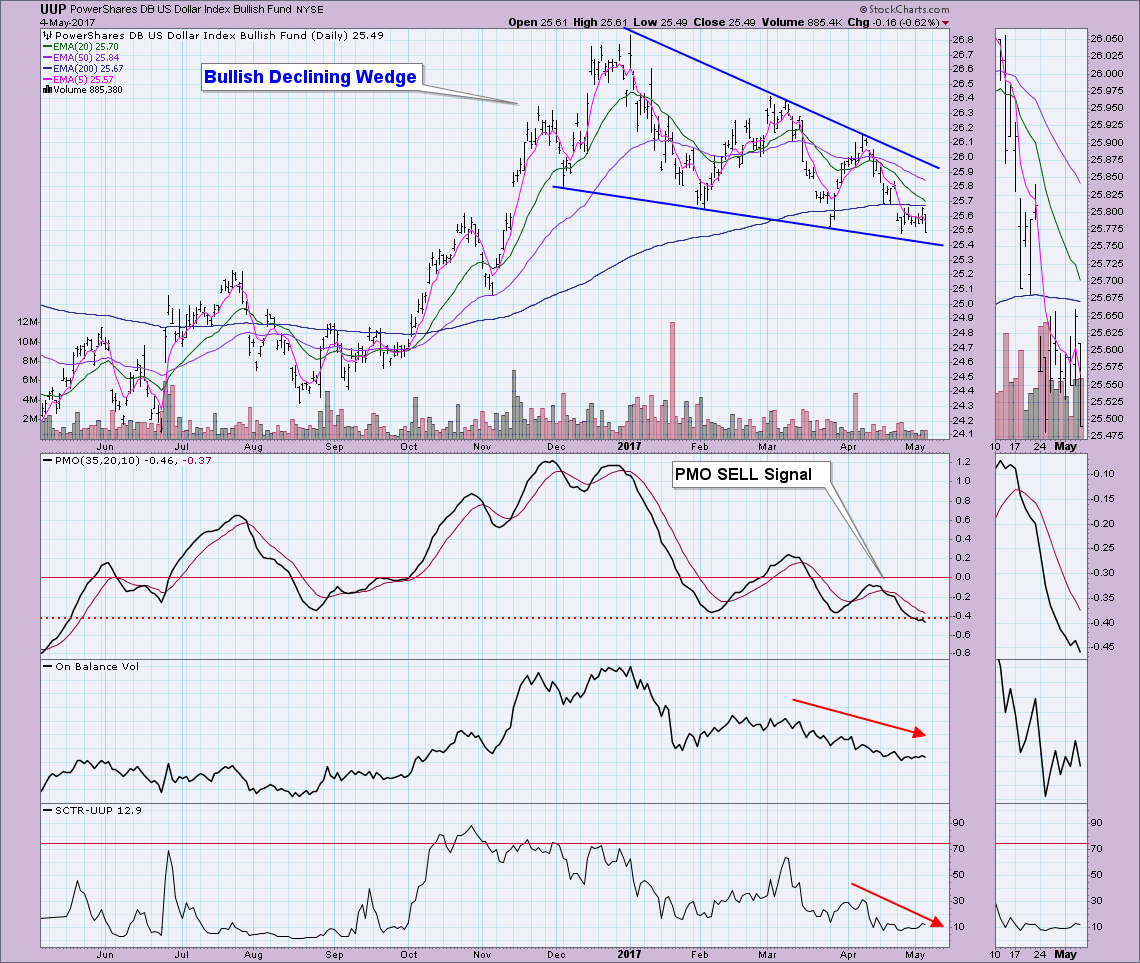
DOLLAR: As of 3/21/2017 the US Dollar Index ETF (UUP) is on an Intermediate-Term Trend Model Neutral signal. The Long-Term Trend Model, which informs our long-term outlook, is on a BUY signal as of 10/17/2016, so our long-term posture is bullish.
This declining wedge is getting long in the tooth and will be reaching the apex soon. I've been waiting to see the Dollar get healthy again and this bullish formation seemed to suggest a rally was lurking. Instead the Dollar is getting ready to test the bottom of wedge, not break out from the top. Of serious concern is the PMO top below the signal line reaching a low we haven't seen since last May. The OBV is attempting to angle upward but I'm not ready to call out any positive divergences or confirmations. The SCTR is barely pulsing. At this point, I suspect this pattern will bust with a breakdown. Support at $25.20, the July high looks like a good stopping point. The PMO should be sufficiently oversold by that time.
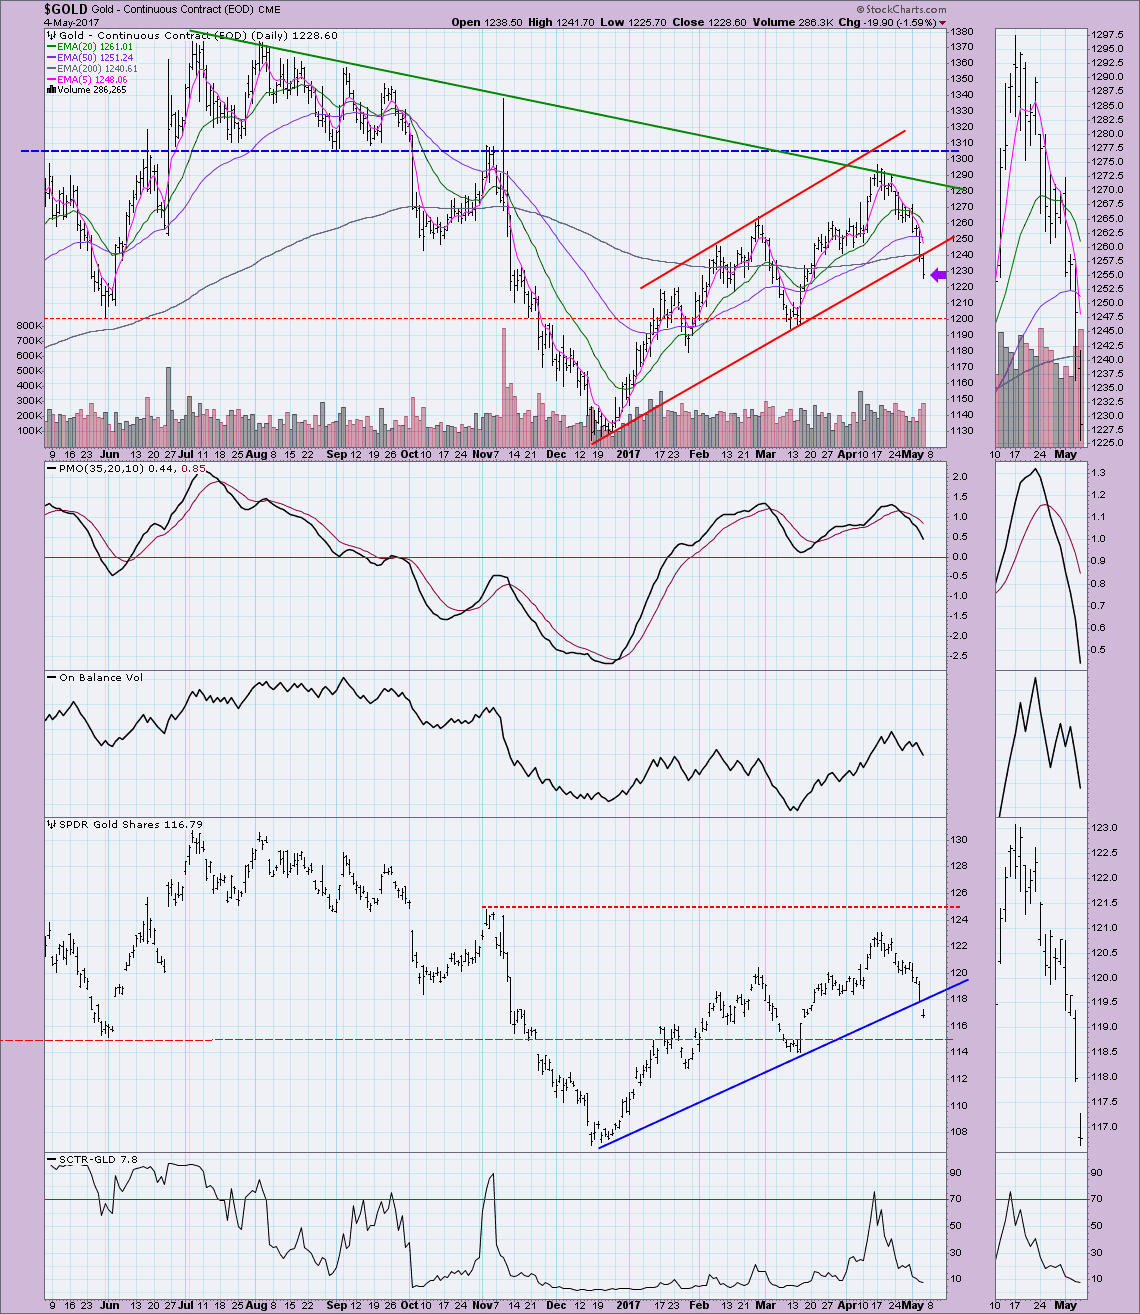
GOLD: As of 2/3/2016 Gold is on an Intermediate-Term Trend Model BUY signal. The Long-Term Trend Model, which informs our long-term outlook, is on a BUY signal as of 4/11/2017, so our long-term posture is bullish.
Gold's correction continues. Today it marked a breakdown below the rising trend channel. The 200-EMA was also breached. Indicators are negatively configured. The IT Trend Model BUY signal is in jeopardy as the 20-EMA is motoring toward the 50-EMA; not to mention, the LT Trend Model BUY signal is also vulnerable as the 50-EMA is tilting back down toward the 200-EMA. I'm looking for support to hold at 1200.
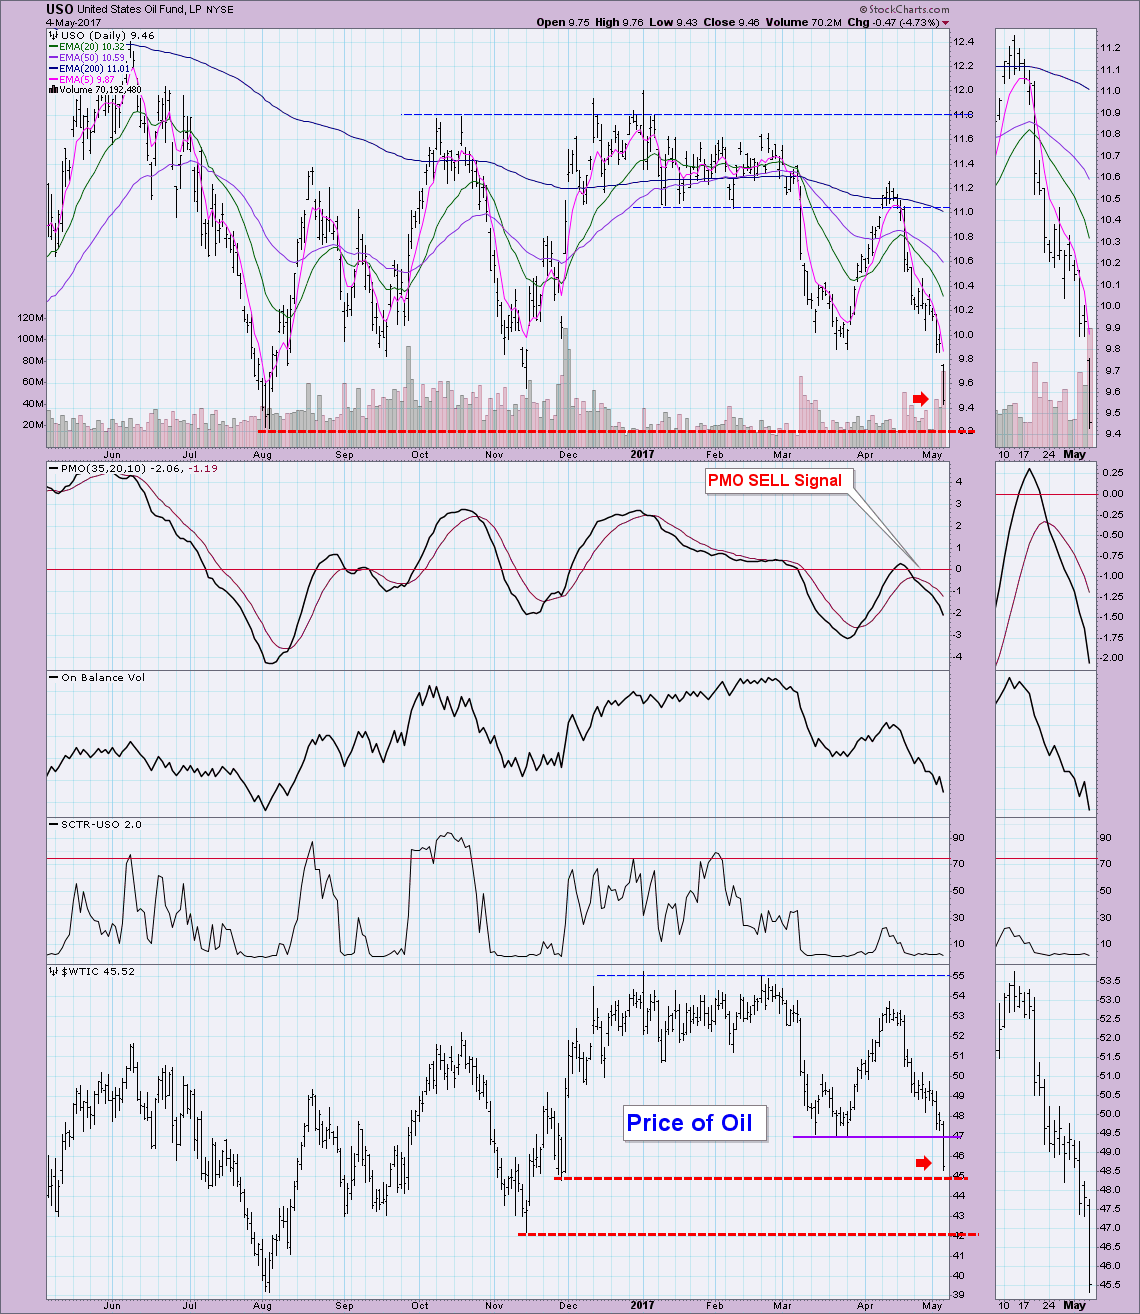
CRUDE OIL (USO): As of 3/8/2017 United States Oil Fund (USO) is on an Intermediate-Term Trend Model Neutral signal. The Long-Term Trend Model, which informs our long-term outlook, is on a SELL signal as of 3/9/2017, so our long-term posture is bearish.
USO crashed today, pushing past the November low and nearly reaching support at last August's low. I had thought that Oil would hold at $47/barrel, but it's almost to support at $45. There should be great opportunity here, but at this point, the knife is falling and I'm not ready to put both hands out to try and catch it.
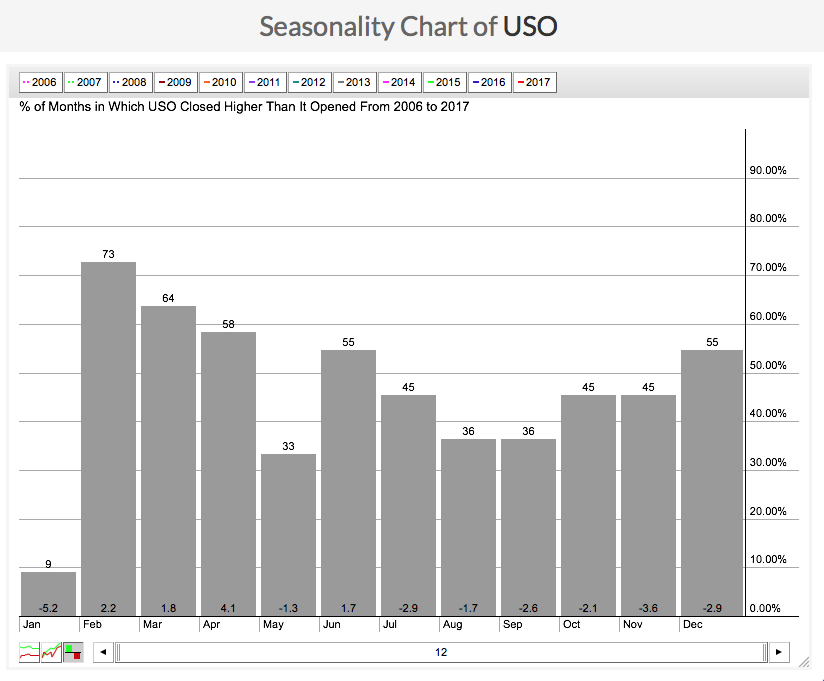
It's always rumored that summer is seasonally best for Oil and Gas. Well a look at USO's seasonality chart suggests the decline could continue. May is the roughest month and while June shows some possible profit, July and August are the next worst.
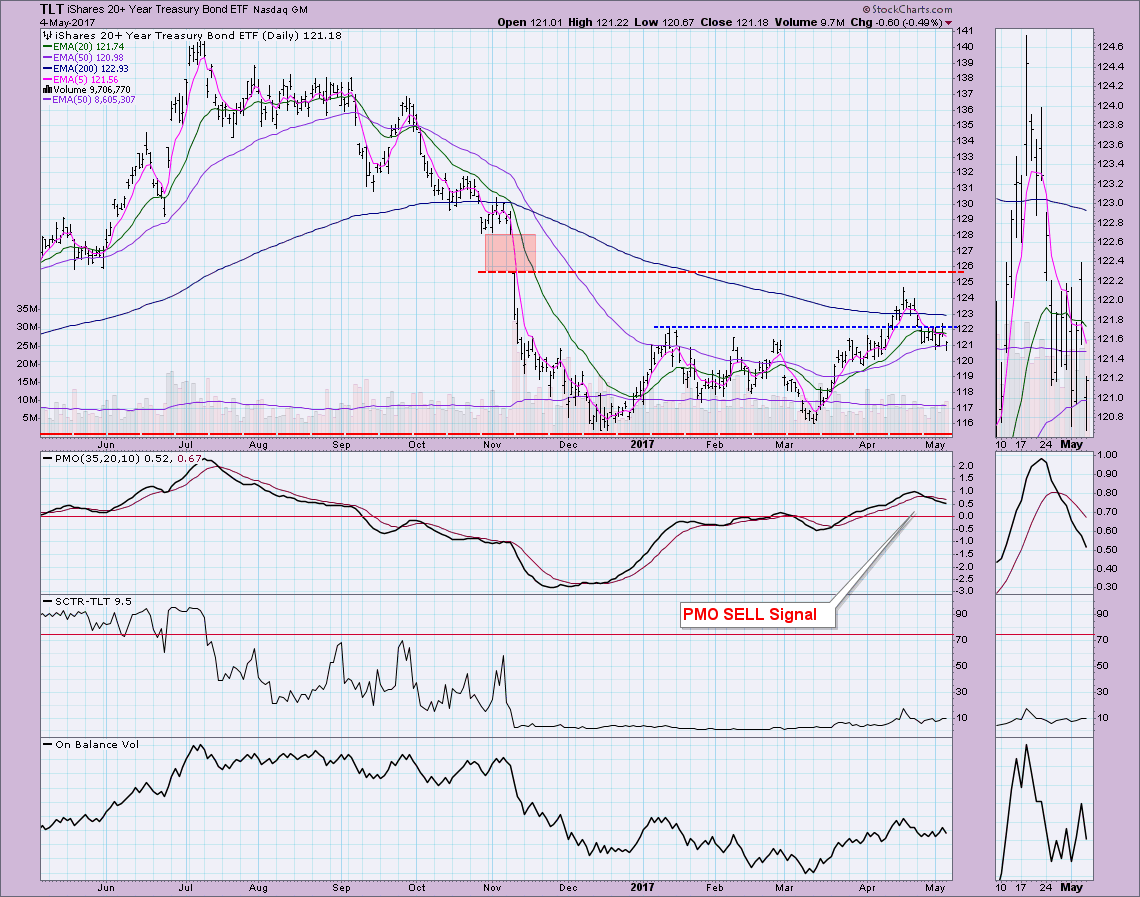
BONDS (TLT): As of 3/31/2017 The 20+ Year T-Bonds ETF (TLT) is on an Intermediate-Term Trend Model BUY signal. The Long-Term Trend Model, which informs our long-term outlook, is on a SELL signal as of 11/17/2016, so our long-term posture is bearish.
Bonds are barely hanging onto the 50-EMA support. Indicators are not positive so I expect TLT will not hold the $121 level, more likely it will correct to at least $118.
The DecisionPoint LIVE Shared ChartList has launched! Click on the link and you'll find webinar and blog chart spotlights. Be sure and bookmark it!
Technical Analysis is a windsock, not a crystal ball.
Happy Charting!
- Erin
