 During today's MarketWatchers LIVE show (Tune in MWF 12:00-1:30p EST) Tom Bowley and I looked at "Monday Set-Ups". Check the MarketWatchers Recap here to see the list. I found the Singapore ETF (EWS) through a Price Momentum Oscillator (PMO) Scan that I like to run (see it in this ChartWatchers article). This chart came right to my attention even with over 50+ CandleGlance charts the scan produced. Here's why I like it:
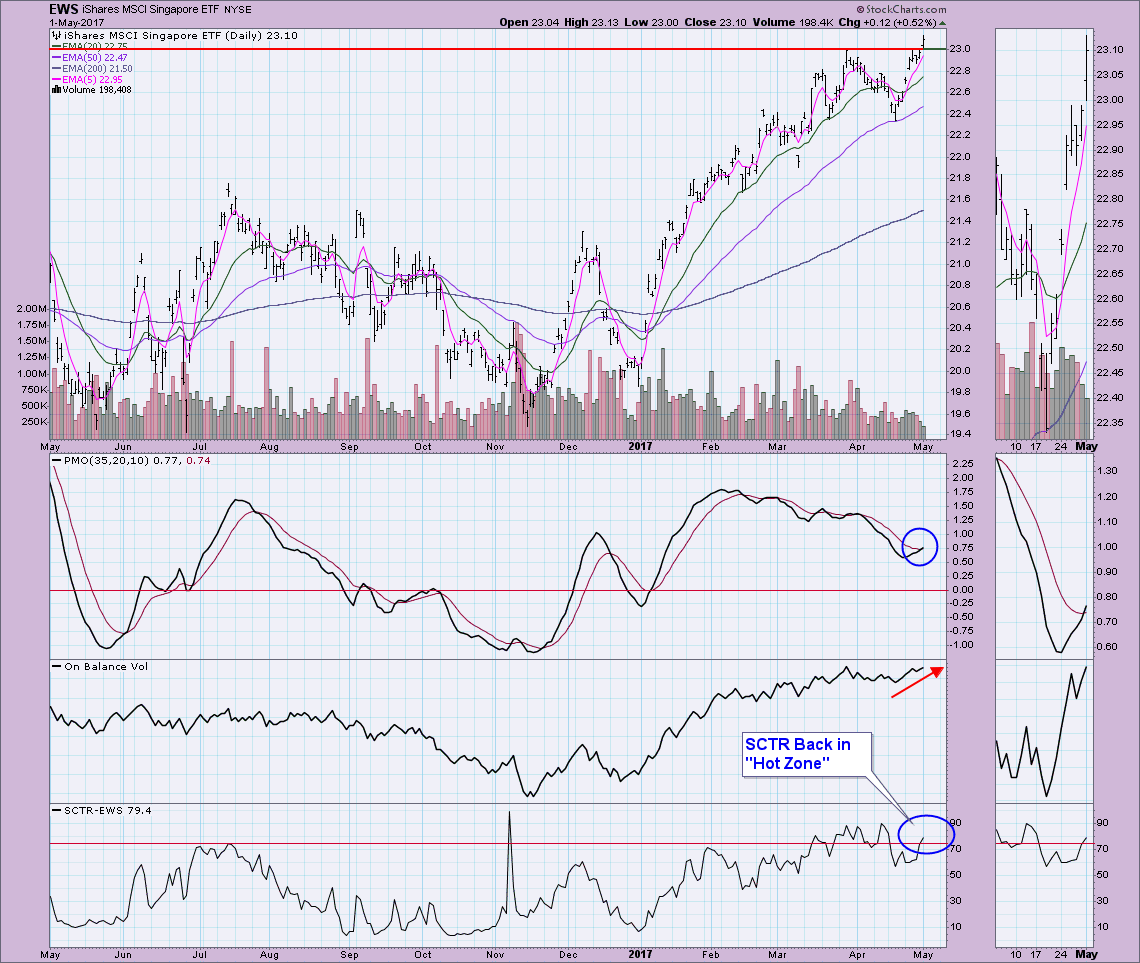
First we have a beautiful breakout today after two gaps, likely a breakaway and a runaway gap. The PMO just generated a crossover BUY signal. The 5/20/50/200-EMAs are configured positively. OBV has been trending up with price and the SCTR has now moved above 75 into what I call the "hot zone".
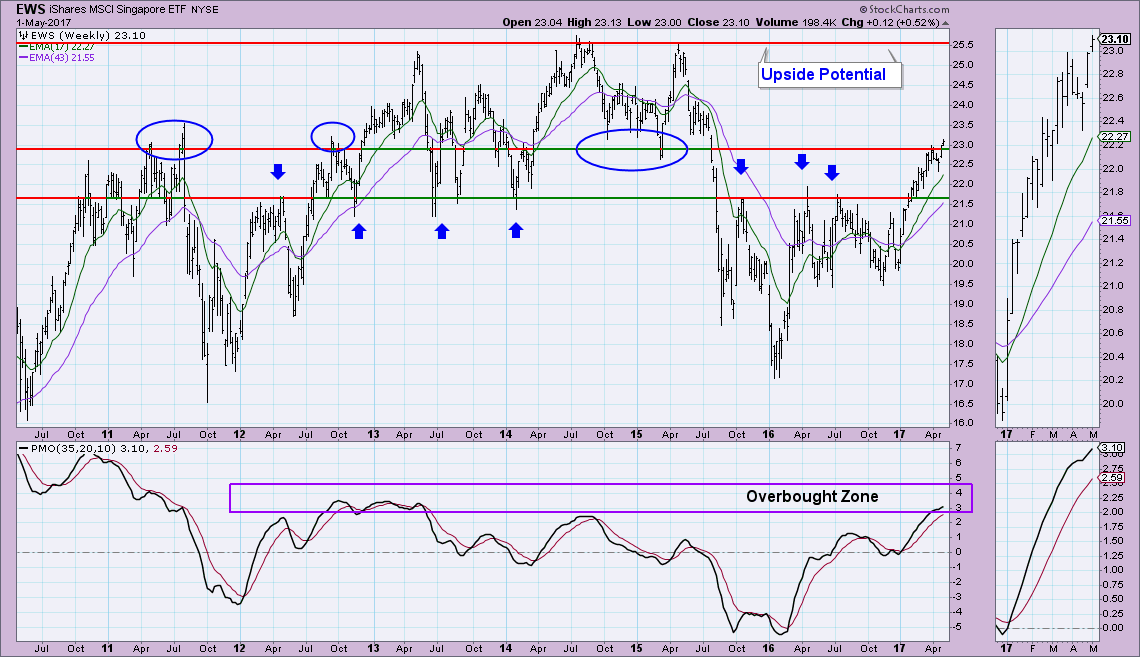
The breakout today is more significant in a weekly context. This is taking out resistance formed by the lows in 2014/2015, as well as the tops from 2011 and 2012 that I've marked. Support at $21.50 is very strong, note all of the "touches" by interim price tops and bottoms. This support level would likely be a great place for a protective stop. I am concerned that the PMO is somewhat overbought right now, but it has just picked up some acceleration and we have seen higher readings back in 2010 after a strong rally.
The DecisionPoint LIVE Shared ChartList is available now! Click on the link and you'll find all your favorite DP charts all annotated! Be sure and bookmark it!
Technical Analysis is a windsock, not a crystal ball.
Happy Charting!
- Erin


