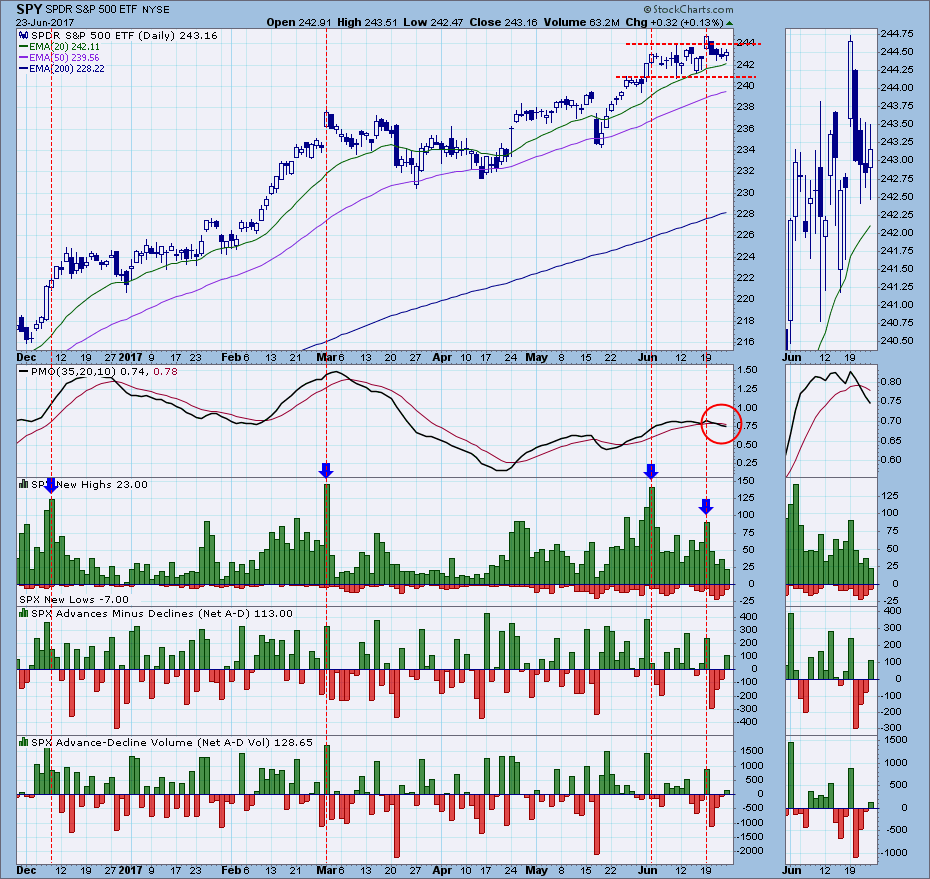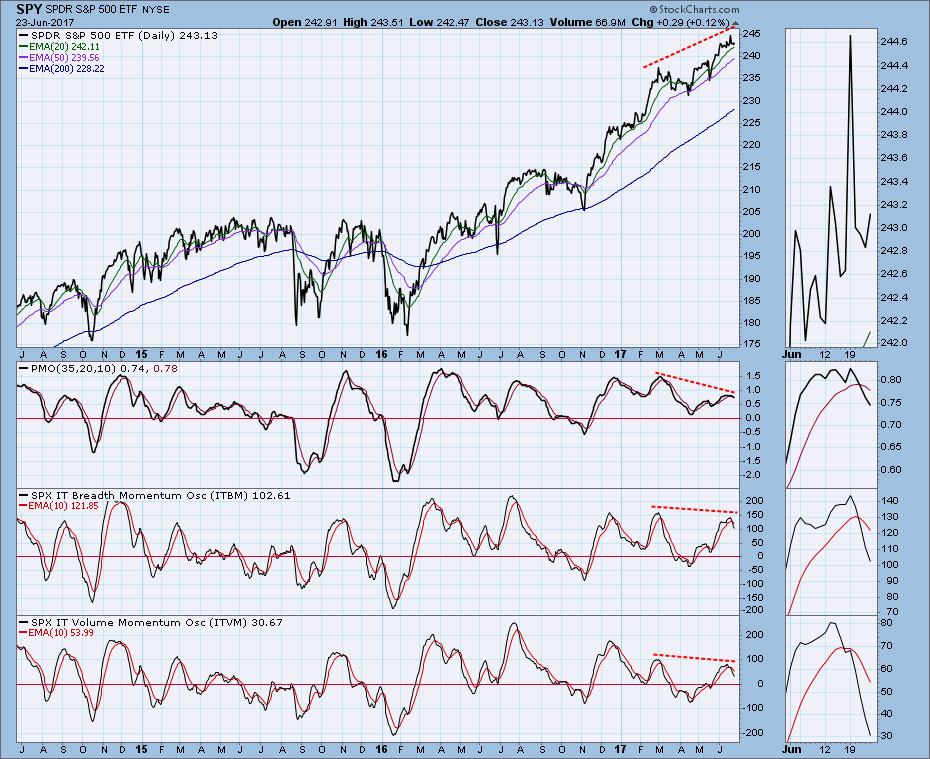
SPY began the week with a breakout on very high volume that subsequently looks like a minor blowoff, as price retreated back into the June trading range. The expansion of New Highs on Monday failed to match the climactic level of New Highs on June 2, and a PMO top implies that we could be in for more churning, and maybe a bit of a decline.
The DecisionPoint Weekly Wrap presents an end-of-week assessment of the trend and condition of the stock market (S&P 500), the U.S. Dollar, Gold, Crude Oil, and Bonds.
STOCKS
IT Trend Model: BUY as of 11/15/2016
LT Trend Model: BUY as of 4/1/2016
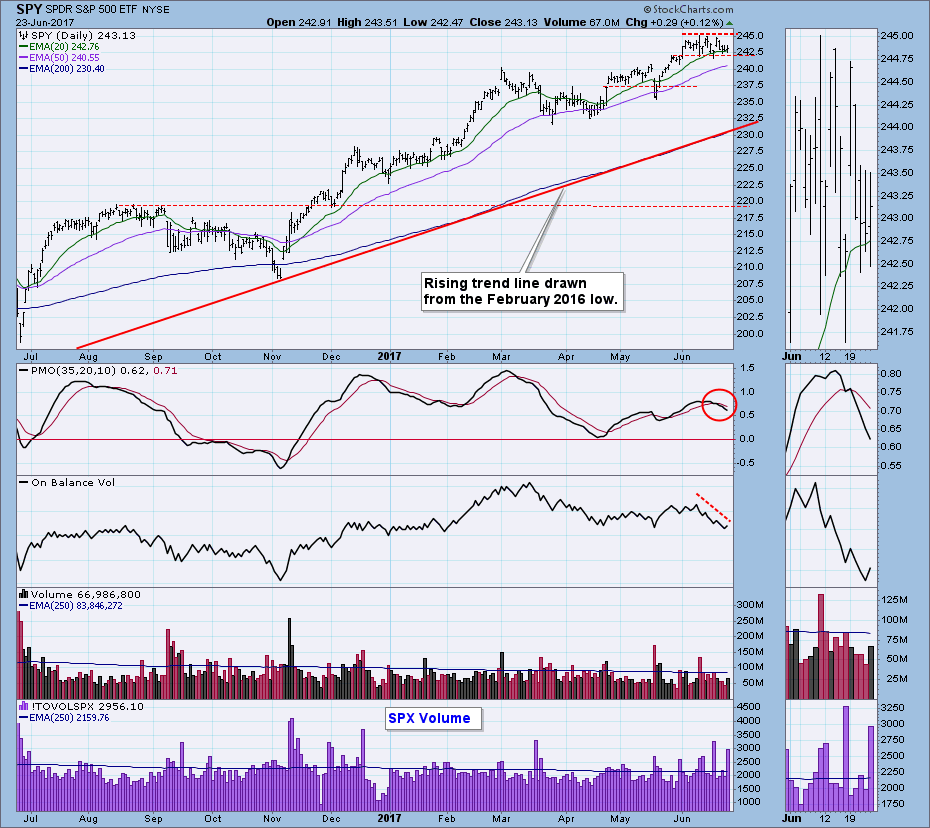
The SPY daily PMO crossed down through its signal line this week, an event that we interpret negatively. Being in a bull market means that any resulting correction will probably be small, and that sideways movement may be the worst of it. Price is still well above the bull market trend line, so that excess needs to be relieved somewhat. Also, OBV is diverging negatively across the price tops in June.
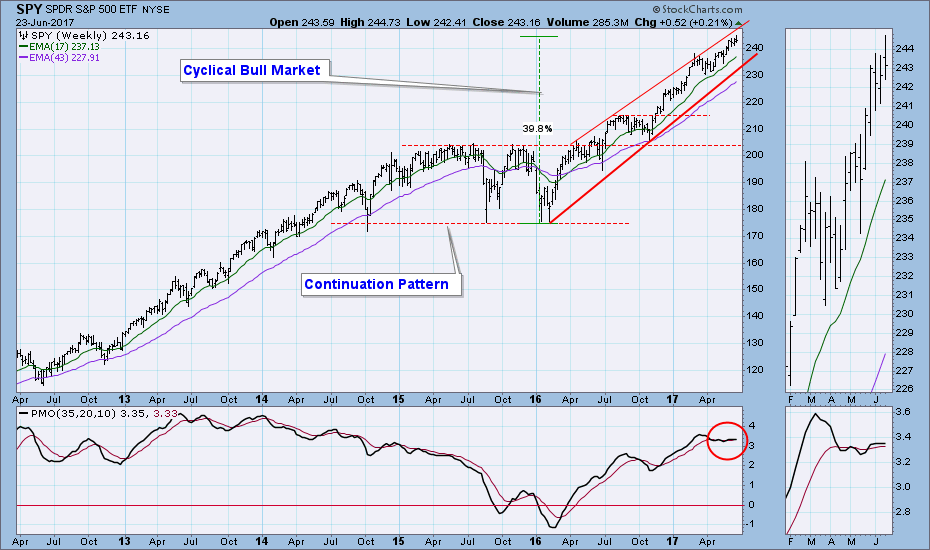
The weekly PMO is overbought and has been fluttering since April, and this means that the rate-of-change has been steady -- not accelerating or decelerating.
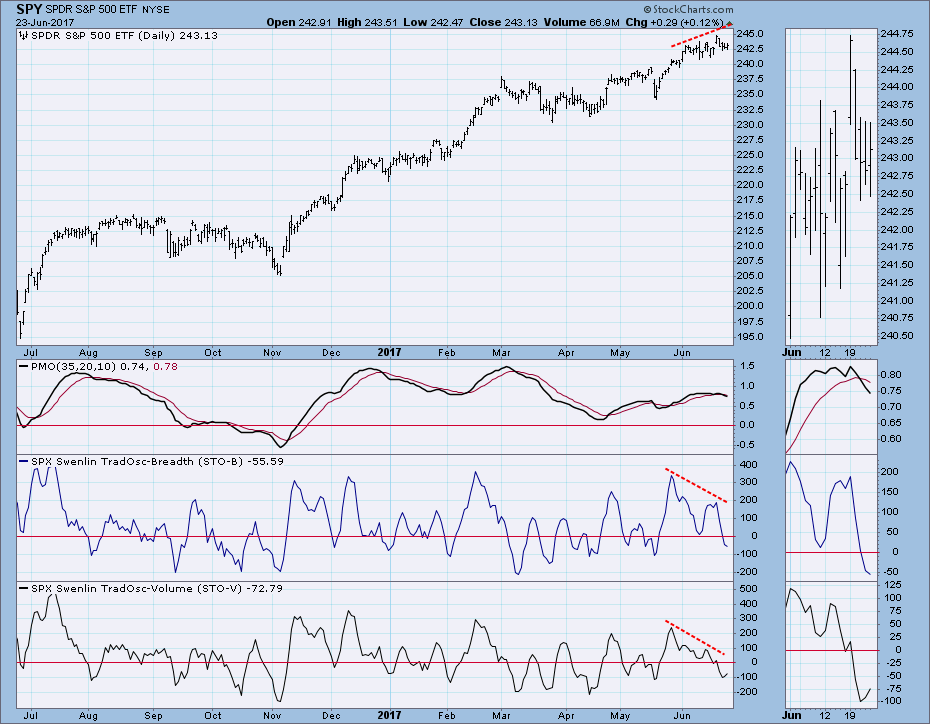
Short-Term Market Indicators: In this time frame the indicators are neutral to slightly oversold, and combined with the PMO top, lower prices are indicated. Note the negative divergences.
Intermediate-Term Market Indicators: In this time frame indicators are overbought, and there are significant negative divergences.
Conclusion: Last week I said: "Our primary short- and intermediate-term indicators are looking dismal, and my assumption is that at the very least the sideways churning will continue for another week or two. Considering the difficulties in the technology sector, the consolidation could morph into a correction rather quickly." I think the same conclusion applies this week. Price popped on Monday, then it slid back into the June trading range, so the consolidation continued as expected. We're still in a situation where people could be surprised to the downside.
DOLLAR
IT Trend Model: NEUTRAL as of 3/21/2016
LT Trend Model: SELL as of 5/24/2017
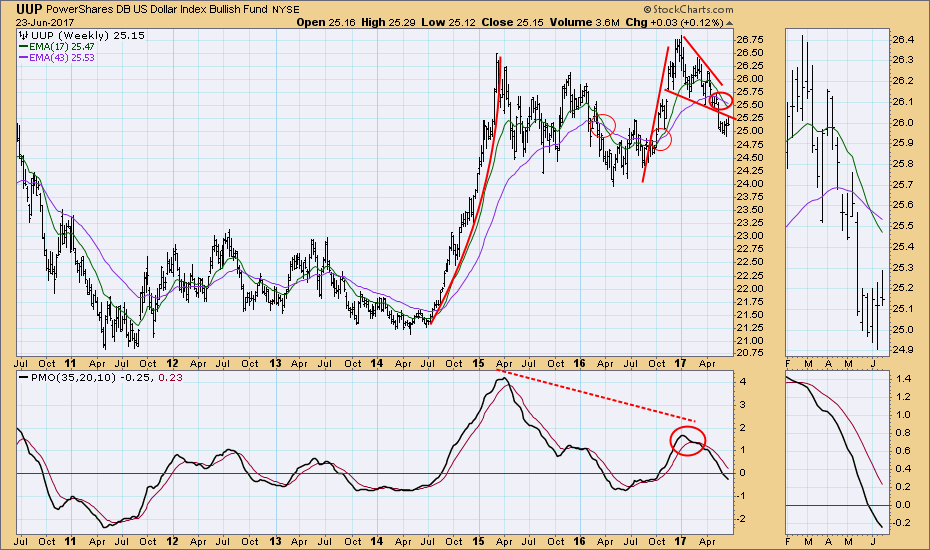
UUP broke above a triple bottom confirmation line earlier this week, but the breakout failed on Friday.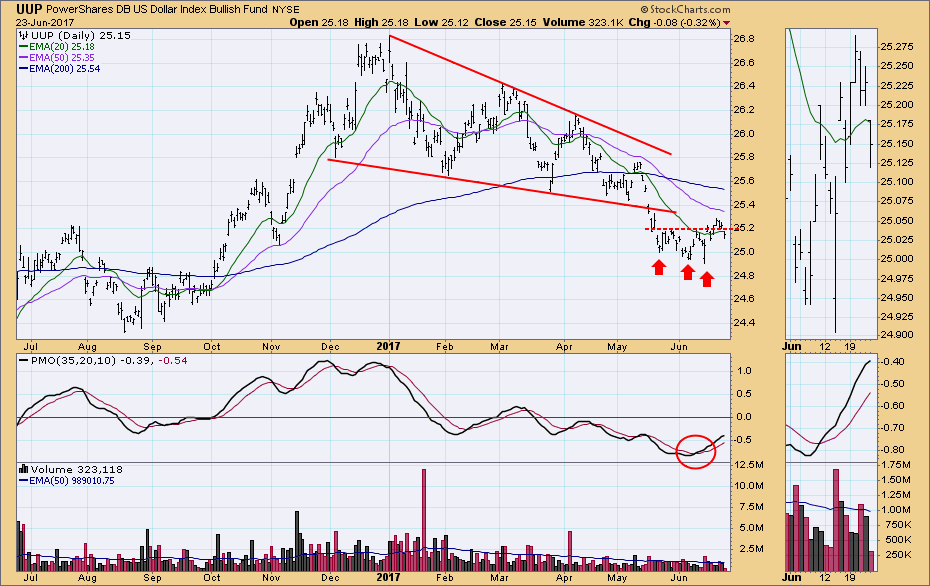
The UUP weekly chart is negative in all aspects -- pennant formation resolved downward, EMAs negative, PMO falling below its signal line.
GOLD
IT Trend Model: BUY as of 5/22/2017
LT Trend Model: BUY as of 4/12/2017
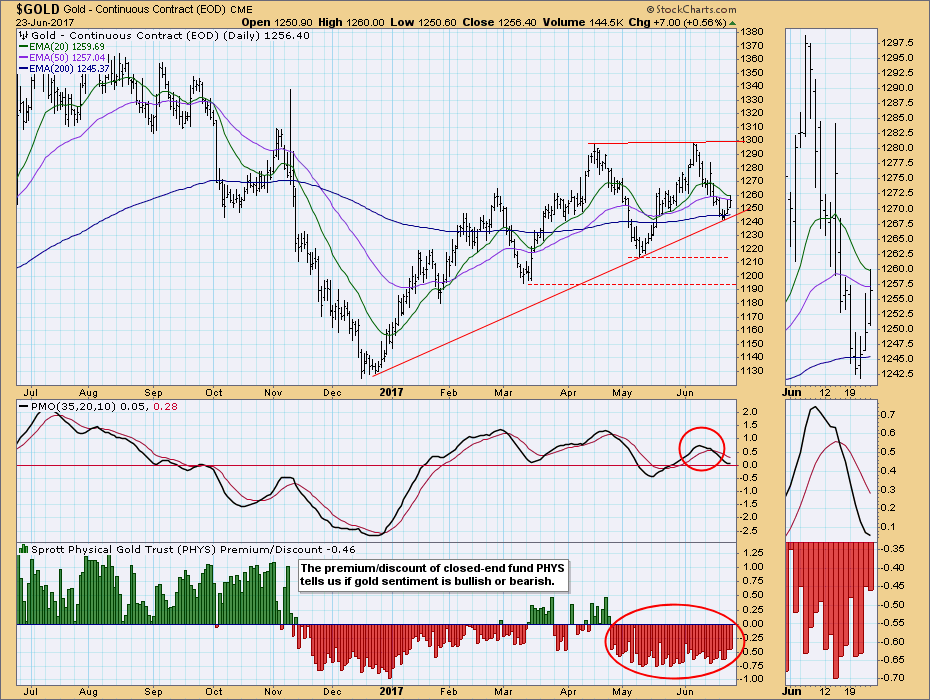
Gold seems to have found support on the rising trend line drawn from the bear market low in 2016, and the daily PMO seems to be trying to bottom. Sentiment, as expressed by the persistent discount held by closed-end fund PHYS, remains bearish. If this small bounce turns into a rally, we would hope for confirmation by sentiment turning positive.
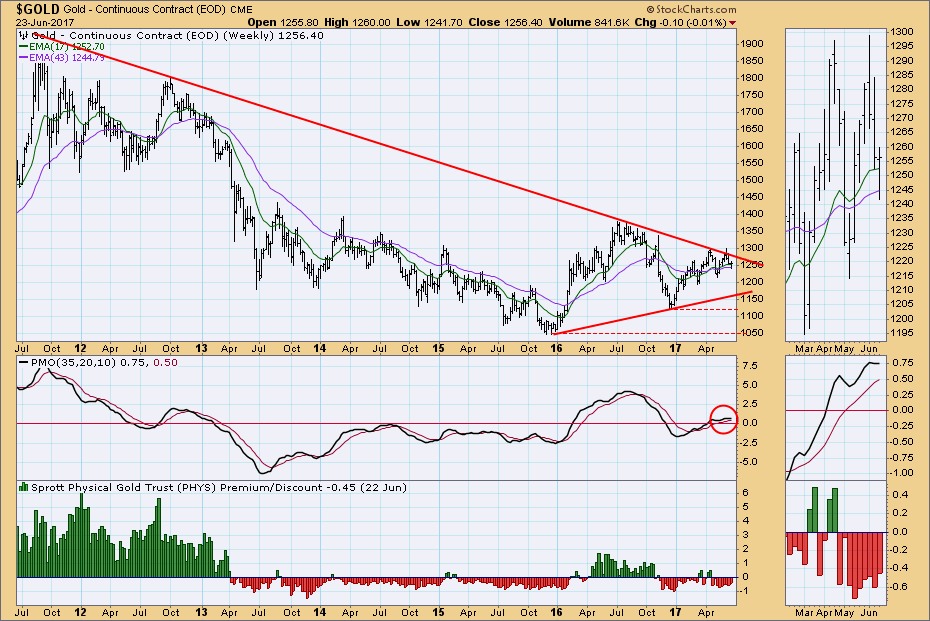
Since bottoming earlier this year, the weekly PMO has given us a lot of whipsaw, but we should look for it to confirm any rally in gold by turning up fairly quickly.
CRUDE OIL (USO)
IT Trend Model: NEUTRAL as of 3/8/2017
LT Trend Model: SELL as of 3/9/2017
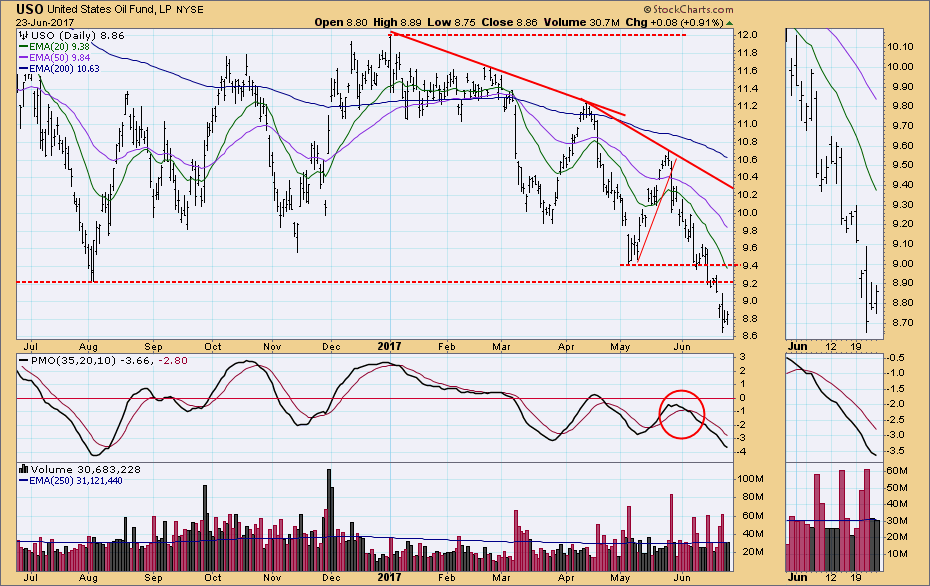
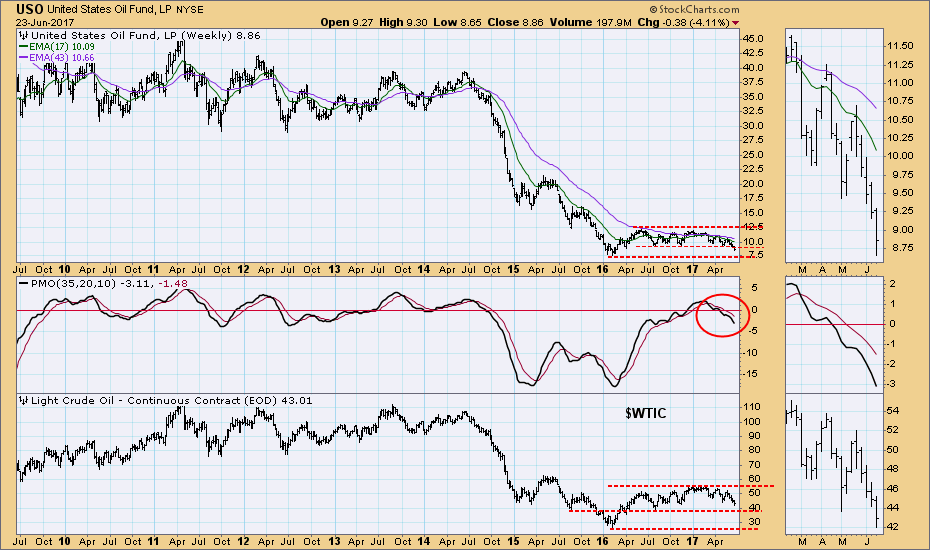
Crude dropped down another notch this week. We need to check the weekly chart to get a better idea of possible support.
The weekly chart of $WTIC shows the next likely support to be at 39.00, making my best guestimate for comparable USO support to be at about 7.50. Beyond that, the 2016 $WTIC low of 25.00 in 2016 is certainly a possibility we should consider, which would put USO well below the 7.50 support level.
BONDS (TLT)
IT Trend Model: BUY as of 3/31/2017
LT Trend Model: BUY as of 6/16/2017
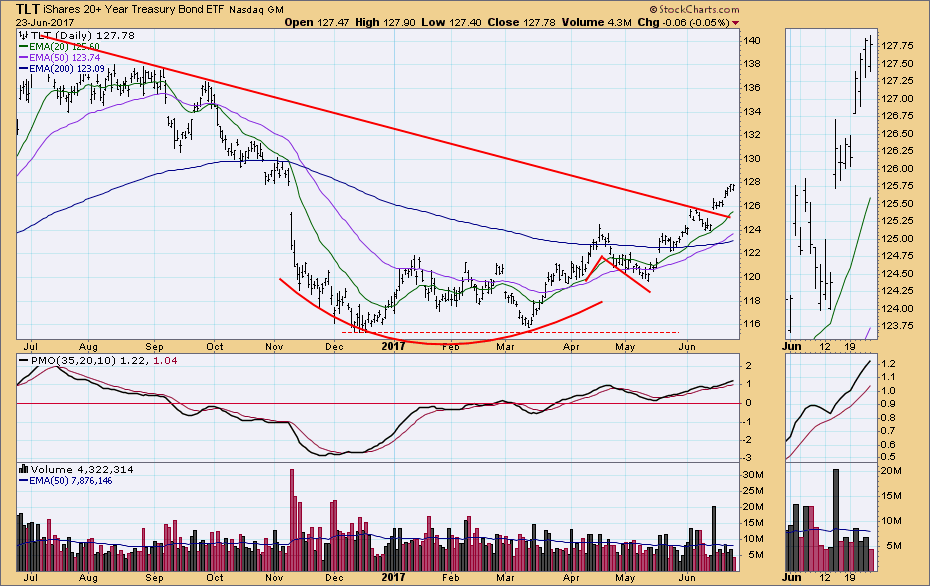
The daily chart shows how the current rally grew out of a 'saucer-with-handle' formation. Last week price broke above the declining tops line drawn from the 2016 top, and the rally continued this week. There has not yet been any technical snapback toward the point of breakout, so we should be on the alert for something like that to happen. the breakout will not be considered 'decisive' until about 129.25, but it still looks pretty good.
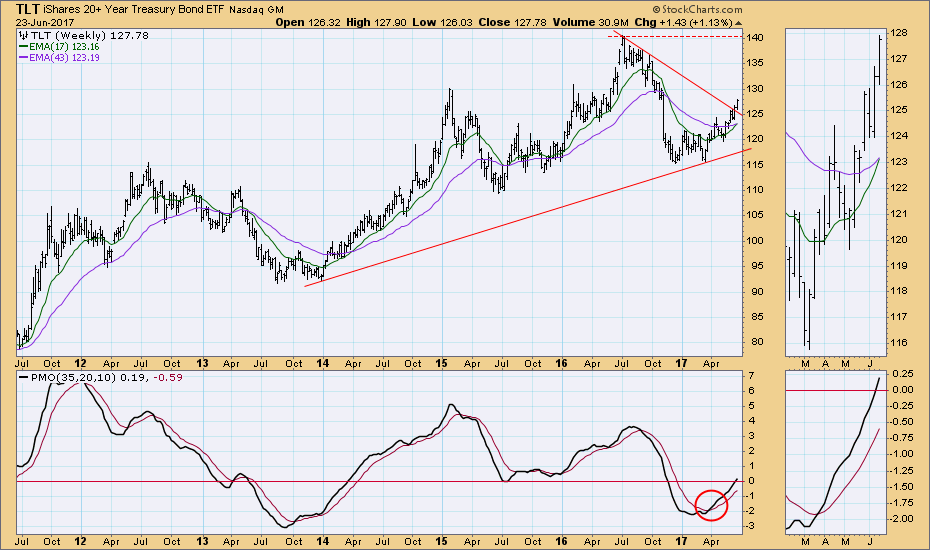
The weekly chart confirms our positive outlook.
**Don't miss the DecisionPoint Alert Daily Commentary! Go to the "Notify Me" box toward the end of this blog page to be notified as soon as it is published at the end of the market day.**
Technical Analysis is a windsock, not a crystal ball.
Happy Charting!
- Carl
NOTE: The signal status reported herein is based upon mechanical trading model signals, specifically, the DecisionPoint Trend Model. They define the implied bias of the price index based upon moving average relationships, but they do not necessarily call for a specific action. They are information flags that should prompt chart review. Further, they do not call for continuous buying or selling during the life of the signal. For example, a BUY signal will probably (but not necessarily) return the best results if action is taken soon after the signal is generated. Additional opportunities for buying may be found as price zigzags higher, but the trader must look for optimum entry points. Conversely, exit points to preserve gains (or minimize losses) may be evident before the model mechanically closes the signal.
Helpful DecisionPoint Links:
DecisionPoint Shared ChartList and DecisionPoint Chart Gallery
Price Momentum Oscillator (PMO)
Swenlin Trading Oscillators (STO-B and STO-V)

