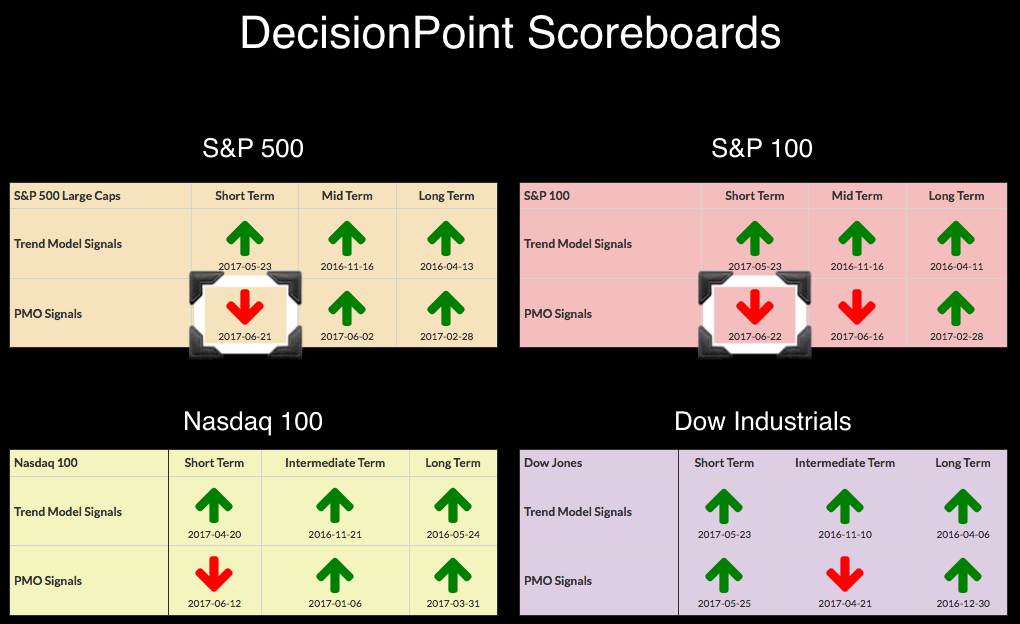
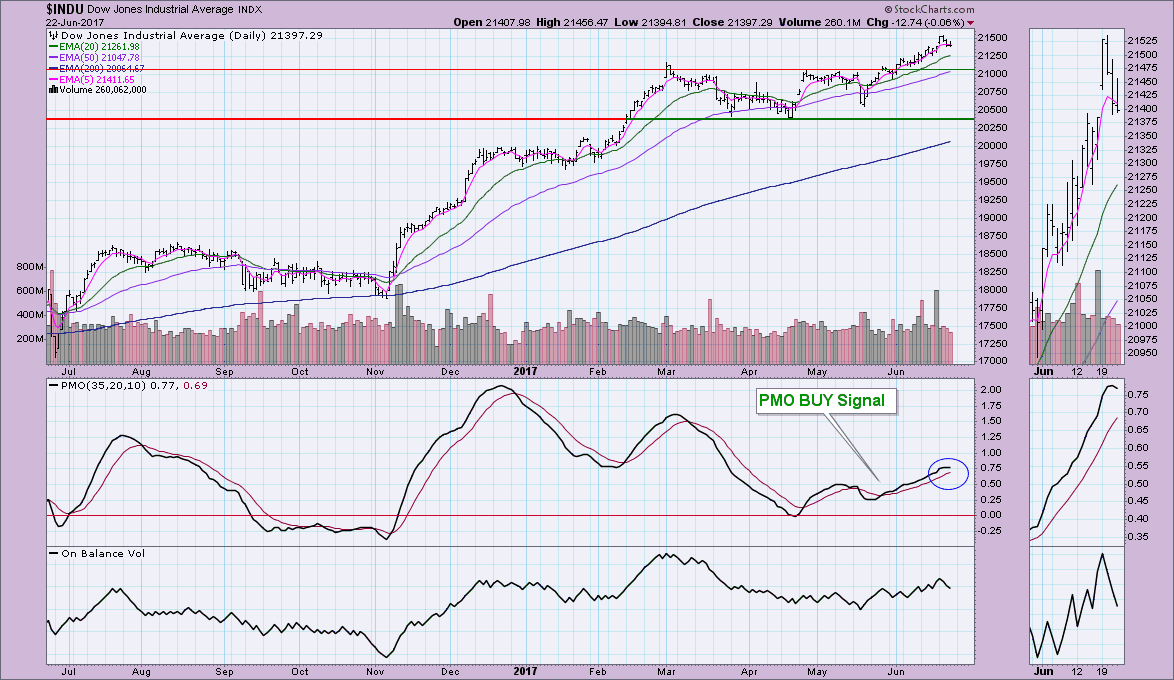
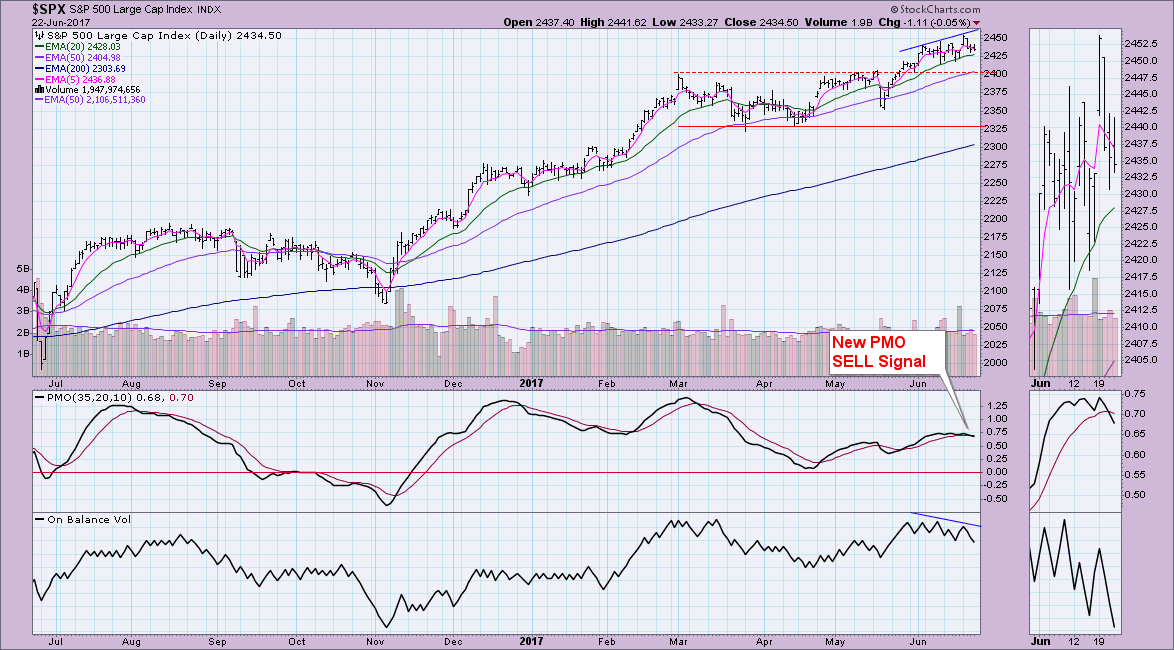
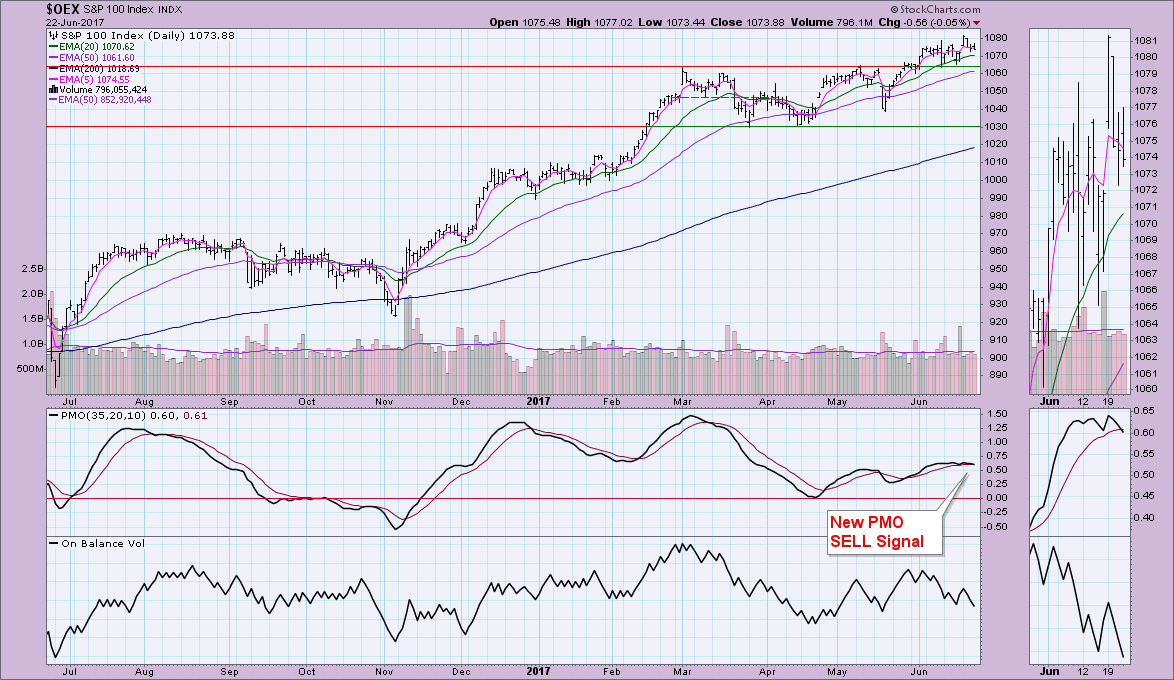
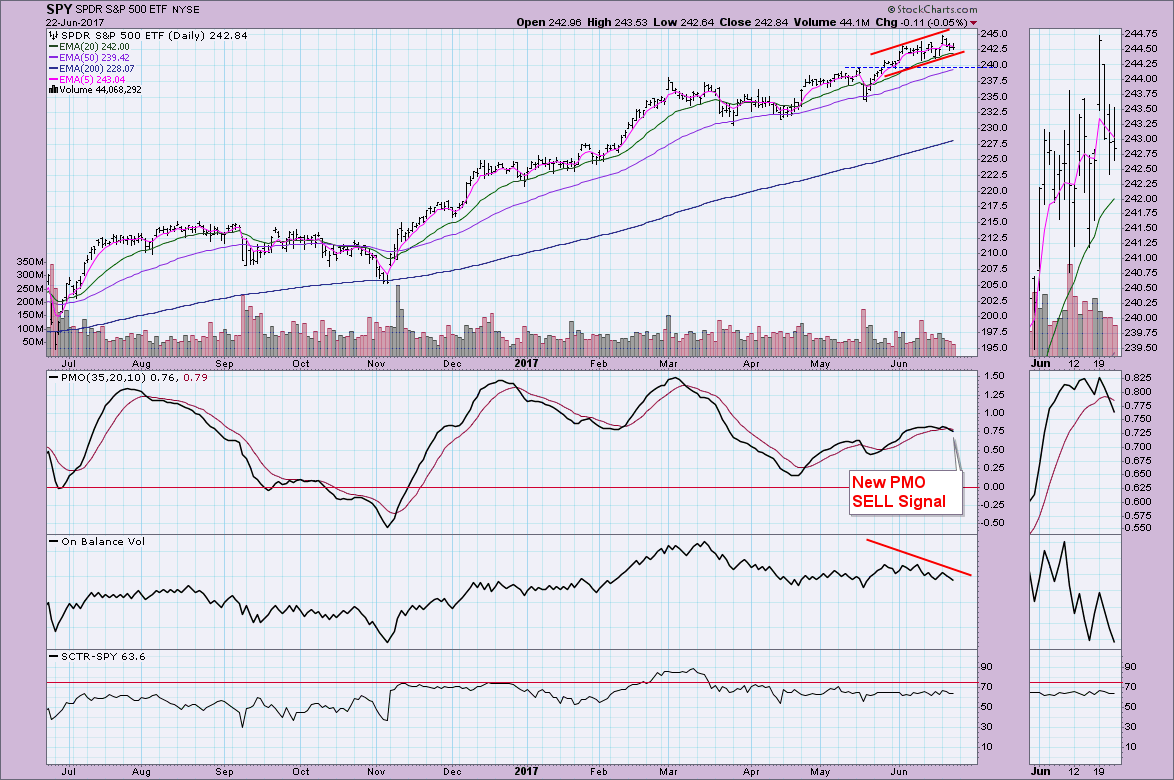
 The S&P 500 triggered a new PMO SELL signal yesterday at the close. Today, the S&P 100 joined in with its own PMO SELL signal. At this point, the Dow is the only one holding onto a PMO BUY signal, but a quick peek at the chart and we can see the PMO has topped and is heading down.
The purpose of the DecisionPoint Alert Daily Update is to quickly review the day's action, internal condition, and Trend Model status of the broad market (S&P 500), the nine SPDR Sectors, the U.S. Dollar, Gold, Crude Oil, and Bonds. To ensure that using this daily reference will be quick and painless, we are as brief as possible, and sometimes we let a chart speak for itself.
SIGNALS: Here we include charts of any important signal changes triggered today by our Intermediate-Term Trend Model.
NO NEW SIGNALS TO REPORT.
NOTE: Mechanical trading model signals define the implied bias of the price index based upon moving average relationships, but they do not necessarily call for a specific action. They are information flags that should prompt chart review. Further, they do not call for continuous buying or selling during the life of the signal. For example, a BUY signal will probably return the best results if action is taken soon after the signal is generated. Additional opportunities for buying may be found as price zigzags higher, but the trader must look for optimum entry points. Conversely, exit points to preserve gains (or minimize losses) may be evident before the model mechanically closes the signal.
STOCKS
IT Trend Model: BUY as of 11/15/2016
LT Trend Model: BUY as of 4/1/2016
The declining trend channel looked as if it would stay intact this morning, but price did rally enough to breakout. Unfortunately, by the end of the day, it was back in negative territory, making a move down toward the declining tops line that formed the top of the channel.
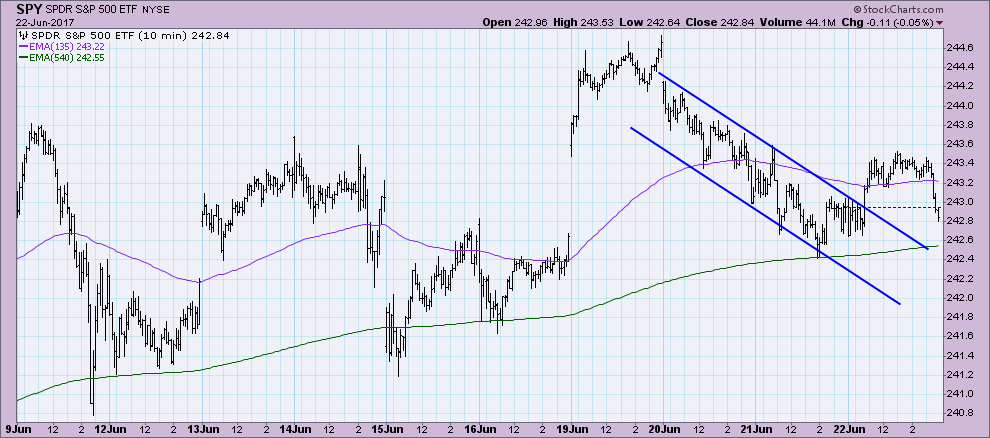
I've annotated the new PMO SELL signal. Note also that we have a clear negative divergence between the OBV and price tops. The SCTR remains healthy which is why I am looking for more sideways movement or even possibly a pullback of some sort. The SCTR tells us that there is still internal and relative strength within the SPY so I'm not looking for a correction past $240.
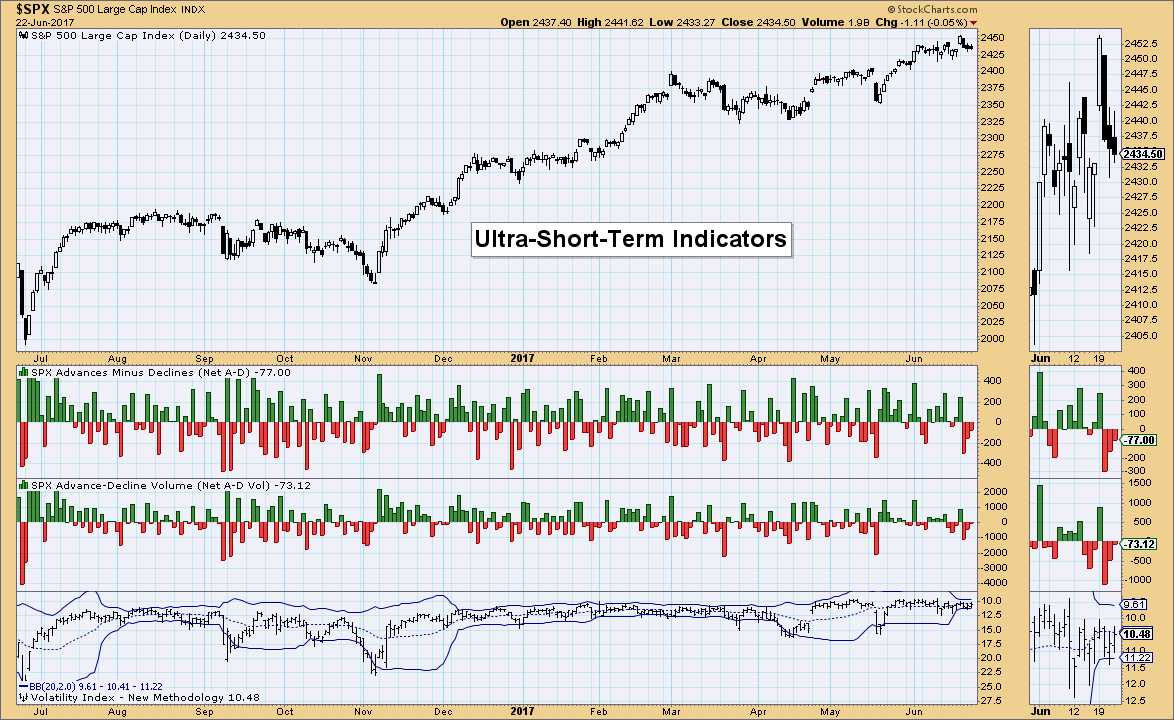
Ultra-Short-Term Indicators: Not much to say here except to note that negative breadth is declining as price moves lower. This is actually bullish for the next few days.
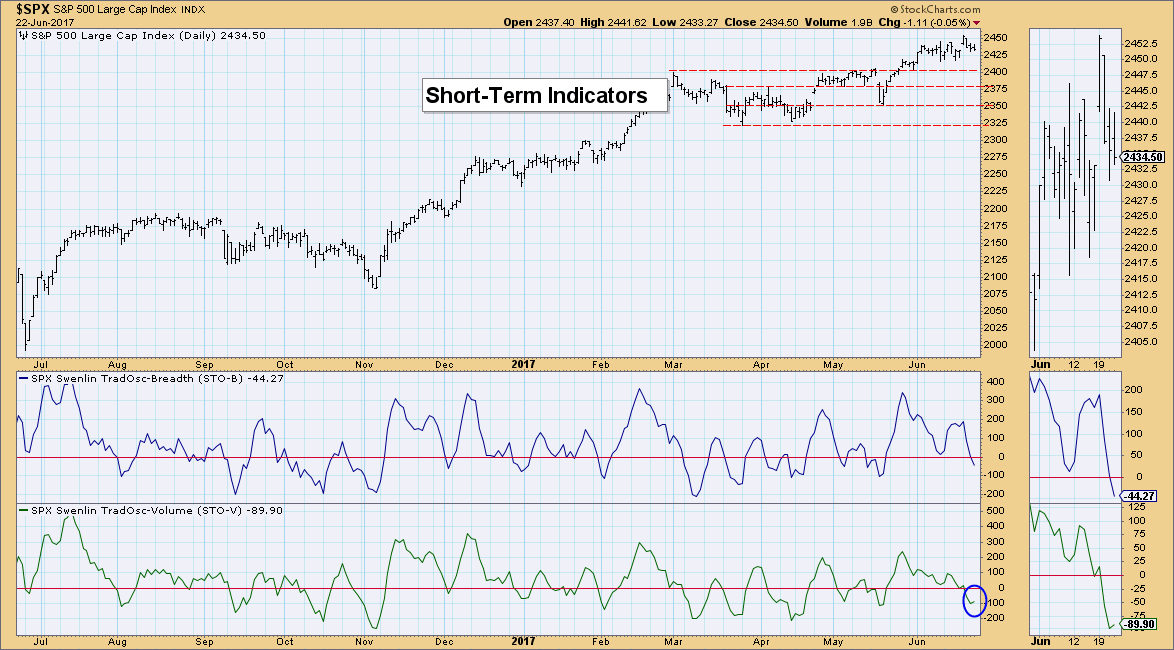
Short-Term Indicators: Good news here is that the STO-V has turned up. It's only tick up, so I'm not going to get really excited, but it is an improvement. These indicators are now in somewhat near-term oversold territory, so a turn back up here would still give us plenty of upside to support a rally. For now, they are in a declining trend and suggest more consolidation or some downside movement.
Intermediate-Term Indicators: These indicators have the bastion of hope for a continued rally higher, but they have topped and are negative in my opinion. I've held off judgement, but two negative crossovers are hard to ignore. Realizing that the market is still relatively strong, I'm not expecting a serious decline just yet. Remember the short-term indicators are thinking about getting bullish.
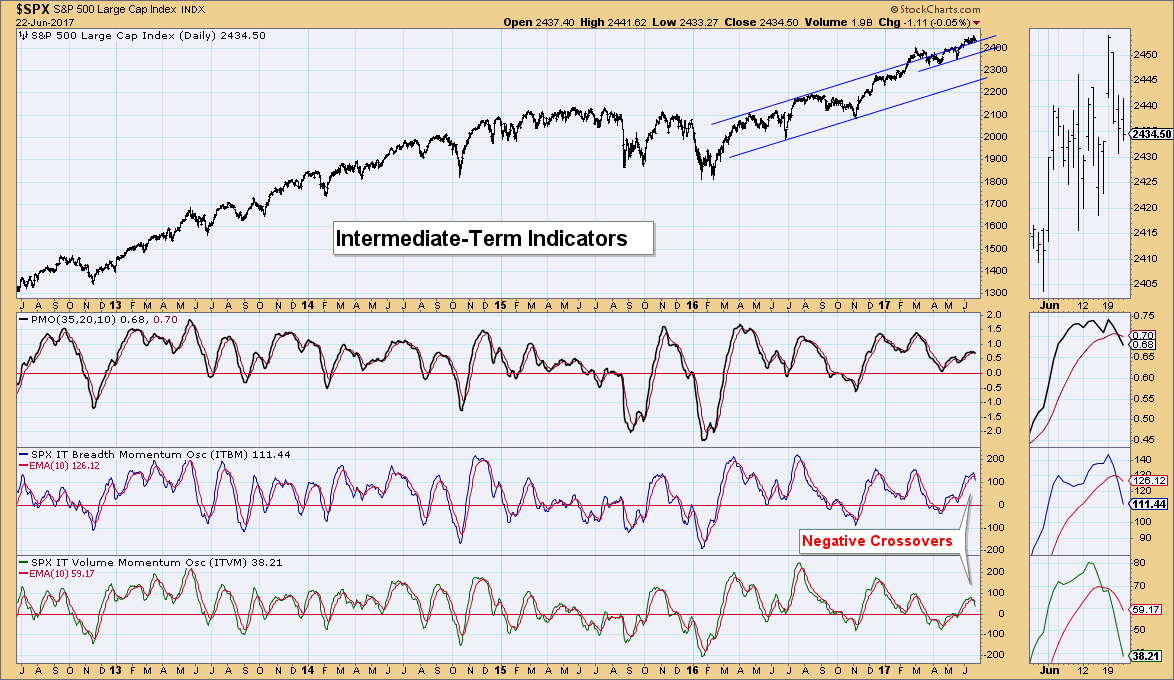
Conclusion: Indicators are somewhat mixed. Breadth seems to suggest this decline is ready to subside already and short-term indicators are considering bottoming in somewhat oversold territory. However, the intermediate term is a concern. If the market would cool, I would be looking for a correction, but it simply has not. It will pullback somewhat and travel sideways and that, has helped indicators unwind back to oversold territory. So despite bearish intermediate-term indicators, I am still not yet looking for a serious correction. A pullback and some consolidation around $240 for the SPY seems about right.
DOLLAR
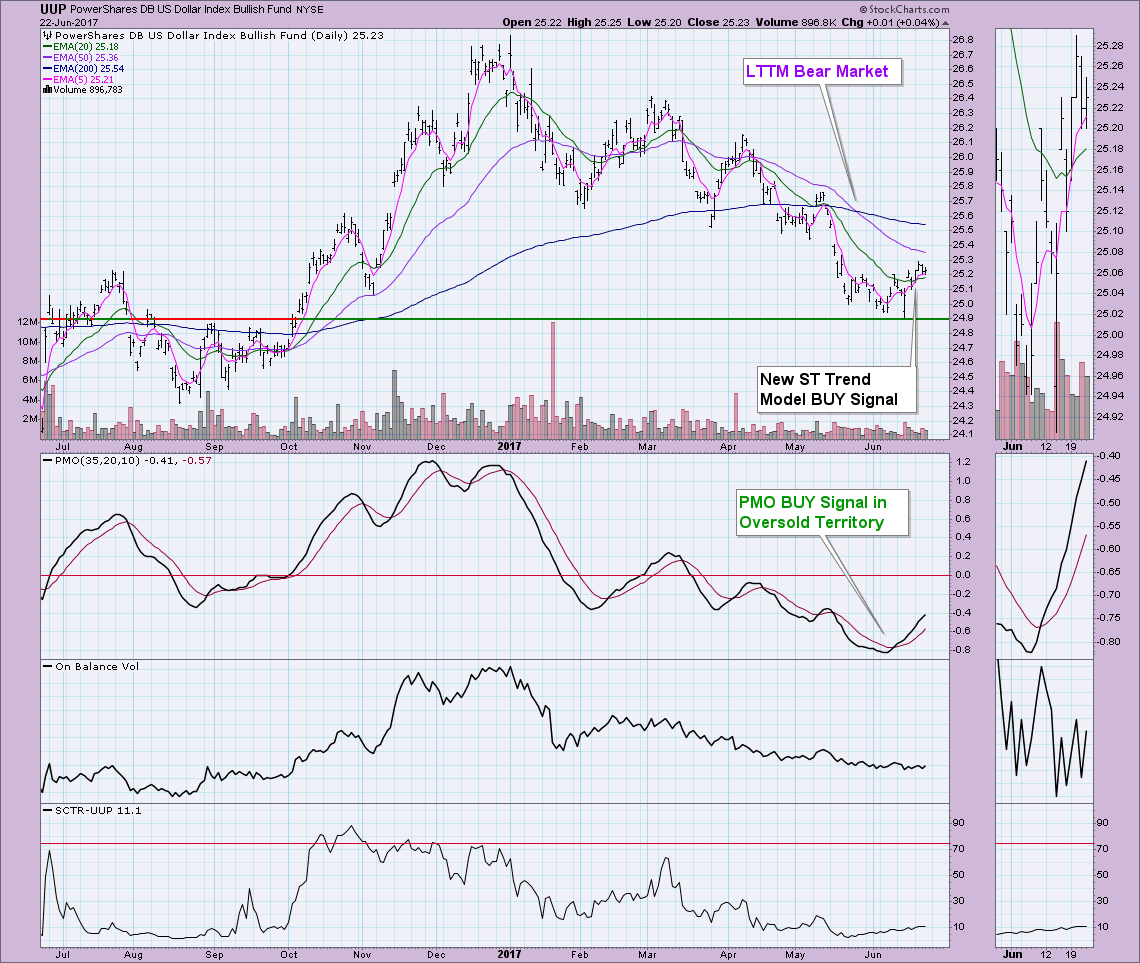
IT Trend Model: NEUTRAL as of 3/21/2016
LT Trend Model: BUY as of 10/17/2016
UUP is slowly rallying off support at $24.90. The PMO is rising strongly and the SCTR is in a very slow rising trend. Volume needs to start getting that OBV to rise. In the meantime, a slow crawl higher seems the plan. The 50-EMA is the first area of overhead resistance UUP would face.
GOLD
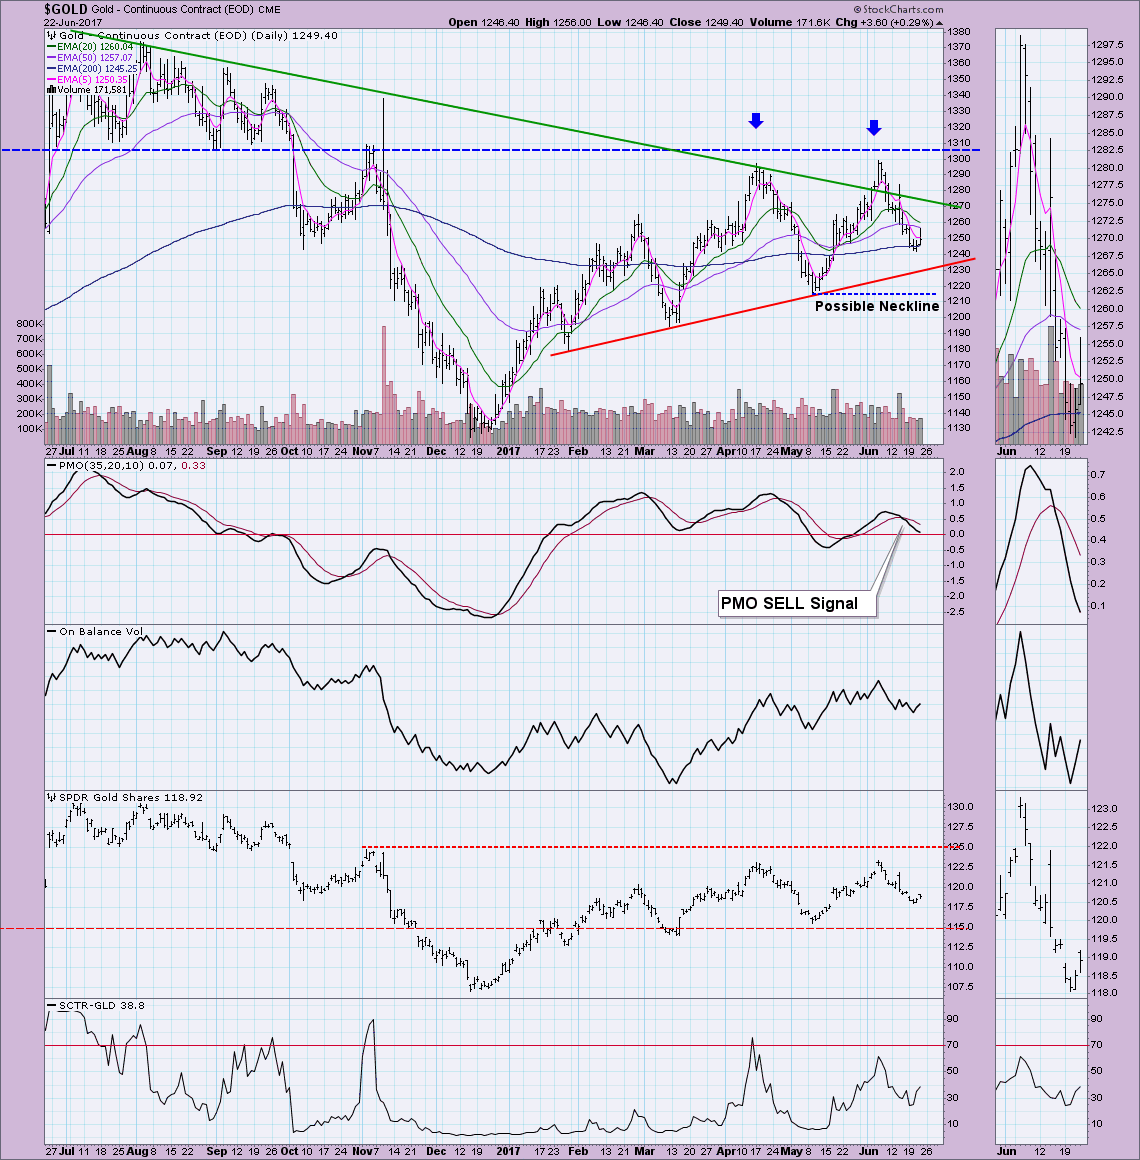
IT Trend Model: BUY as of 5/22/2017
LT Trend Model: BUY as of 4/12/2017
After a steady decline, Gold rallied somewhat today. It's not enough to erase the declining trend, but it could save Gold from a LT Trend Model SELL signal. With price above the 200-EMA a negative 50/200-EMA crossover isn't possible. Unfortunately with indicators looking so negative, I do expect this decline to continue to at least the rising bottoms trendline, but I think a drop to test the double-top neckline is highly likely.
CRUDE OIL (USO)
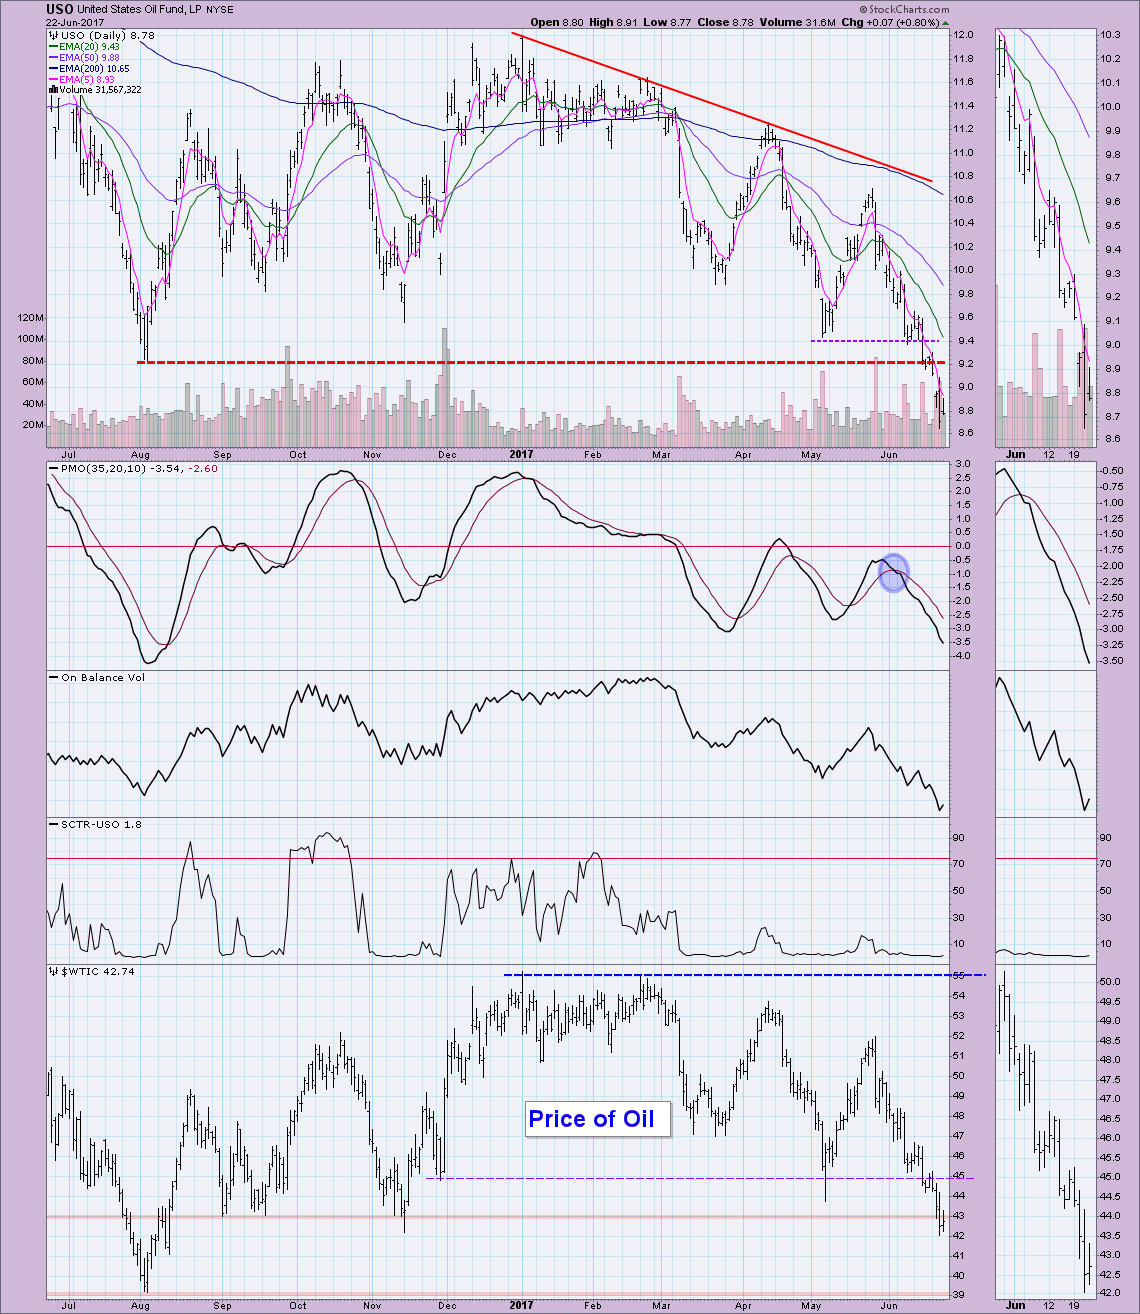
IT Trend Model: NEUTRAL as of 3/8/2017
LT Trend Model: SELL as of 3/9/2017
Everyone has been waiting for a bottom on USO to get in, but indicators have never wavered in their bearishness. Oil may have found a bottom at $43/barrel, but with supply so high, there is a real possibility Oil will end up testing support at $39. This is like trying to catch not a "falling knife" but a "falling ax" when comes to USO as the declines have been especially painful on a vehicle that trades below $12/share. I don't think the bottom is here just yet.
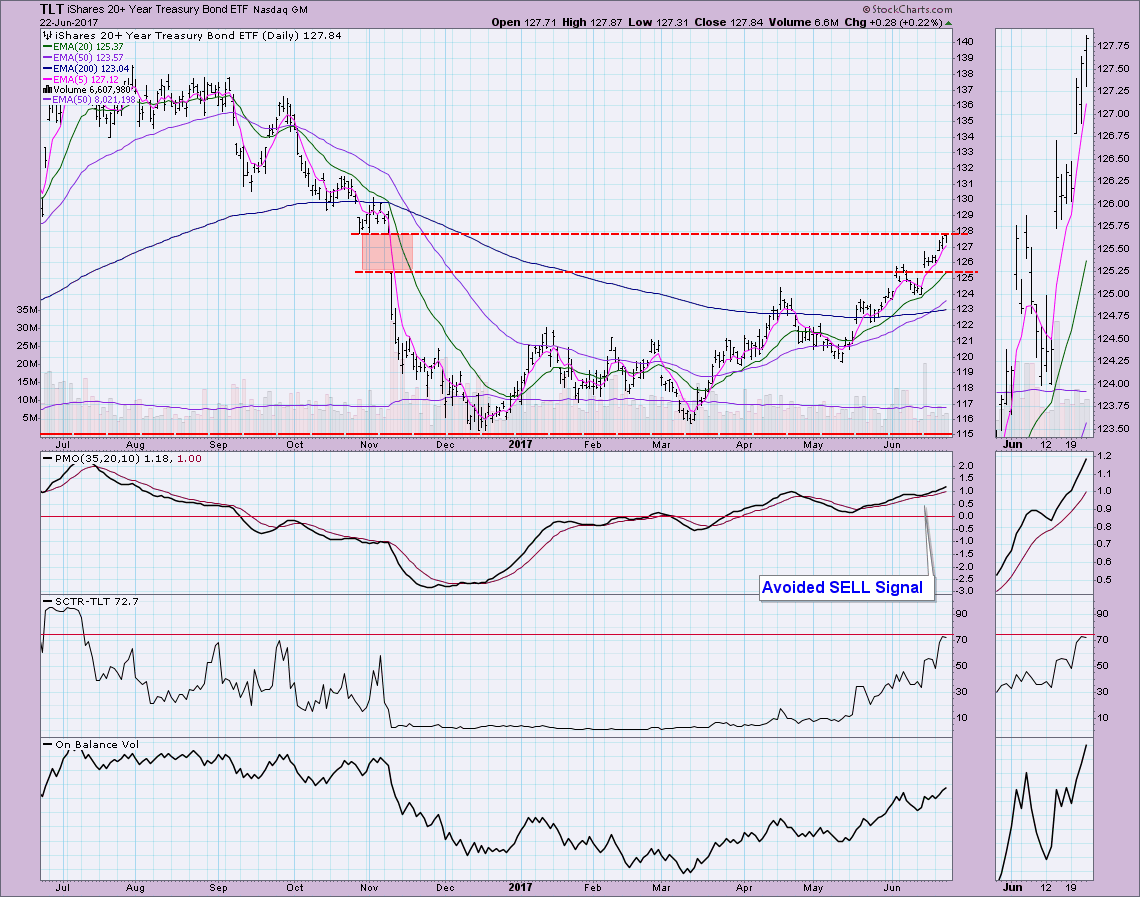
BONDS (TLT)
IT Trend Model: BUY as of 3/31/2017
LT Trend Model: BUY as of 6/16/2017
TLT finally is closing the gap at the $128 level. Indicators are all bullish and with the gap closing, it suggests higher prices. The curiosity will be how well it is able to rally with the Fed raising interest rates and the likely rise in yields. Not taking any of that into account, the indicators look fantastic and the closing of the gap with a breakout would be very bullish.
Helpful DecisionPoint Links:
DecisionPoint Shared ChartList and DecisionPoint Chart Gallery
Price Momentum Oscillator (PMO)
Swenlin Trading Oscillators (STO-B and STO-V)
Technical Analysis is a windsock, not a crystal ball.
Happy Charting!
- Erin
**Don't miss DecisionPoint Commentary! Add your email below to be notified of new updates"**


