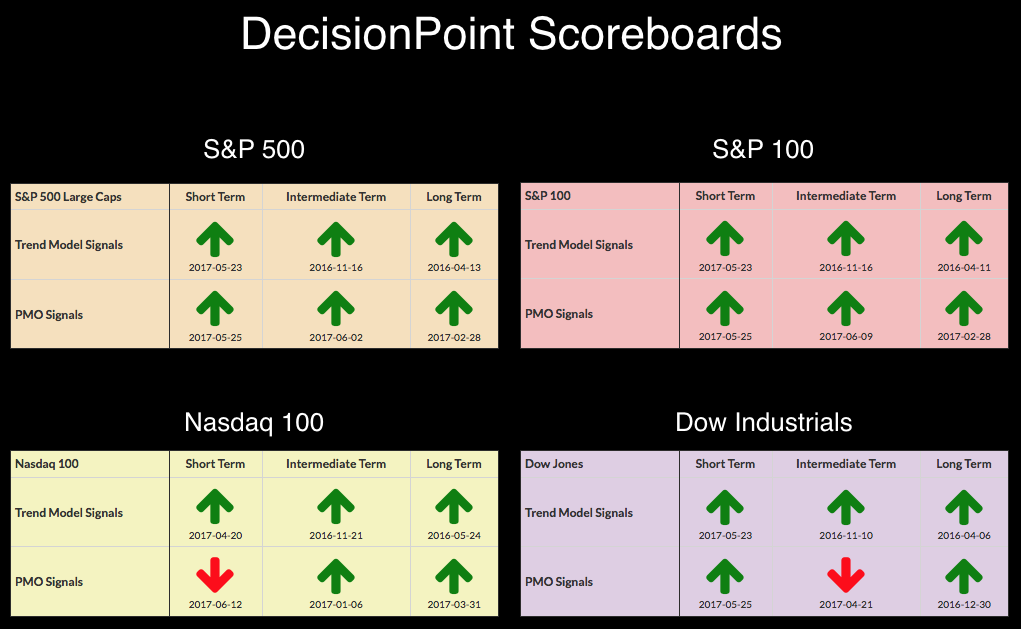
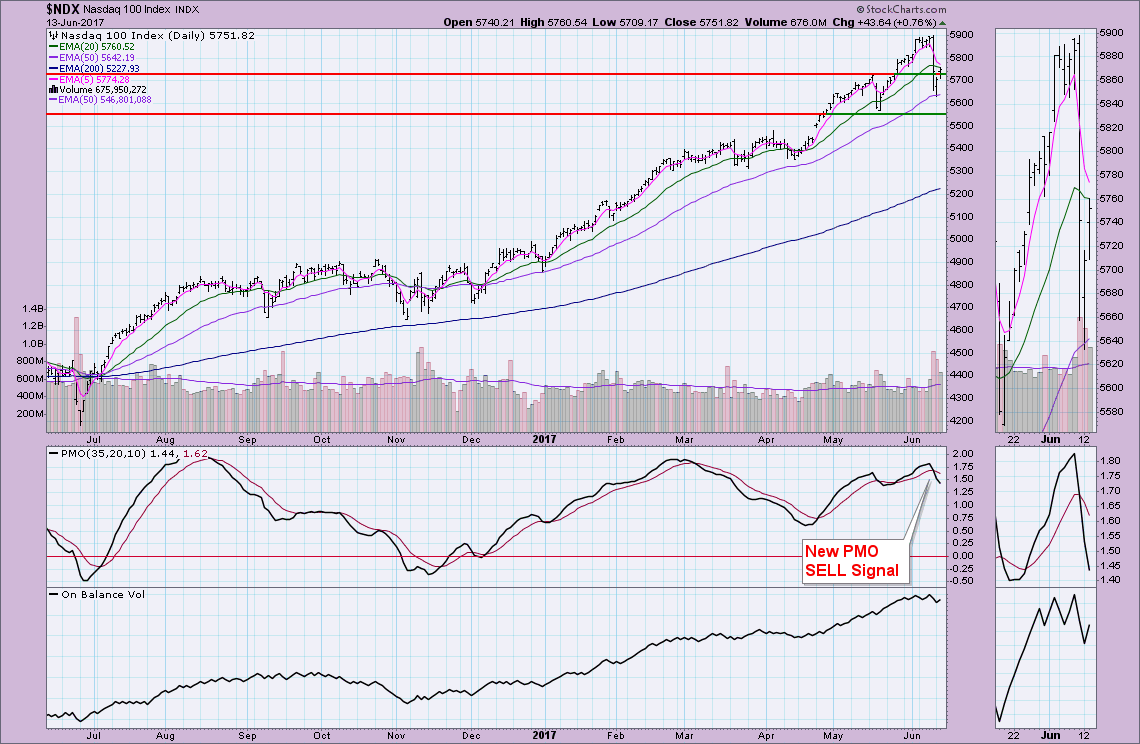
 Yesterday saw the addition of a PMO SELL signal in the short term (daily chart) for the Nasdaq 100. Interestingly, if you look at the other three, their PMOs have turned up today. Despite a slowing market, Gold has struggled since its unsuccessful test of overhead resistance and now Bonds have stalled. Meanwhile, the Dollar has bounced off support and appears headed for a bull market.
The purpose of the DecisionPoint Alert Daily Update is to quickly review the day's action, internal condition, and Trend Model status of the broad market (S&P 500), the nine SPDR Sectors, the U.S. Dollar, Gold, Crude Oil, and Bonds. To ensure that using this daily reference will be quick and painless, we are as brief as possible, and sometimes we let a chart speak for itself.
SIGNALS: Here we include charts of any important signal changes triggered today by our Intermediate-Term Trend Model.
NO NEW SIGNAL CHANGES.
NOTE: Mechanical trading model signals define the implied bias of the price index based upon moving average relationships, but they do not necessarily call for a specific action. They are information flags that should prompt chart review. Further, they do not call for continuous buying or selling during the life of the signal. For example, a BUY signal will probably return the best results if action is taken soon after the signal is generated. Additional opportunities for buying may be found as price zigzags higher, but the trader must look for optimum entry points. Conversely, exit points to preserve gains (or minimize losses) may be evident before the model mechanically closes the signal.
STOCKS
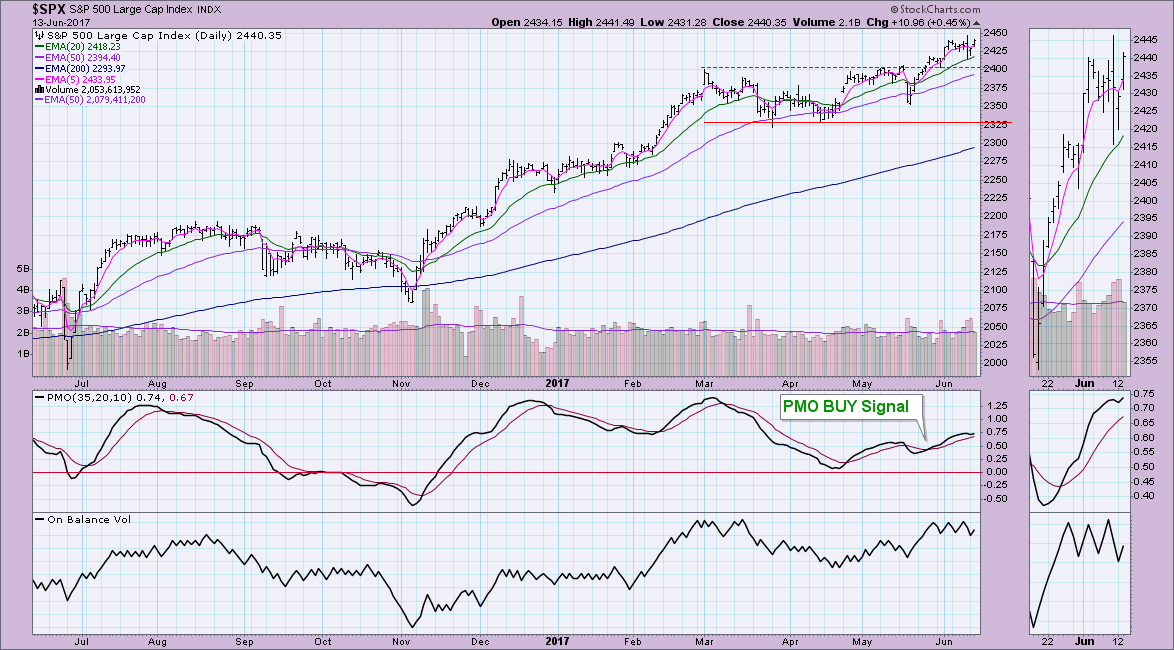
IT Trend Model: BUY as of 11/15/2016
LT Trend Model: BUY as of 4/1/2016
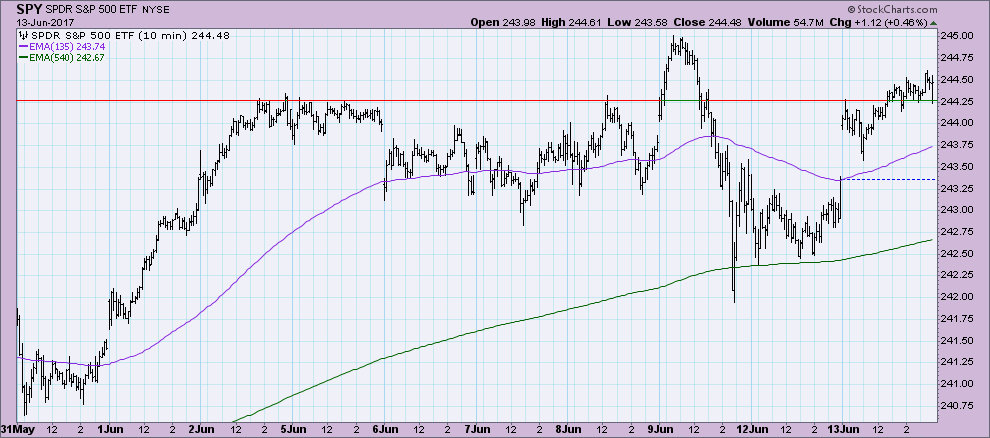
The 10-minute bar chart shows that price did manage to hurdle previous highs, the question will be if it can maintain above that support level and soon test last week's high.
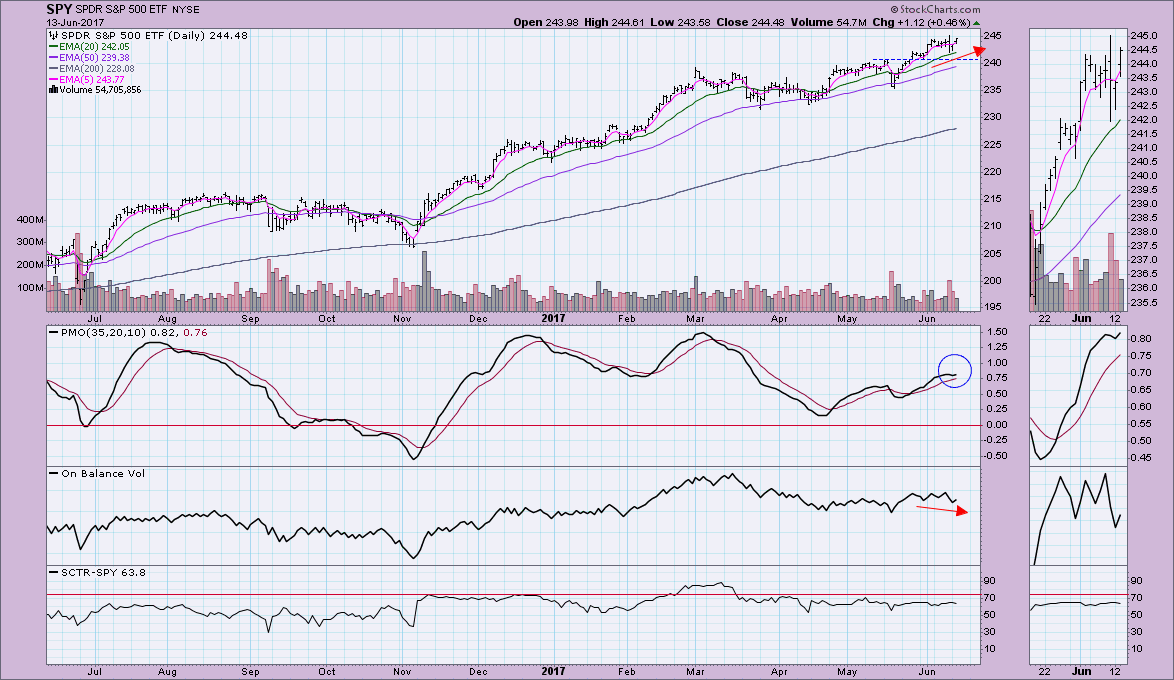
Momentum had slipped, but it has turned positive quickly. The only concern I have with this chart is the negative divergence between OBV bottoms and price bottoms. I think this supports my hypothesis of a pullback to test the $240 level for the SPY.
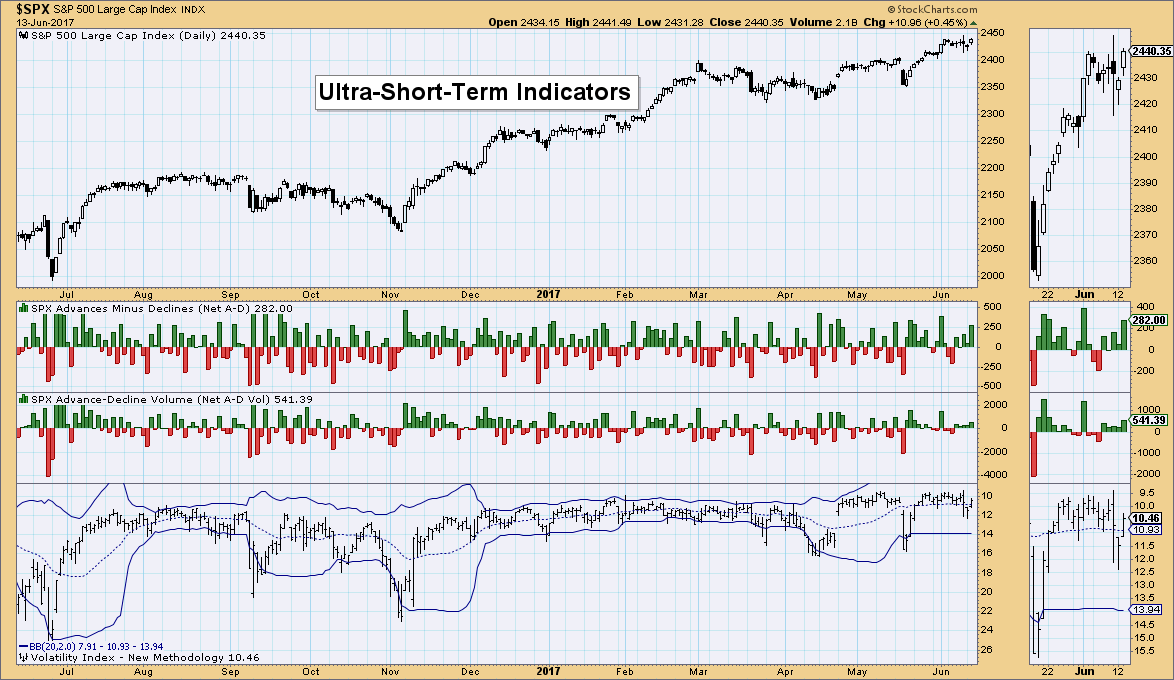
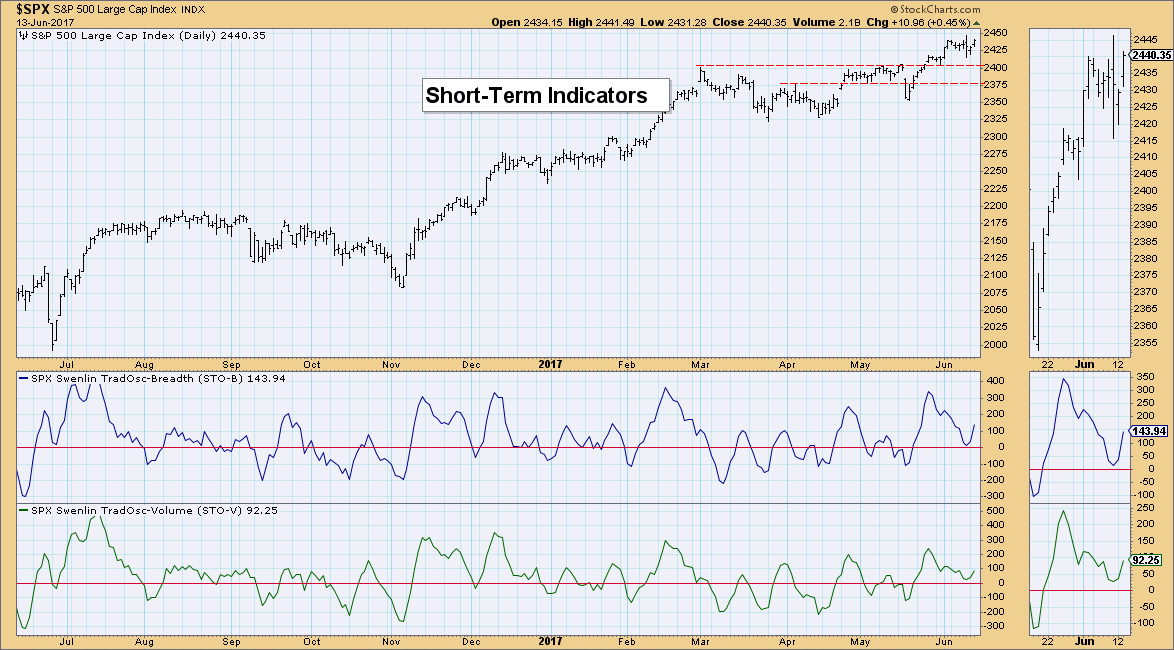
Ultra-Short-Term Indicators: Nothing interesting here. The VIX dipped below the BB average, but it appears we will start to see similar behavior to early 2017 as the Bollinger Bands begin to squeeze. Market makers don't seem concerned about a correction or pullback at this time given the readings are swimming in the 10-11 level.
Short-Term Indicators: These indicators are rising after bouncing off the zero line. Oscillation above the zero line is generally a sure sign of internal strength in the SPX.
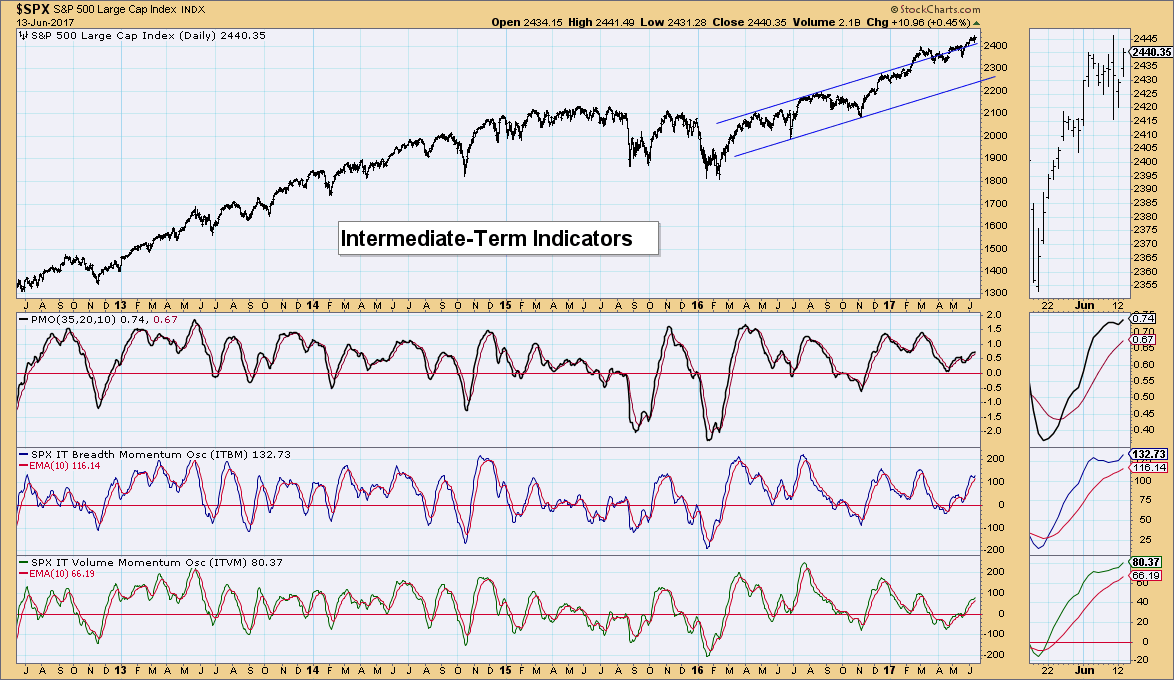
Intermediate-Term Indicators: After decelerating, both the ITBM and ITVM are rising again. I like this for the intermediate term. They aren't overbought yet and suggest a correction isn't on its way just yet.
Conclusion: Indicators are bullish, but I do think the market could use a pullback to the $240 level on the SPY. Short-term indicators don't seem to think a decline is needed nor does the VIX. With the internal strength the market continues to display, a pullback or correction seems less likely since consolidation and sideways moves seem to suffice.
DOLLAR
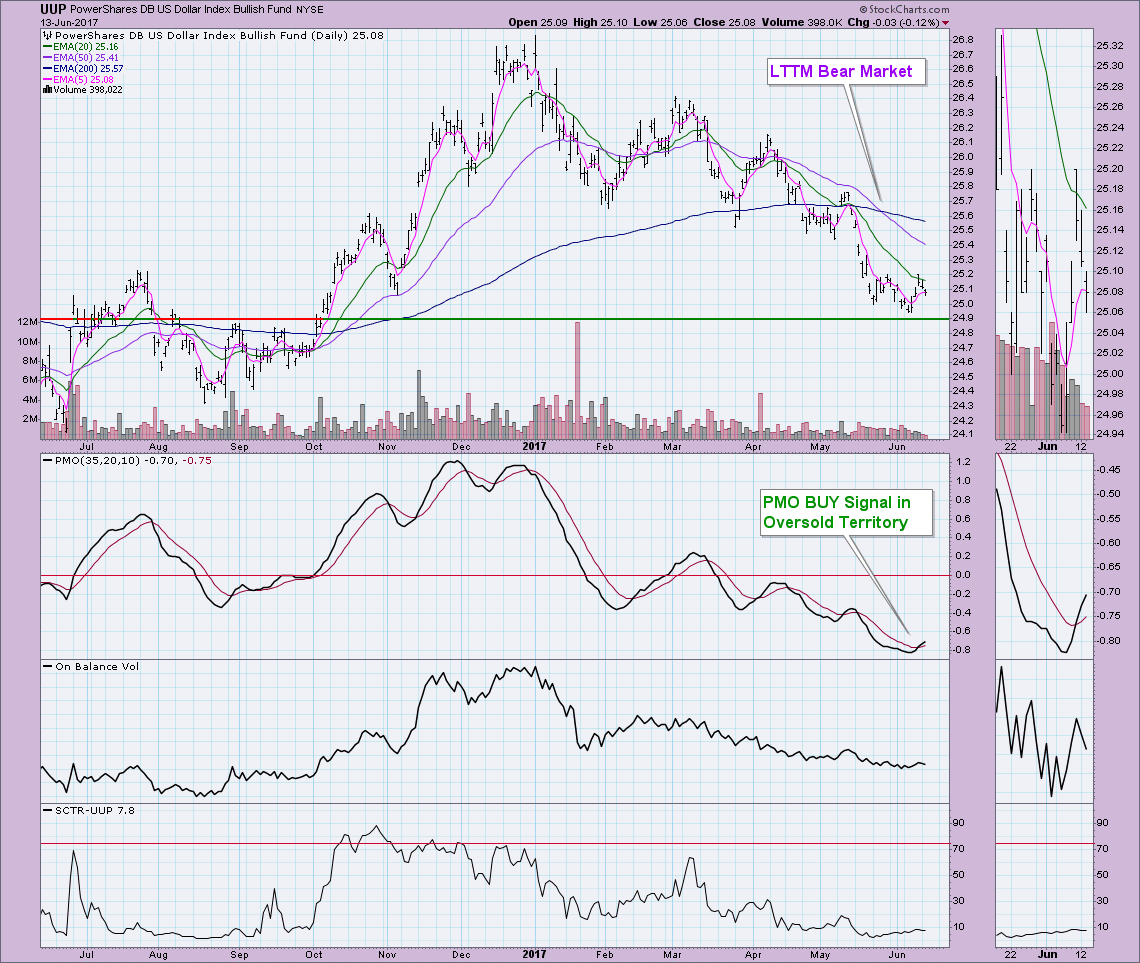
IT Trend Model: NEUTRAL as of 3/21/2016
LT Trend Model: BUY as of 10/17/2016
The PMO just triggered a new BUY signal in oversold territory. Although price seems to have pulled back this week, that crossover BUY signal suggests this bounce off support should stand. The OBV and SCTR don't have much to say right now, but I don't see them as bearish either. I'm looking for a rally to test around $25.60.
GOLD
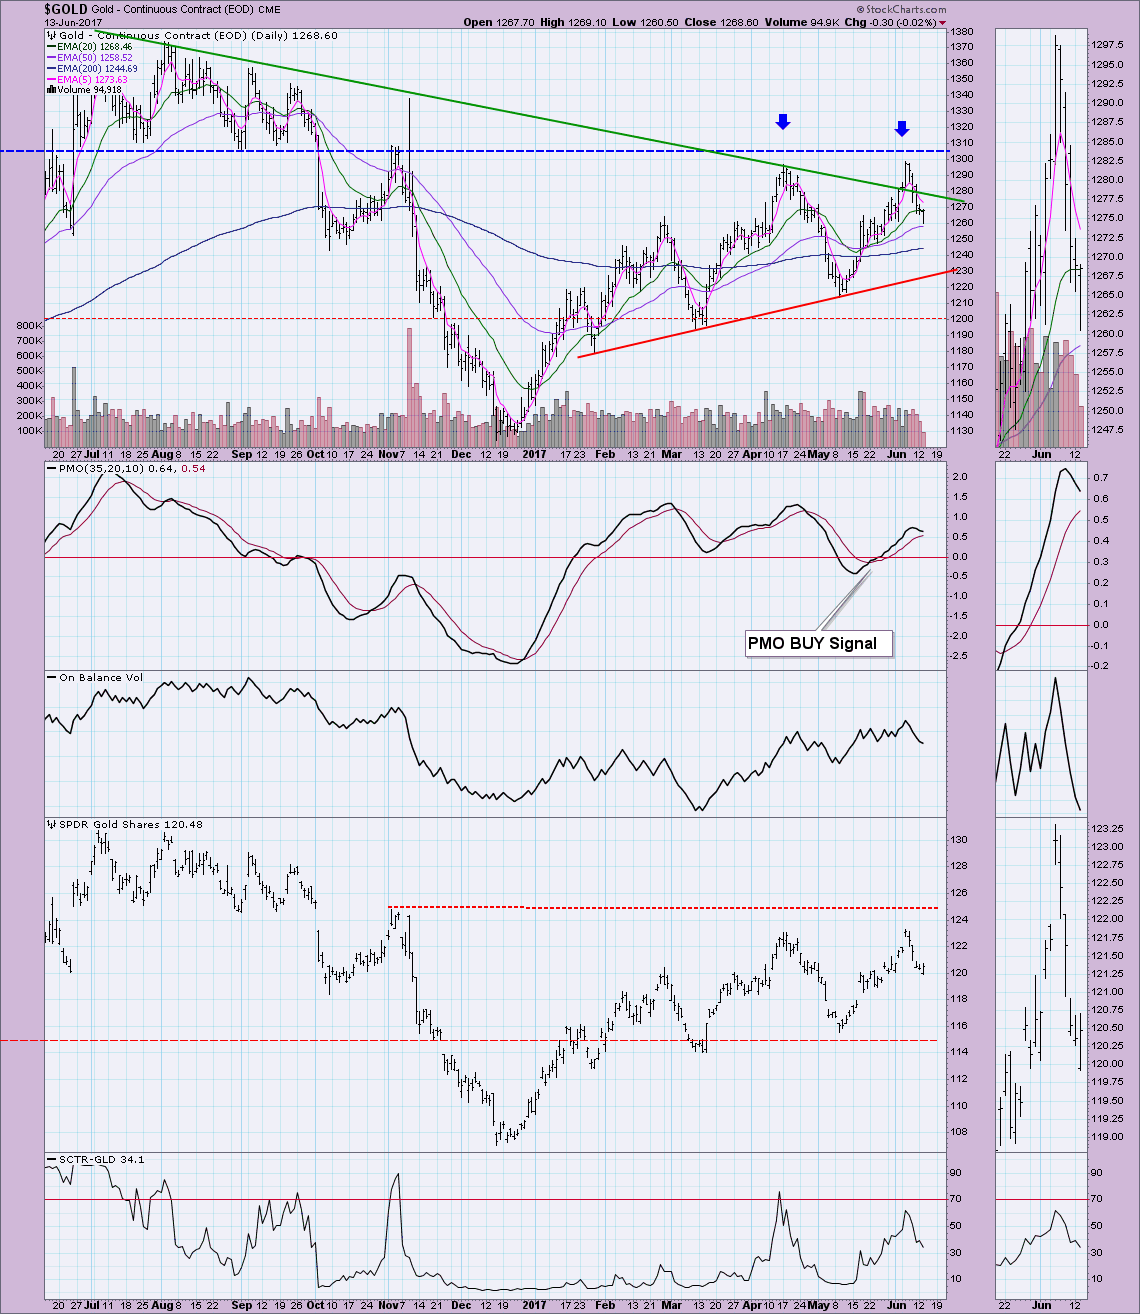
IT Trend Model: BUY as of 5/22/2017
LT Trend Model: BUY as of 4/12/2017
Big news that very long-term declining tops line resistance was broken, but the biggest hurdle was going to be the $1300 price level and that resistance held pretty easily. The PMO has topped and you could certainly make a case for bearish double-top. I suspect rising bottoms support will hold.
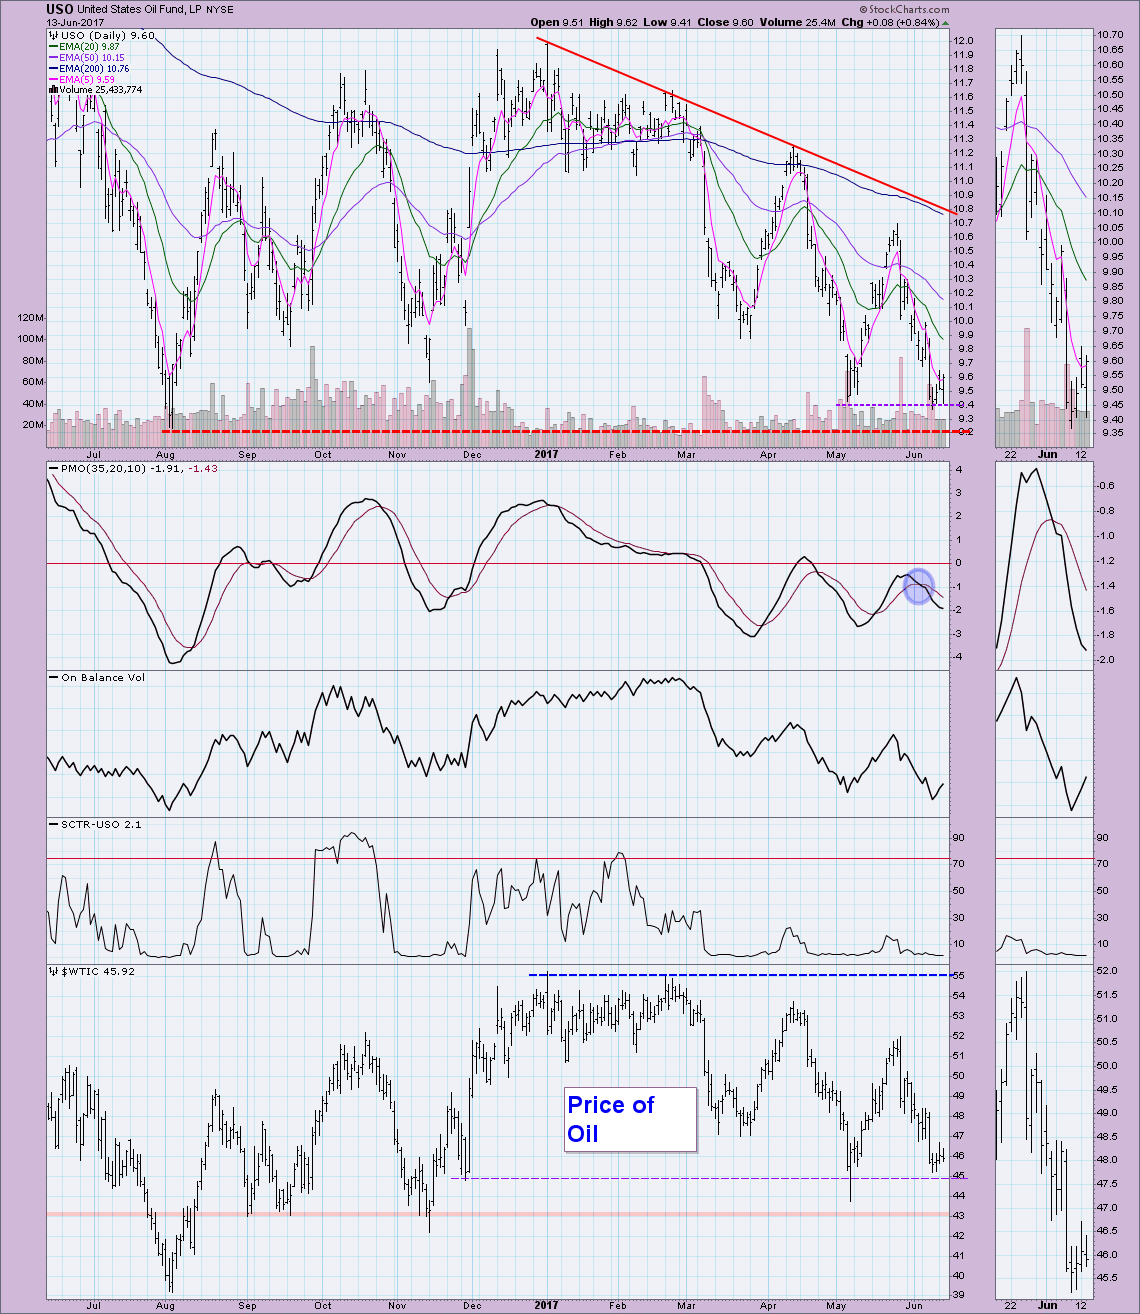
CRUDE OIL (USO)
IT Trend Model: NEUTRAL as of 3/8/2017
LT Trend Model: SELL as of 3/9/2017
Oil is trying very hard to establish a strong foundation for a rally. Support resides at $45/barrel for Oil and $9.40 for USO. The PMO wants to bottom, but it hasn't happened yet. Oil is in a bear market and the best way to proceed is to remember that in a bear market, we should have bearish expectations before bullish ones.
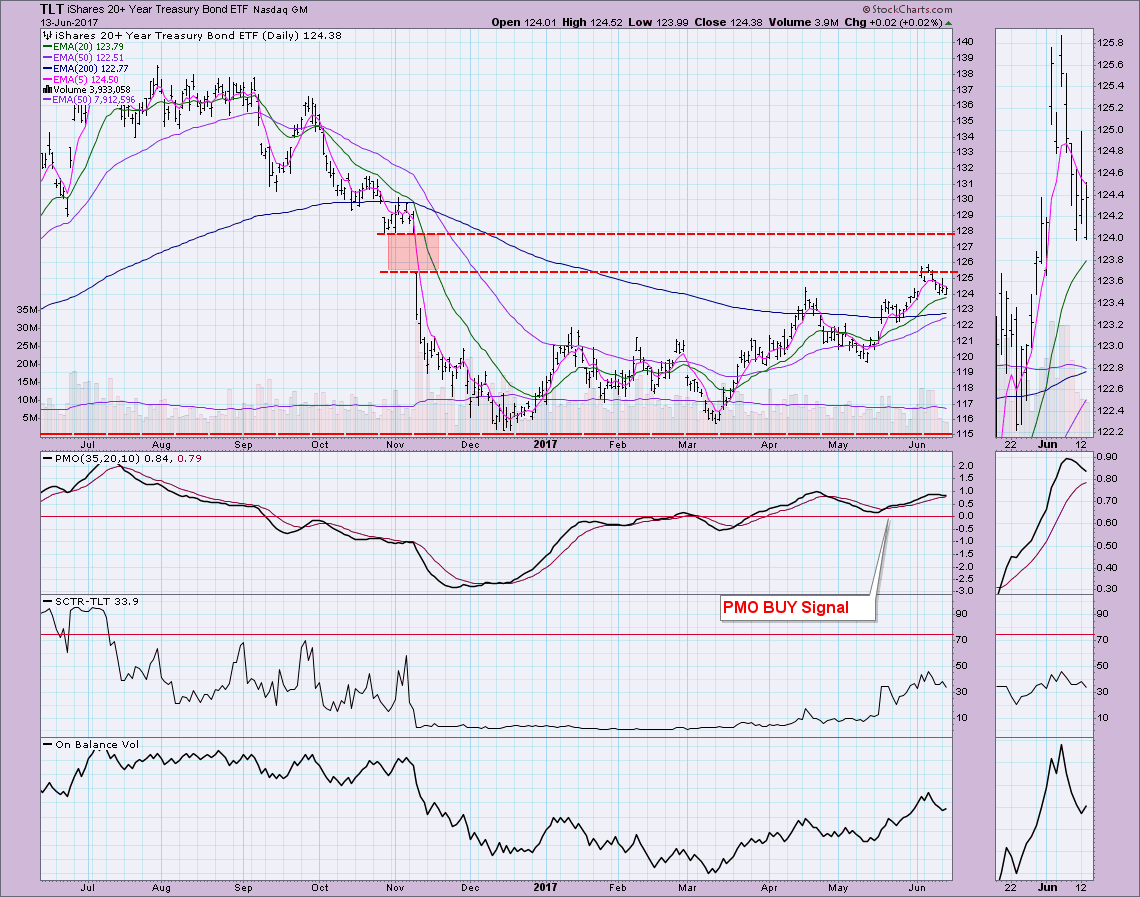
BONDS (TLT)
IT Trend Model: BUY as of 3/31/2017
LT Trend Model: SELL as of 11/17/2016
TLT hit overhead resistance at the November 2016 gap and was turned away. My expectation has been a test at $128. It's still possible, but given the PMO top and slowly declining SCTR, it's plausible, but less likely. I reserve the right to change this analysis if the 50-EMA can push past the 200-EMA. That would put TLT in a bull market configuration. For now, I would look for a pullback to test the 50-EMA.
Helpful DecisionPoint Links:
DecisionPoint Shared ChartList and DecisionPoint Chart Gallery
Price Momentum Oscillator (PMO)
Swenlin Trading Oscillators (STO-B and STO-V)
Technical Analysis is a windsock, not a crystal ball.
Happy Charting!
- Erin
**Don't miss DecisionPoint Commentary! Add your email below to be notified of new updates"**


