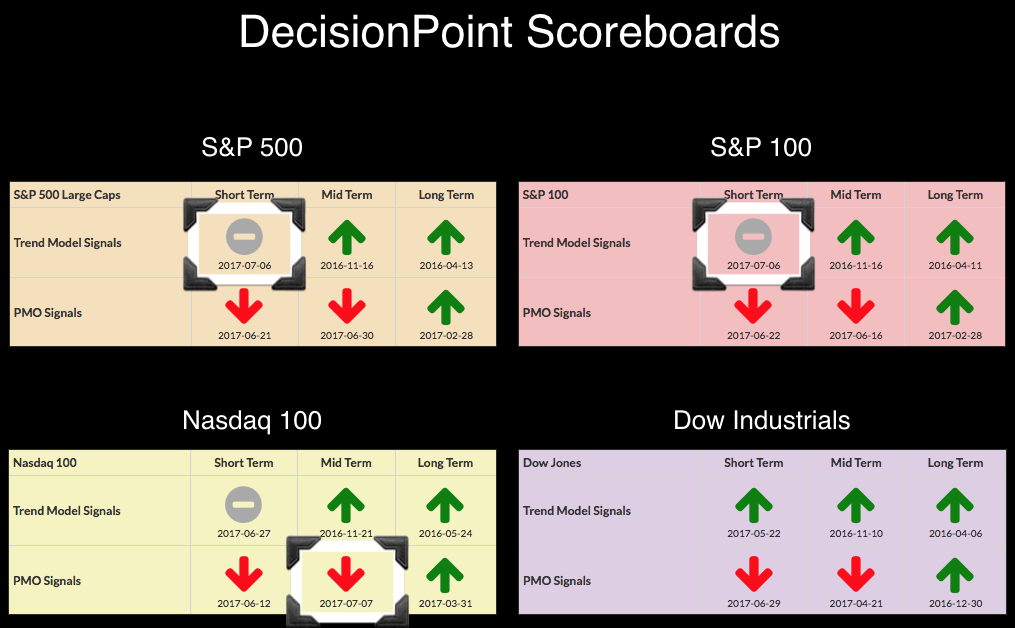
We have three new signals to report on the DecisionPoint Scoreboards and none of them are good. Momentum was already waning with PMO SELL signals coming in late June, but now we are seeing the destruction of upward price trends. Admittedly, the Short-Term Trend Model (STTM) is based on 5/20-EMA crossovers, so we will see a lot of whipsaw, especially if the market consolidates sideways. Interestingly, the NDX, which has been surging of late, posted a new Intermediate-Term PMO SELL signal. These signals are retrieved from the weekly chart and therefore, don't go "final" until trading on the last day of the week is finished.
Let's look at the NDX weekly chart first. While it was a good week for the NDX, it only finished up .17% this week. The top of the trend channel appears to be an opportunity for the NDX to find support, but I think the most important support level can be found at the gap support just under 5500. Granted, previous SELL signals haven't resulted in much more than consolidation of late, but weakness is beginning to permeate the markets.
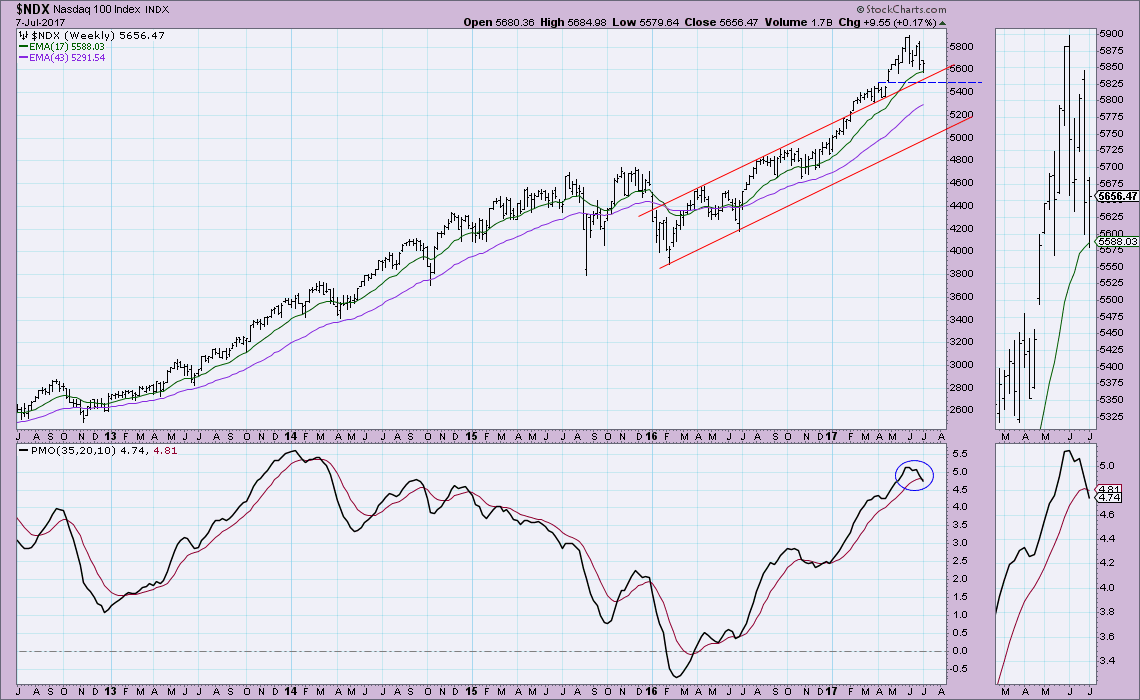
The 5-EMA ticked up today, but not enough to rid the STTM Neutral signal. One positive on the chart is the positive divergence between OBV bottoms and price bottoms. I think this means we will see a bounce off this support level, but I'm not looking for a serious rally that would puncture all time highs.
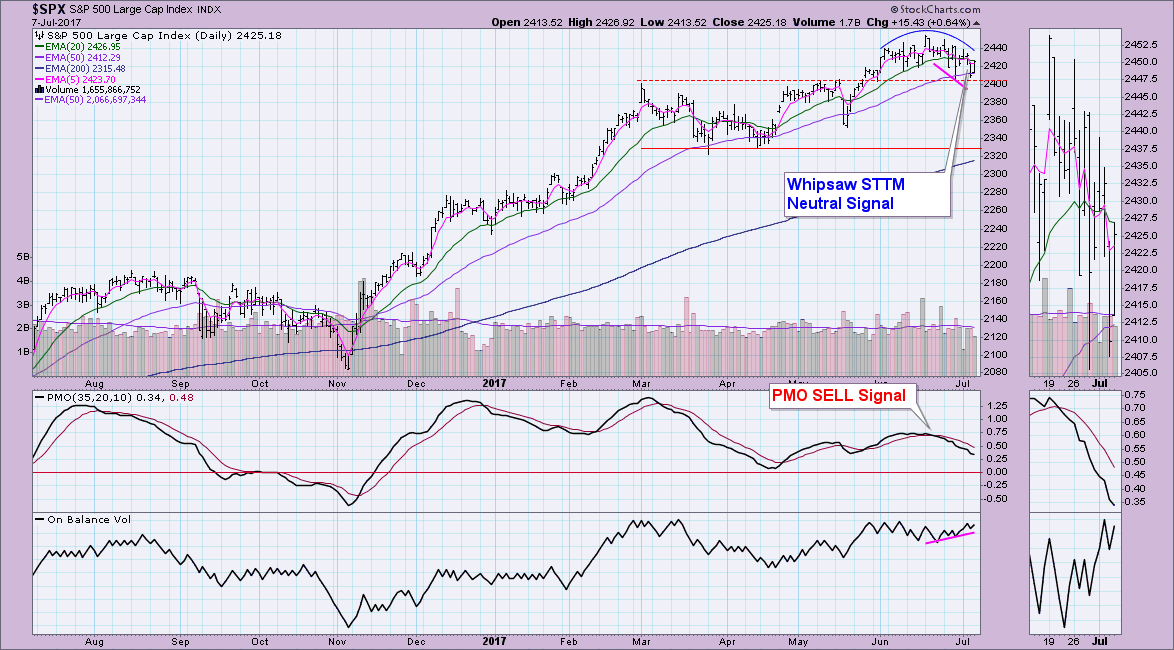
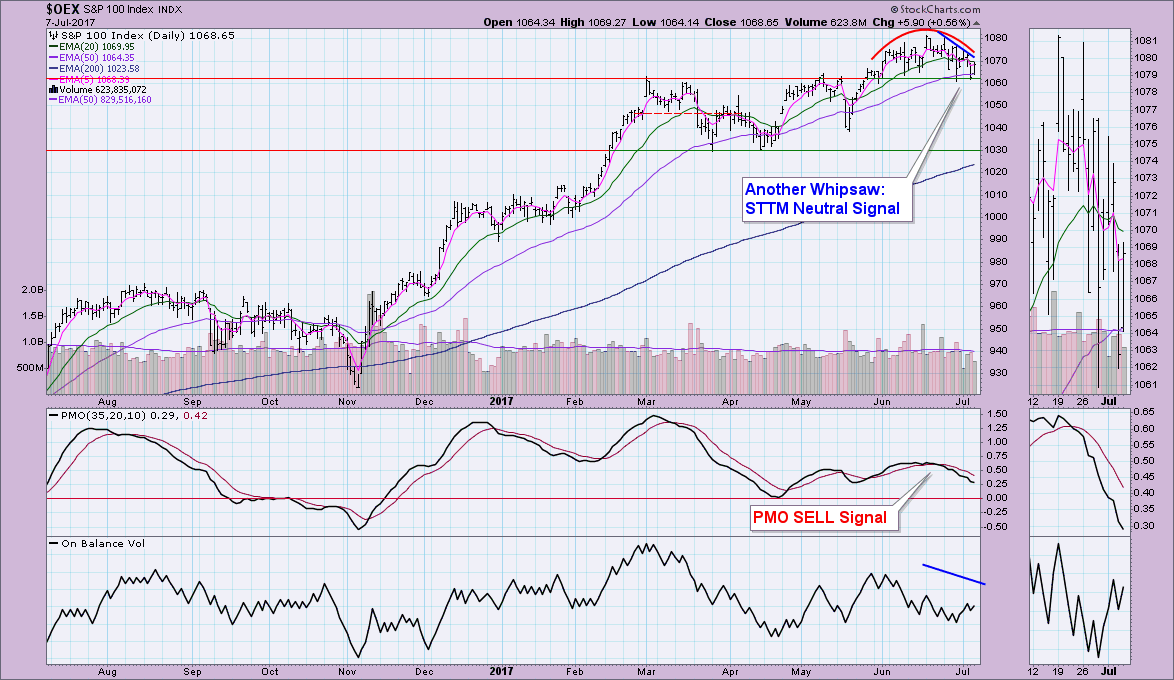
The 5-EMA also ticked up on the OEX, but unlike the SPX, there is a bearish confirmation set up with the OBV and price tops. The PMO continues to fall on both the SPX and OEX weekly charts with little or no deceleration. While we may see a bounce, I believe that strong support at about 1060 will not hold. This could mean a drop toward 1030, which is the next area of strong support.
Helpful DecisionPoint Links:
DecisionPoint Shared ChartList and DecisionPoint Chart Gallery
Price Momentum Oscillator (PMO)
Swenlin Trading Oscillators (STO-B and STO-V)
Technical Analysis is a windsock, not a crystal ball.
Happy Charting!
- Erin
**Don't miss DecisionPoint Commentary! Add your email below to be notified of new updates"**


