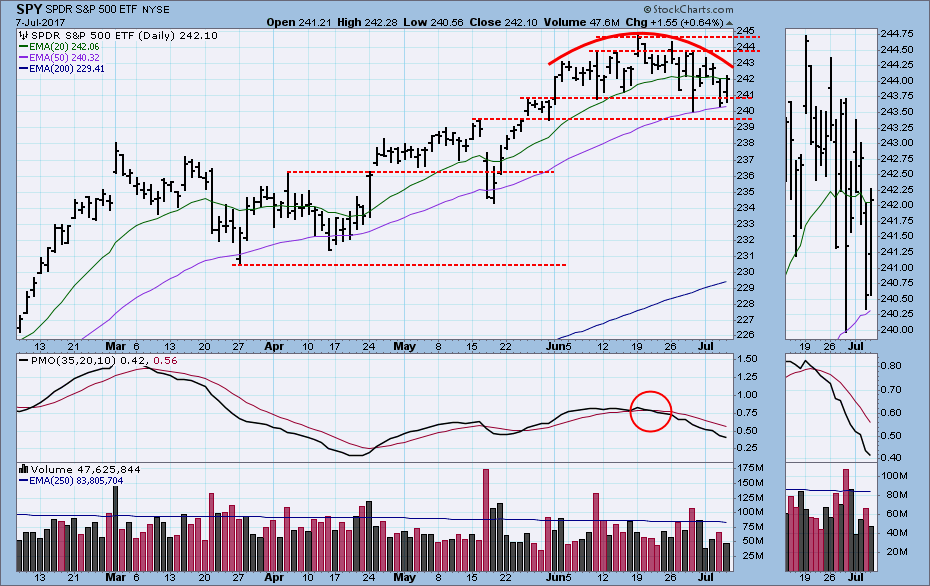
During a holiday week we don't expect much action, and this week was no exception. The market has been grinding away in a narrow range since the beginning of June, and a rounded top has formed. A rounded top is bearish, but in this persistent bull market it may just be a trick of the light.
The DecisionPoint Weekly Wrap presents an end-of-week assessment of the trend and condition of the stock market (S&P 500), the U.S. Dollar, Gold, Crude Oil, and Bonds.
STOCKS
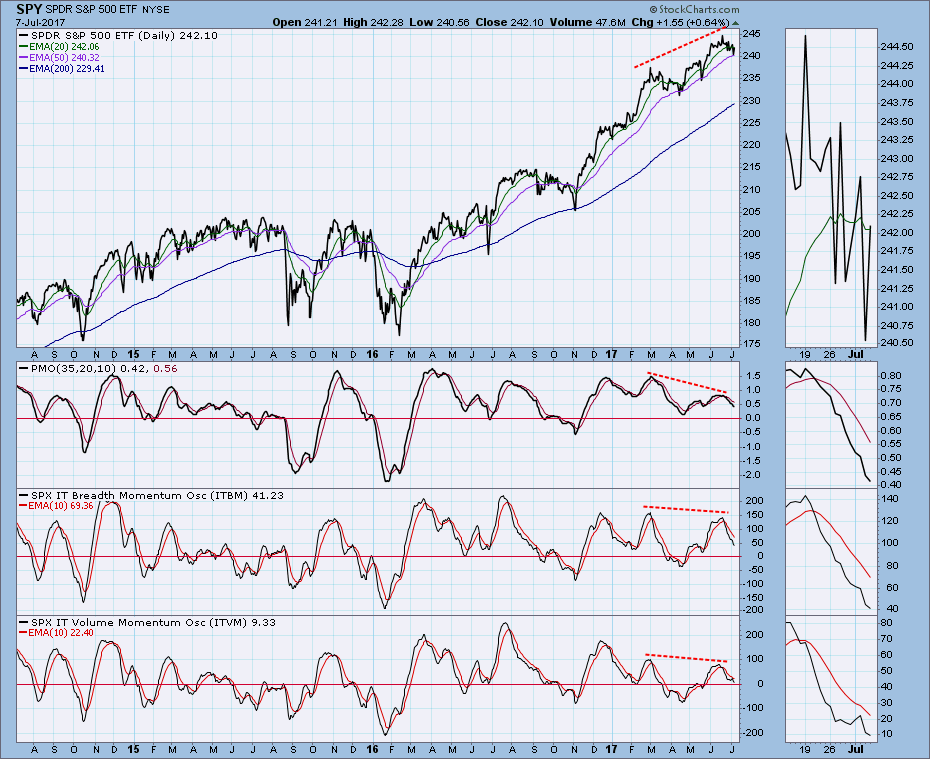
IT Trend Model: BUY as of 11/15/2016
LT Trend Model: BUY as of 4/1/2016
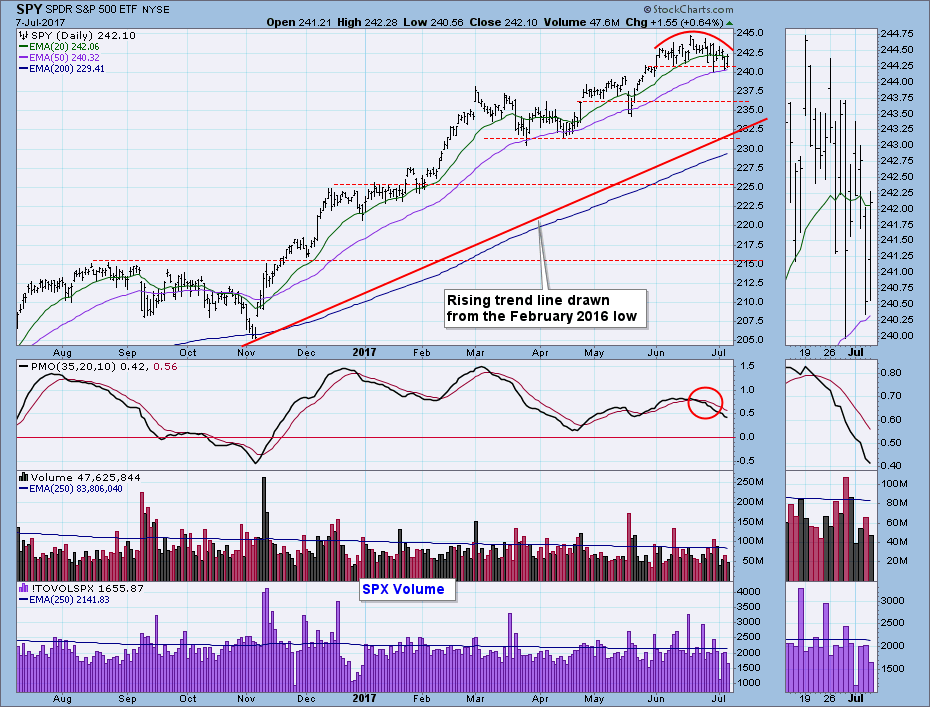
Price is still well above the bull market rising trend line, but the sideways price movement of the last five weeks has relieved this overbought condition somewhat. The rounded top and declining PMO imply that more corrective activity is likely. Volume was substandard this week because of the holiday.
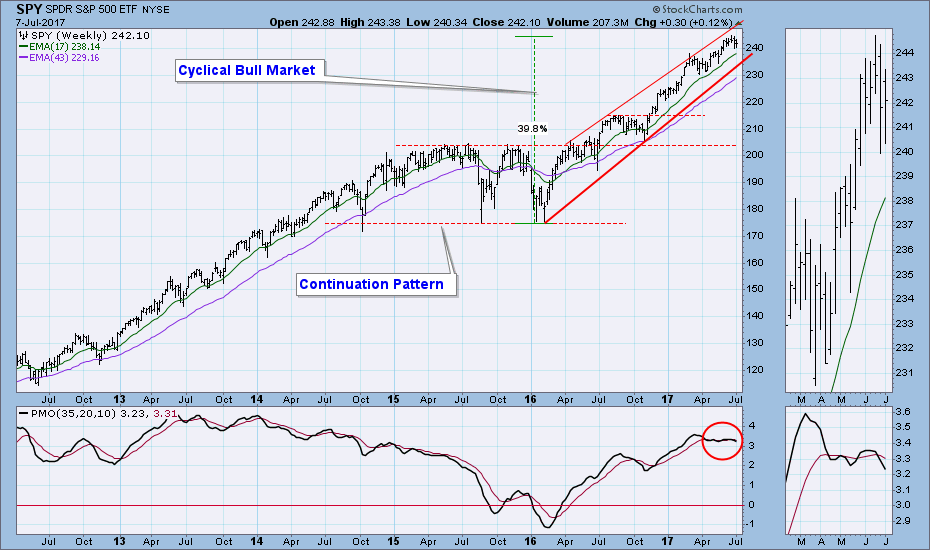
On the weekly chart there is a rising trend channel defining the cyclical bull market. Note that price failed to reach the top of the channel before it turned down, which shows that strength is diminishing. Yes, the channel is really a rising wedge, albeit not a very tight one. The implication of a rising wedge is that it will ultimately resolve downward. The weekly PMO is falling more steeply and confirms the suggestion put forth by the wedge pattern.
Short-Term Market Indicators: These indicators have neutral readings with a narrowing range. A bit like the calm before a storm.
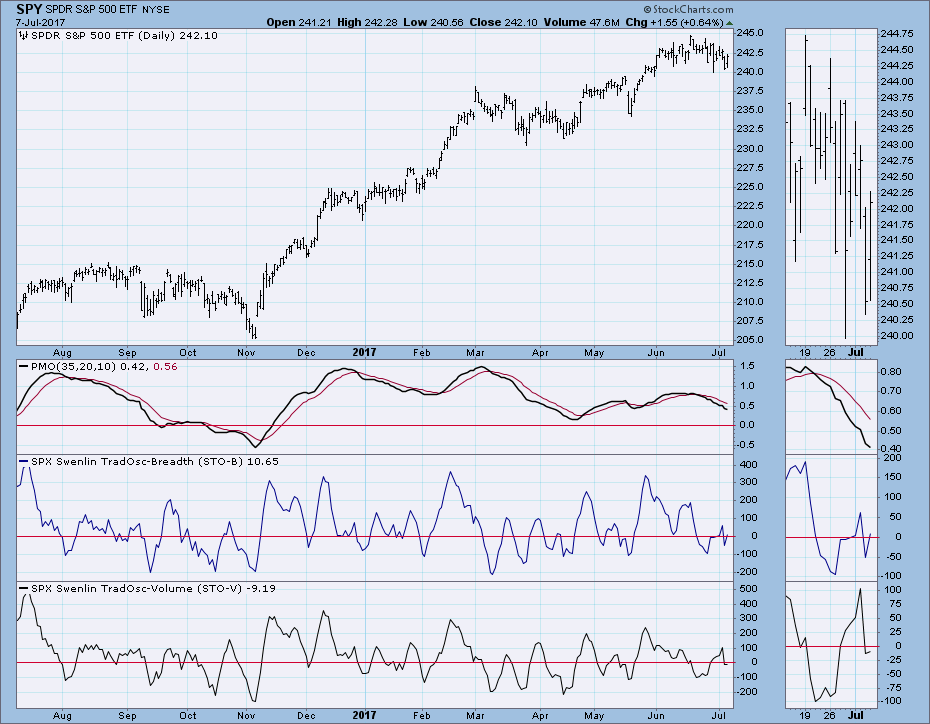
Intermediate-Term Market Indicators: These indicators are about neutral but falling. There is plenty of room for more downside before deeply oversold readings are reached.
Conclusion: Since early last month my opinion has been that the market was likely to correct or move sideways for a while. (Actually, sideways movement is a mild form of correction as the market churns and digests price advances.) The condition of the intermediate-term indicators suggests that the corrective action could continue for at least a few more weeks, and the rounded price top suggests that we may finally see some actual downside price movement.
DOLLAR
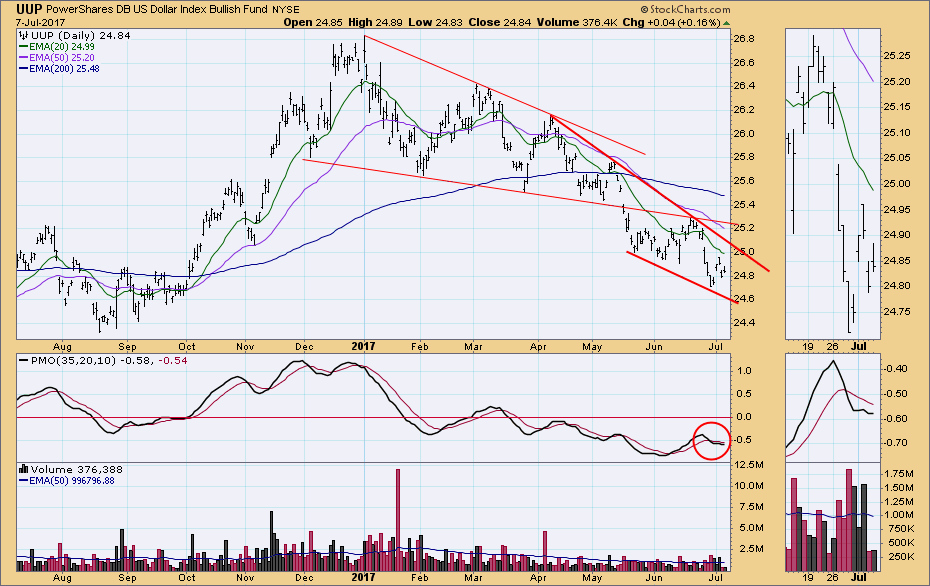
IT Trend Model: NEUTRAL as of 3/21/2016
LT Trend Model: SELL as of 5/24/2017
UUP had a small bounce this week, but the picture remains negative. Note that the declining tops line drawn from the April top is more accelerated than the one that preceded it, but it also forms the top of another falling wedge.
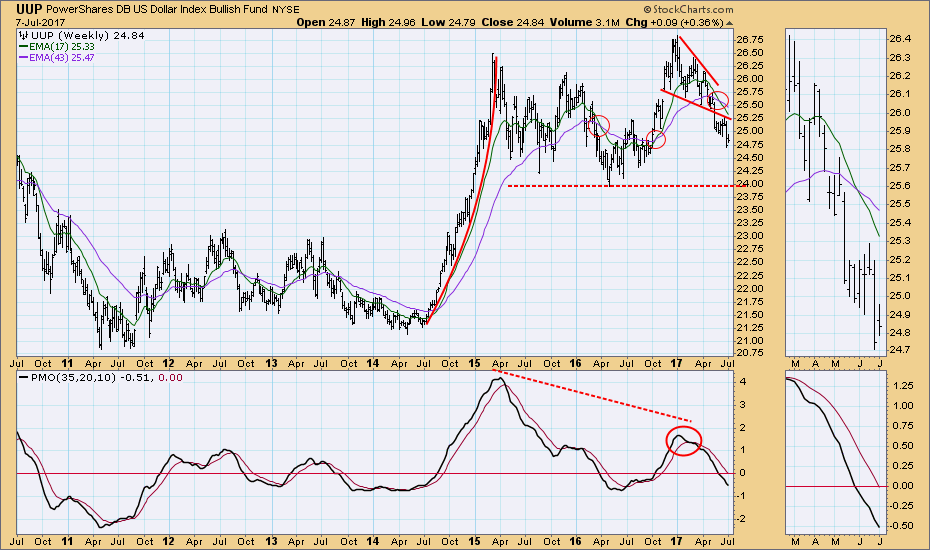
 UUP has been in a ragged trading range for over two years. The weekly PMO is falling, but price may find support around the 2016 low.
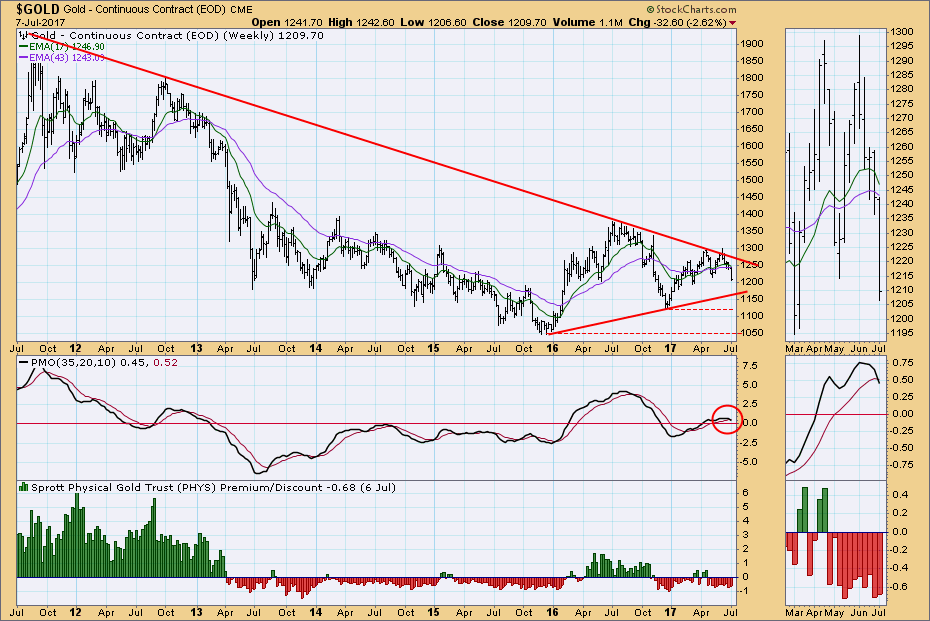
GOLD
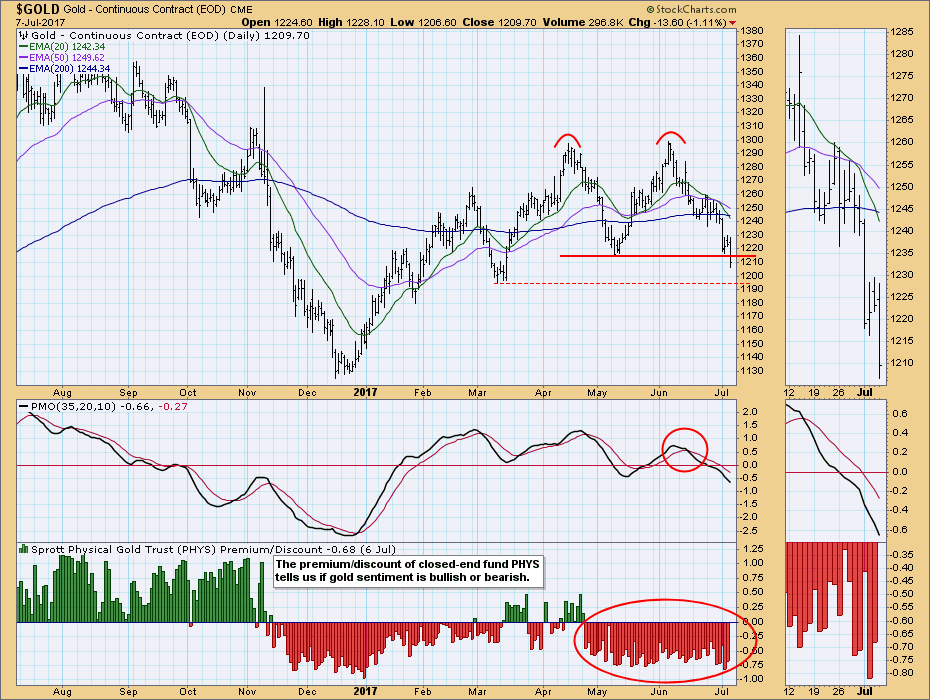
IT Trend Model: NEUTRAL as of 6/29/2017
LT Trend Model: BUY as of 4/12/2017
Gold has dropped down through the double top confirmation line at 1215, although it is not a decisive break. Nevertheless, the minimum downside target is 1130, which also happens to be the 2016 low. With the dollar showing weakness, we would normally expect gold to be performing well, but that is not the case, so I am very concerned regarding the longer-term outlook.
The weekly PMO crossed down through its signal line, generating a SELL signal. I have to think that the rising trend line will be challenged in a few more weeks.
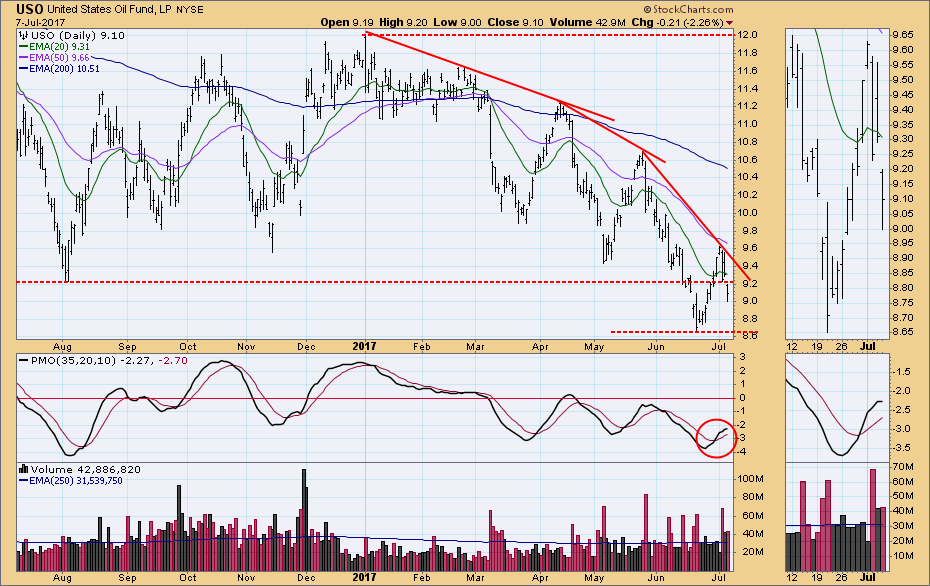
CRUDE OIL (USO)
IT Trend Model: NEUTRAL as of 3/8/2017
LT Trend Model: SELL as of 3/9/2017
On the daily chart the declining tops lines are becoming more accelerated to the downside, and the PMO has topped.
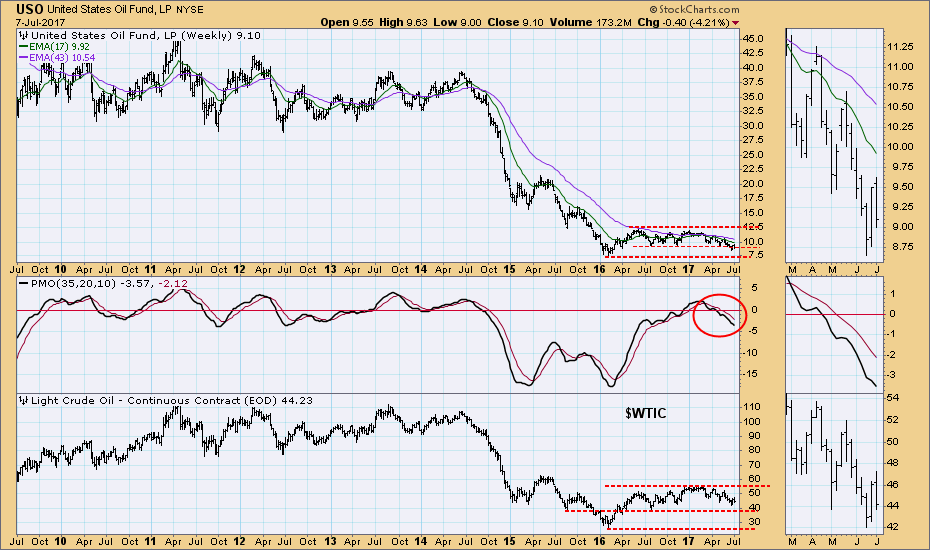
The weekly PMO for USO is bearish, and the next prominent price support is around 7.50. Corresponding support for $WTIC is around 38.00.
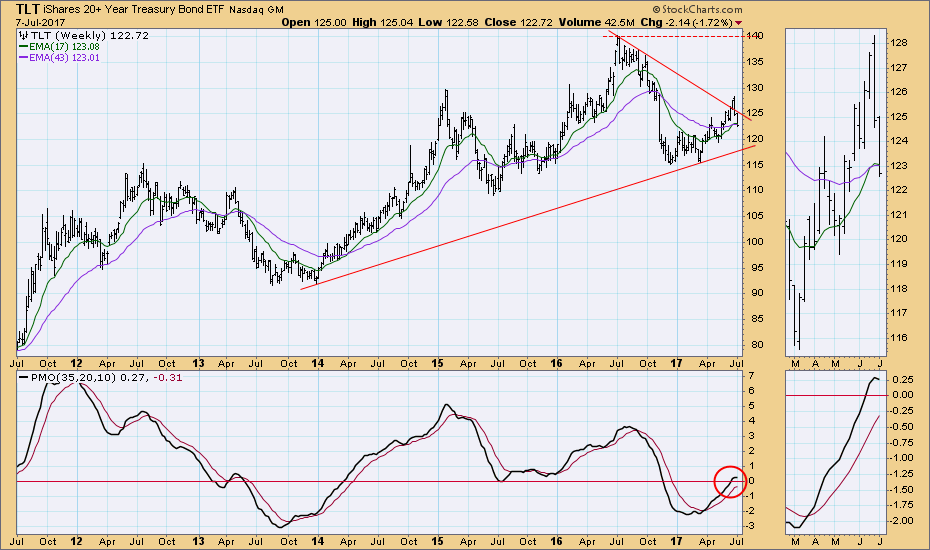
BONDS (TLT)
IT Trend Model: BUY as of 3/31/2017
LT Trend Model: BUY as of 6/16/2017
The bullish consequences of the saucer with handle formation seem to have played out, and a rising trend line drawn from the March low is now being challenged. Because the daily PMO is falling below its signal line, I am not optimistic about the rising trend remaining intact.
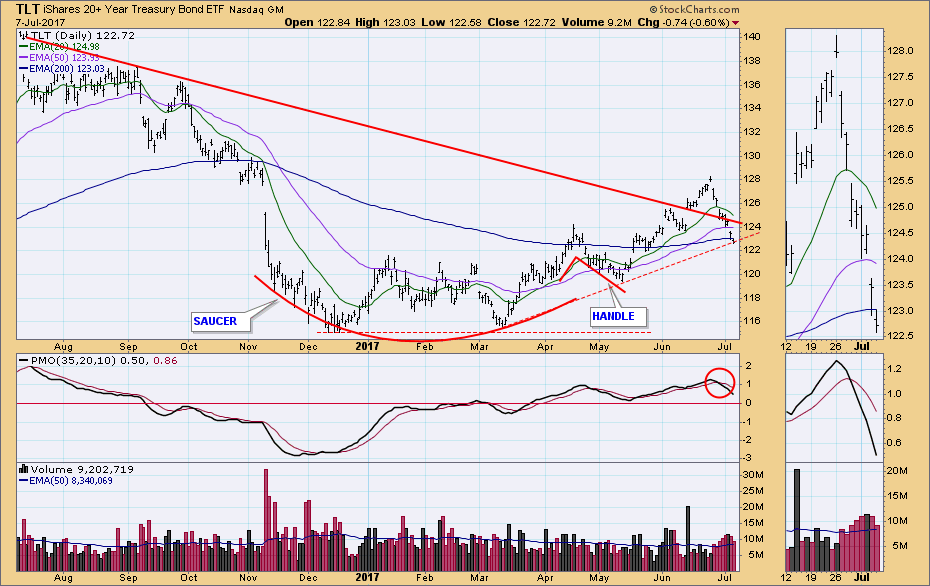
The TLT weekly chart gives a clearer view of the breakdown through the line of support. The weekly PMO topped this week, so more bearish action should be expected.
**Don't miss the DecisionPoint Alert Daily Commentary! Go to the "Notify Me" box toward the end of this blog page to be notified as soon as it is published at the end of the market day.**
Technical Analysis is a windsock, not a crystal ball.
Happy Charting!
- Carl
NOTE: The signal status reported herein is based upon mechanical trading model signals, specifically, the DecisionPoint Trend Model. They define the implied bias of the price index based upon moving average relationships, but they do not necessarily call for a specific action. They are information flags that should prompt chart review. Further, they do not call for continuous buying or selling during the life of the signal. For example, a BUY signal will probably (but not necessarily) return the best results if action is taken soon after the signal is generated. Additional opportunities for buying may be found as price zigzags higher, but the trader must look for optimum entry points. Conversely, exit points to preserve gains (or minimize losses) may be evident before the model mechanically closes the signal.
Helpful DecisionPoint Links:
DecisionPoint Shared ChartList and DecisionPoint Chart Gallery
Price Momentum Oscillator (PMO)
Swenlin Trading Oscillators (STO-B and STO-V)


