
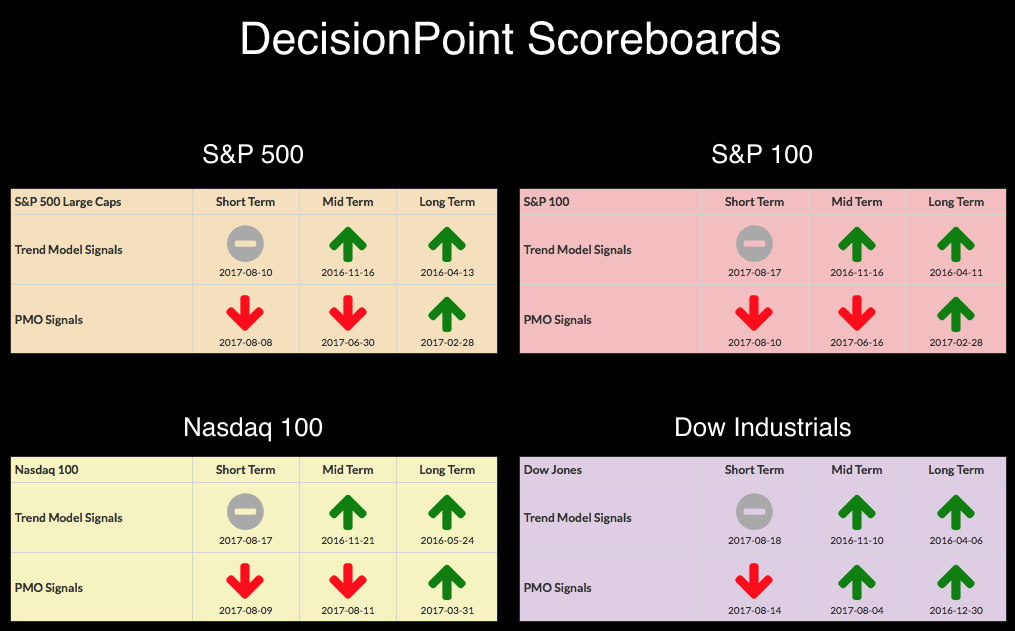
No changes to report on the DecisionPoint Scoreboards and based on the charts in the DecisionPoint ChartList (link at top of the DecisionPoint blog page), I only see the Intermediate-Term Trend Model signals nearing Neutral signals on the daily chart. 20-EMAs are steadily dropping toward negative crossovers the 50-EMAs.
The purpose of the DecisionPoint Alert Daily Update is to quickly review the day's action, internal condition, and Trend Model status of the broad market (S&P 500), the nine SPDR Sectors, the U.S. Dollar, Gold, Crude Oil, and Bonds. To ensure that using this daily reference will be quick and painless, we are as brief as possible, and sometimes we let a chart speak for itself.
SIGNALS: Here we include charts of any important signal changes triggered today by our Intermediate-Term Trend Model.
NO NEW SIGNAL CHANGES TO REPORT.
NOTE: Mechanical trading model signals define the implied bias of the price index based upon moving average relationships, but they do not necessarily call for a specific action. They are information flags that should prompt chart review. Further, they do not call for continuous buying or selling during the life of the signal. For example, a BUY signal will probably return the best results if action is taken soon after the signal is generated. Additional opportunities for buying may be found as price zigzags higher, but the trader must look for optimum entry points. Conversely, exit points to preserve gains (or minimize losses) may be evident before the model mechanically closes the signal.
STOCKS
IT Trend Model: BUY as of 11/15/2016
LT Trend Model: BUY as of 4/1/2016
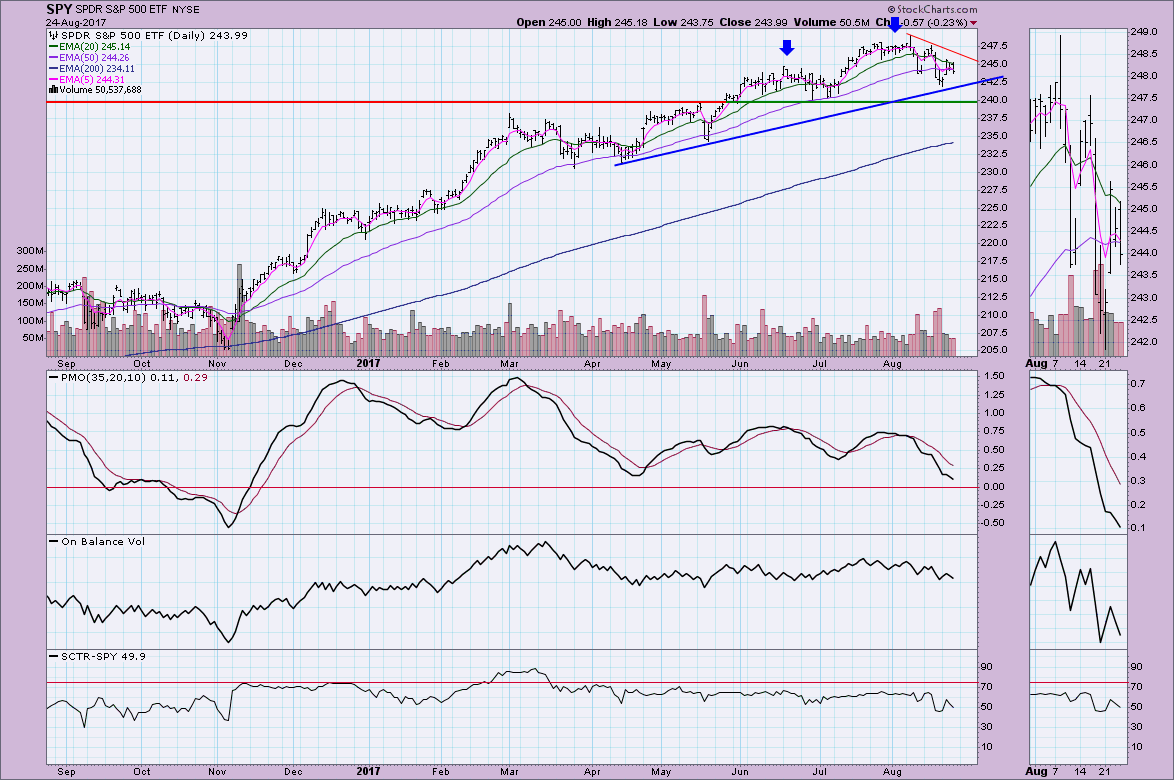
Price is meandering slowly toward gap support from Tuesday. The market is wishy washy with neither the bulls nor the bears aggressive enough to take control.
What we do know is that momentum continues to wane and the OBV is showing a bearish confirmation with both price tops and indicator tops in decline. The 20-EMA is acting as resistance, yet the 50-EMA is providing no real support. I subscribe to a test of $240. I think you could make a valid case for a medium-term head and shoulders reversal pattern shaping up, but regardless of whether that is going to be the case, the rubber will definitely meet the road at $240 unless price can bounce off rising bottoms support around $242.50.
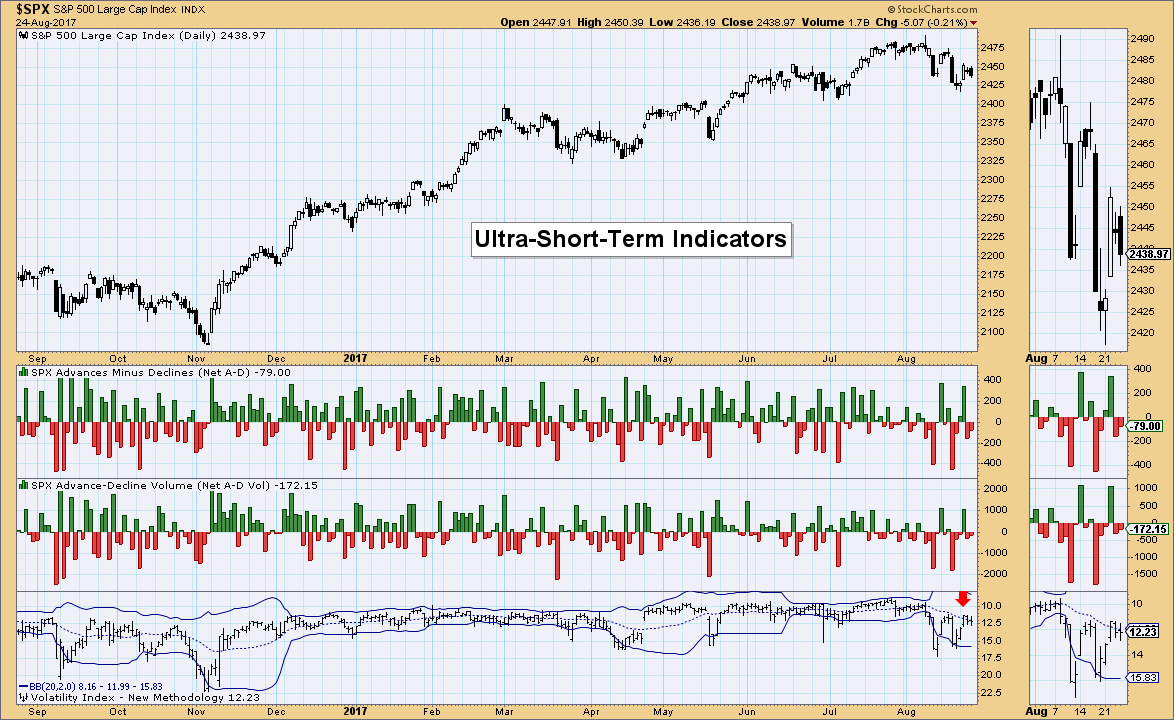
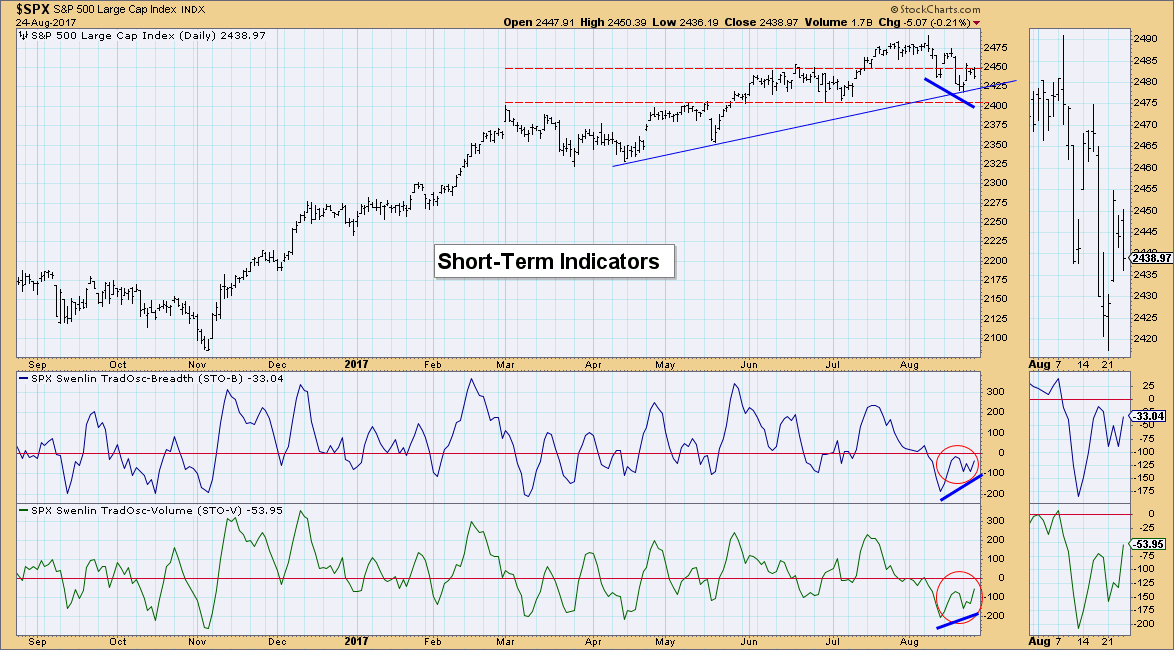
Ultra-Short-Term Indicators: Nothing helpful here with readings being low and the VIX sitting on its average.
Short-Term Indicators: This is a good news, bad news chart. The bad news is that these indicators can't get above the zero line, that tells us the market is internally weak. The good news is that we can see a positive divergence between indicator bottoms and price bottoms. Again, I think support at $240 (2400 for the SPX) is the key. These indicators are giving us mixed messages unfortunately.
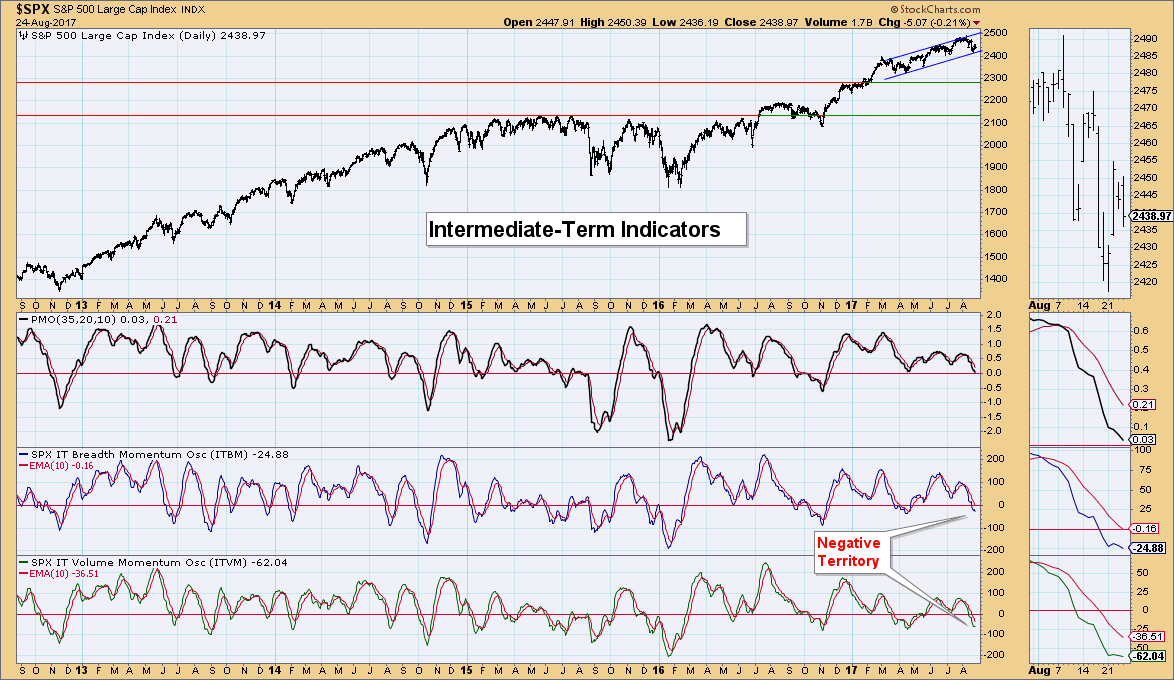
Intermediate-Term Indicators: No mixed messages here. These indicators brushed off the recent attempt at a bottom and instead are headed lower. Granted readings are in near-term oversold territory, but I'm not seeing enough resolve to turn it around by the indicators.
Conclusion: The only positive right now is the positive divergence on the short-term indicators. Unfortunately I think the PMO SELL signal and decline paired with bearish intermediate-term indicators, I would expect 2400 to be tested by the SPX. Signs point to weakness when it reaches it, but we've seen the bullish winds (many times irrational) push price right back up off support.
DOLLAR
IT Trend Model: NEUTRAL as of 3/21/2016
LT Trend Model: SELL as of 05/24/2017
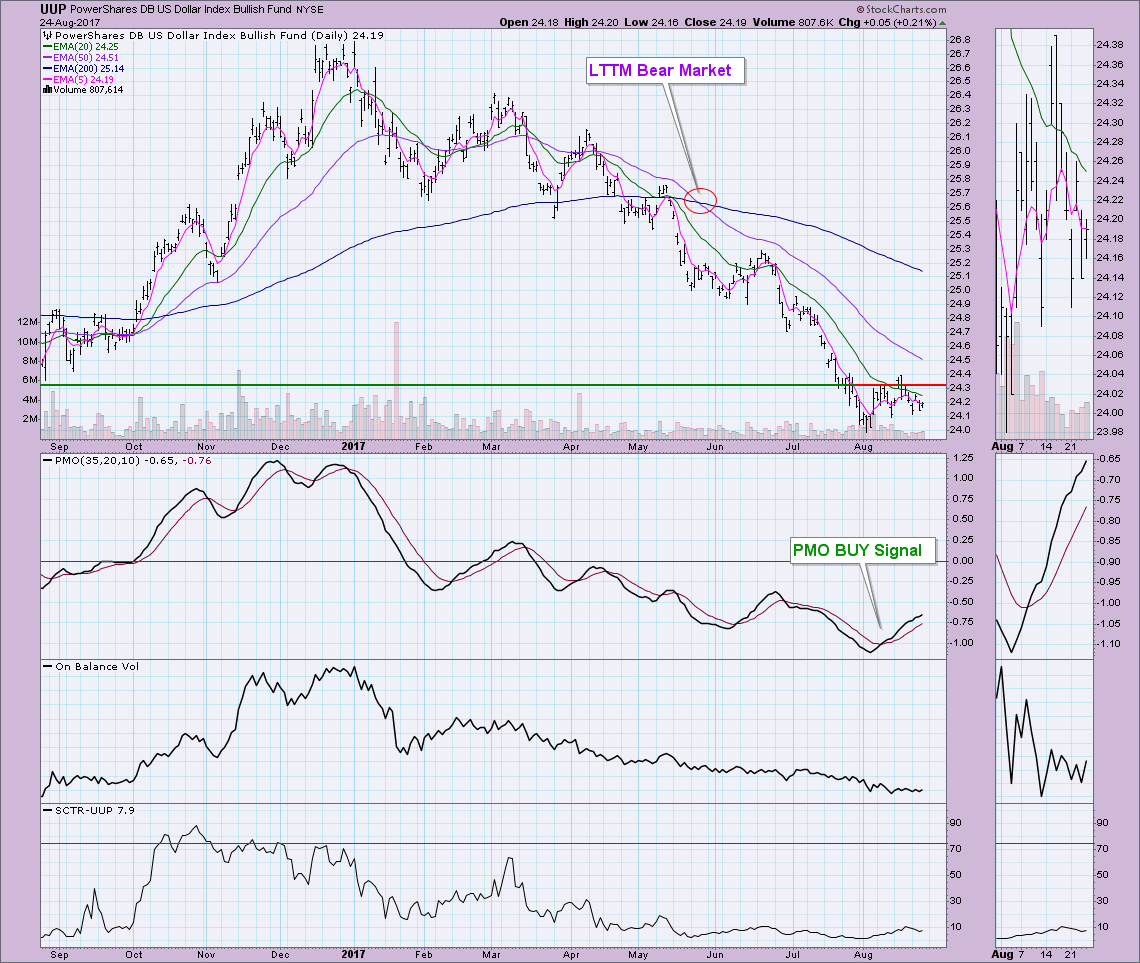
As noted in the headline, the Dollar, Gold and Bonds are at a decision point; meaning it's time for them to break out or break down. They're at resistance, so what's it gonna be? The indicators on the Dollar (UUP) are mixed. The PMO looks great, rising with little hesitation. The EMAs, however, are as negative as they can be. Not only are they lined up with the slowest average on top with faster averages on the bottom, none of them are rising. Price trend is not really confirming the PMO BUY signal and rise. I think it's time for it to rally, but only the PMO supports that.
GOLD
IT Trend Model: BUY as of 7/31/2017
LT Trend Model: BUY as of 4/12/2017
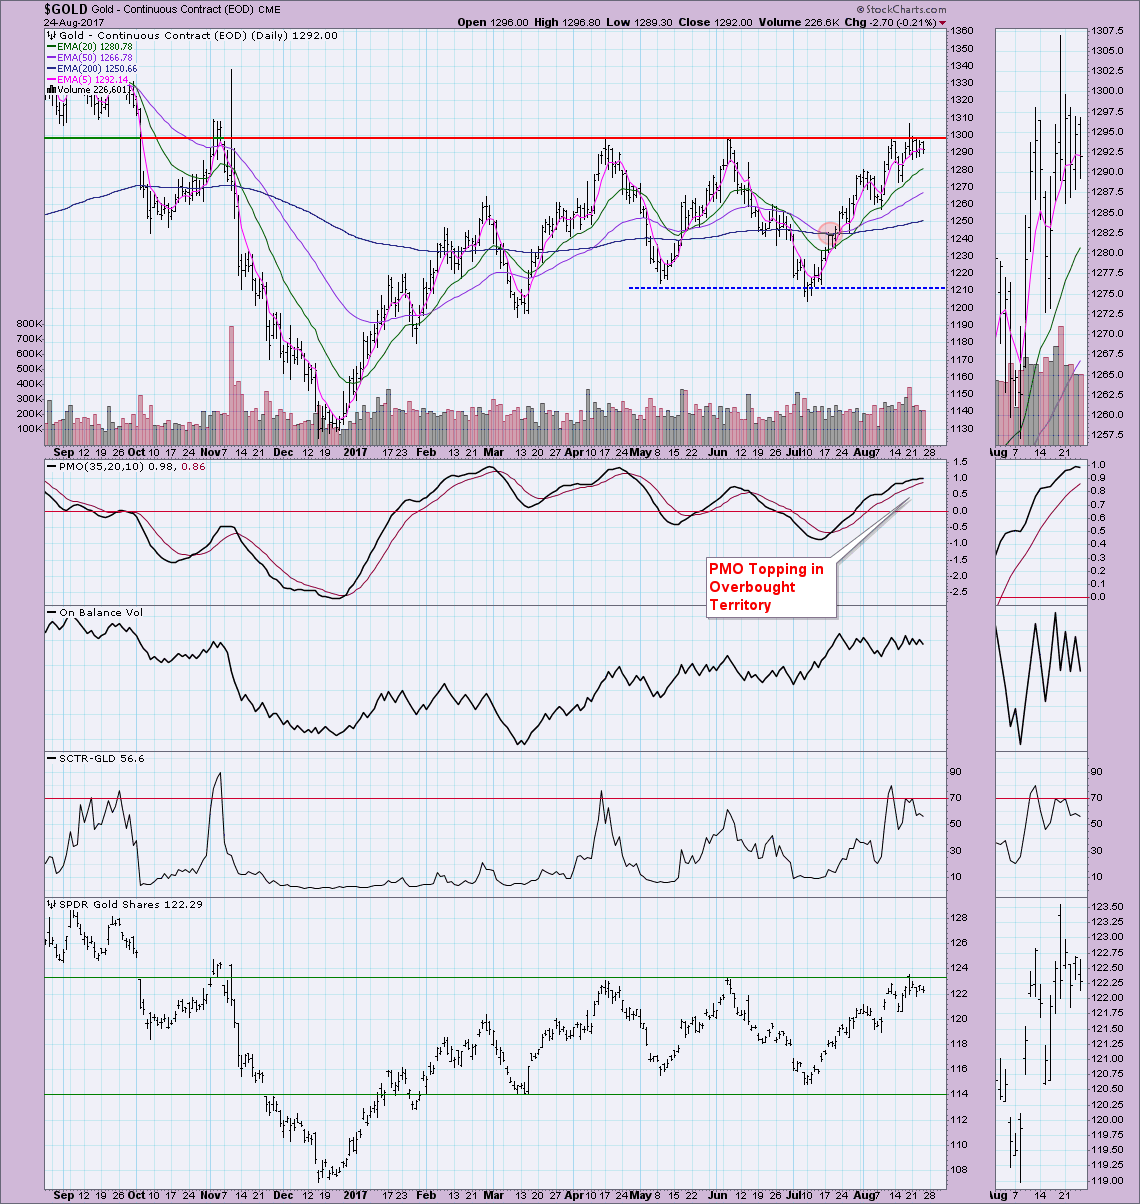
Gold needs to make a move too. The OBV isn't helpful as it corkscrews tighter. Price trend is bullish as far as EMA configuration with only the 5-EMA declining (and that happened today). The PMO is very bearish. Not only has it topped, it is overbought territory. Price continues to struggle at the 1300 level. I just don't think it's got enough steam to breakout given the topping PMO.
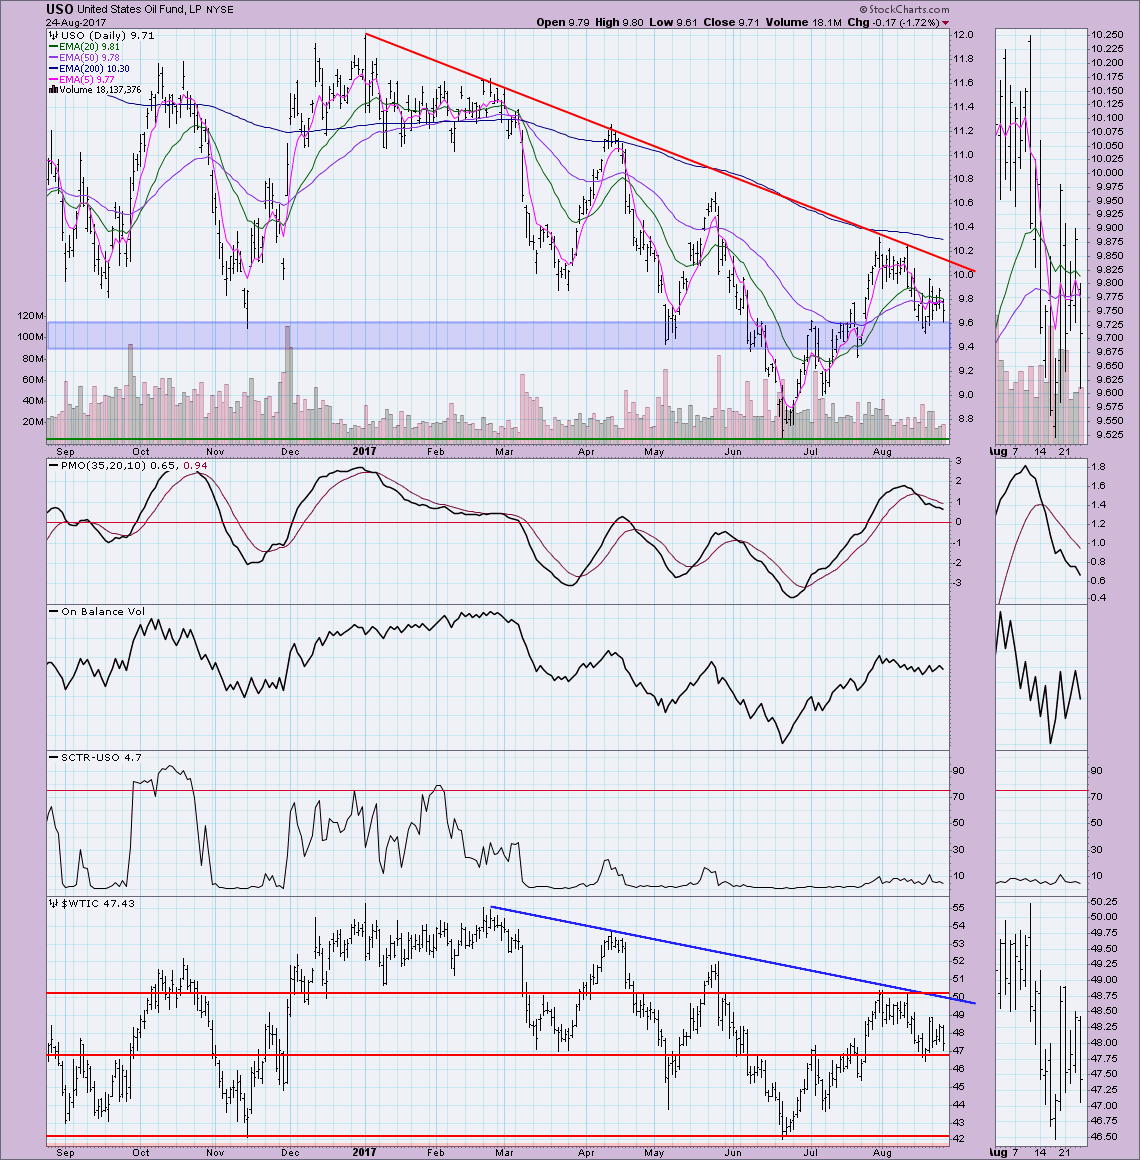
CRUDE OIL (USO)
IT Trend Model: BUY as of 8/1/2017
LT Trend Model: SELL as of 3/9/2017
The $9.50 area continues to hold for support, although price tops have been declining since July. I would look at this as a descending triangle. It's a bearish formation. The PMO is bearish, declining after an overbought SELL signal. The OBV isn't all that encouraging, although the last two bottoms were rising with price. I suspect support will break and price will look for the June bottom around $8.70.
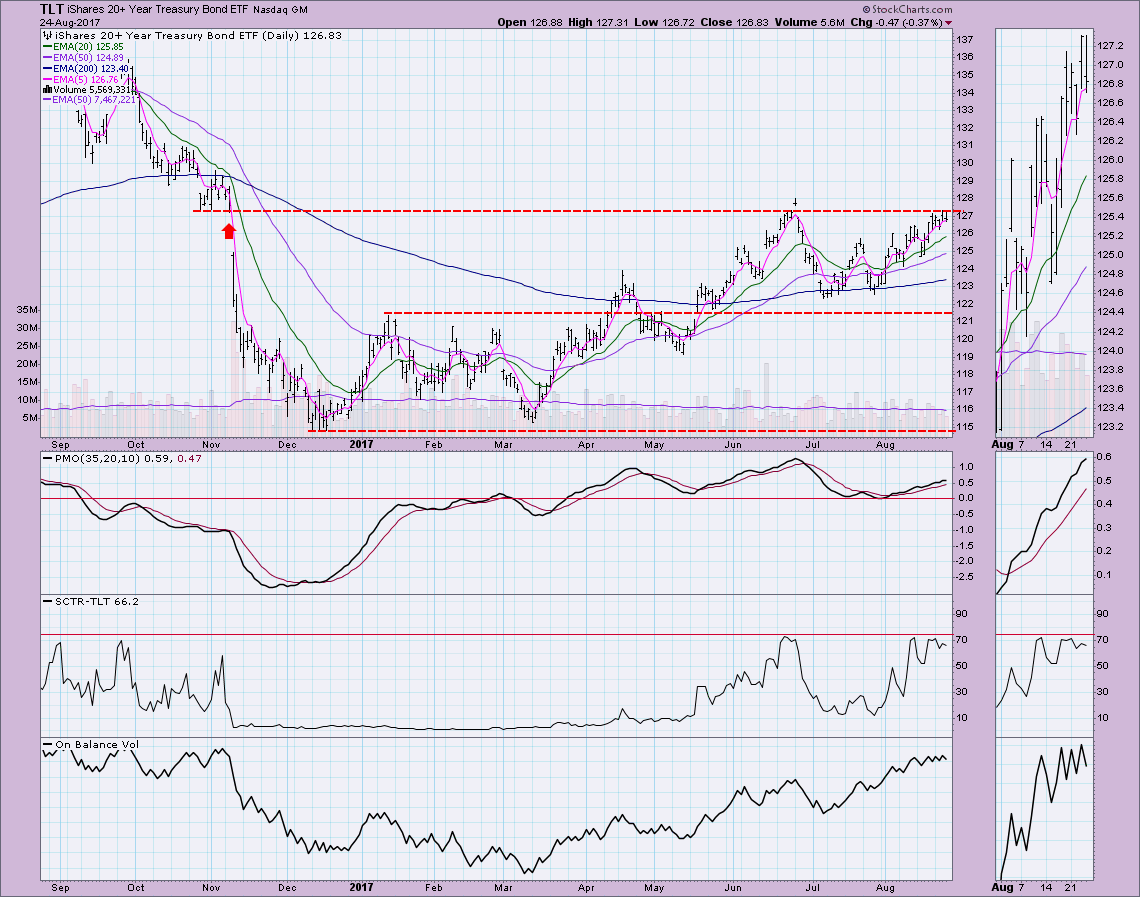
BONDS (TLT)
IT Trend Model: BUY as of 3/31/2017
LT Trend Model: BUY as of 6/16/2017
Bonds are bumping against overhead resistance at strong resistance. Like the Dollar, it has some indicator strength that suggests a breakout. The PMO is on a BUY signal and rising, not really overbought. The SCTR is holding in a decent range and OBV bottoms and tops are mostly rising. With the Dollar, Bonds and Gold all at a decision point, we can't use them for comparison as we usually do. I'll be curious what Friday brings to the table.
Helpful DecisionPoint Links:
DecisionPoint Shared ChartList and DecisionPoint Chart Gallery
Price Momentum Oscillator (PMO)
Swenlin Trading Oscillators (STO-B and STO-V)
Technical Analysis is a windsock, not a crystal ball.
Happy Charting!
- Erin
**Don't miss DecisionPoint Commentary! Add your email below to be notified of new updates"**


