 After a wonderful wedding and honeymoon, I have finally returned! It took some time to review and update my annotations and I see that we've had quite a few signal changes while I was gone. The market has been meandering lower this month since I left and consequently the DP indicators have seen some bearish changes. Let's get started with a fresh review.
The purpose of the DecisionPoint Alert Daily Update is to quickly review the day's action, internal condition, and Trend Model status of the broad market (S&P 500), the nine SPDR Sectors, the U.S. Dollar, Gold, Crude Oil, and Bonds. To ensure that using this daily reference will be quick and painless, we are as brief as possible, and sometimes we let a chart speak for itself.
SIGNALS: Here we include charts of any important signal changes triggered today by our Intermediate-Term Trend Model.
NO NEW SIGNALS TO REPORT
NOTE: Mechanical trading model signals define the implied bias of the price index based upon moving average relationships, but they do not necessarily call for a specific action. They are information flags that should prompt chart review. Further, they do not call for continuous buying or selling during the life of the signal. For example, a BUY signal will probably return the best results if action is taken soon after the signal is generated. Additional opportunities for buying may be found as price zigzags higher, but the trader must look for optimum entry points. Conversely, exit points to preserve gains (or minimize losses) may be evident before the model mechanically closes the signal.
STOCKS
IT Trend Model: BUY as of 11/15/2016
LT Trend Model: BUY as of 4/1/2016
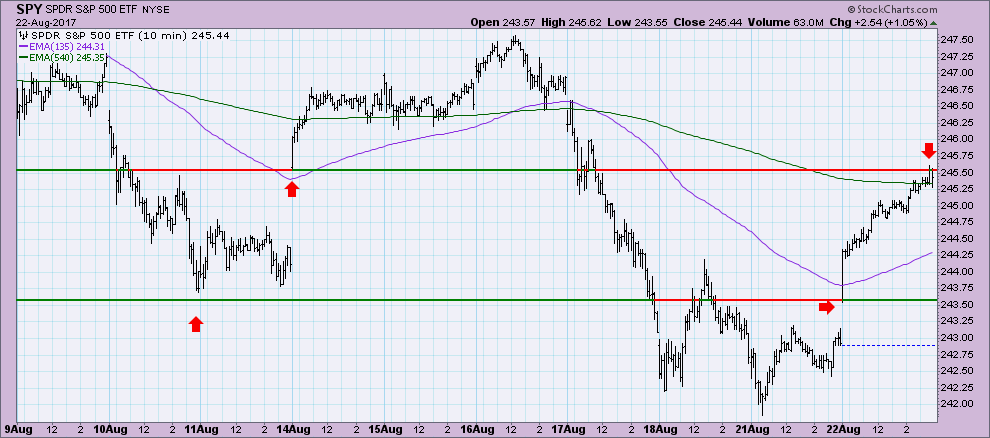
I note important gap support on the 10-minute bar chart. Today price gapped up through resistance at $243, but was stopped at gap resistance from August 14th.
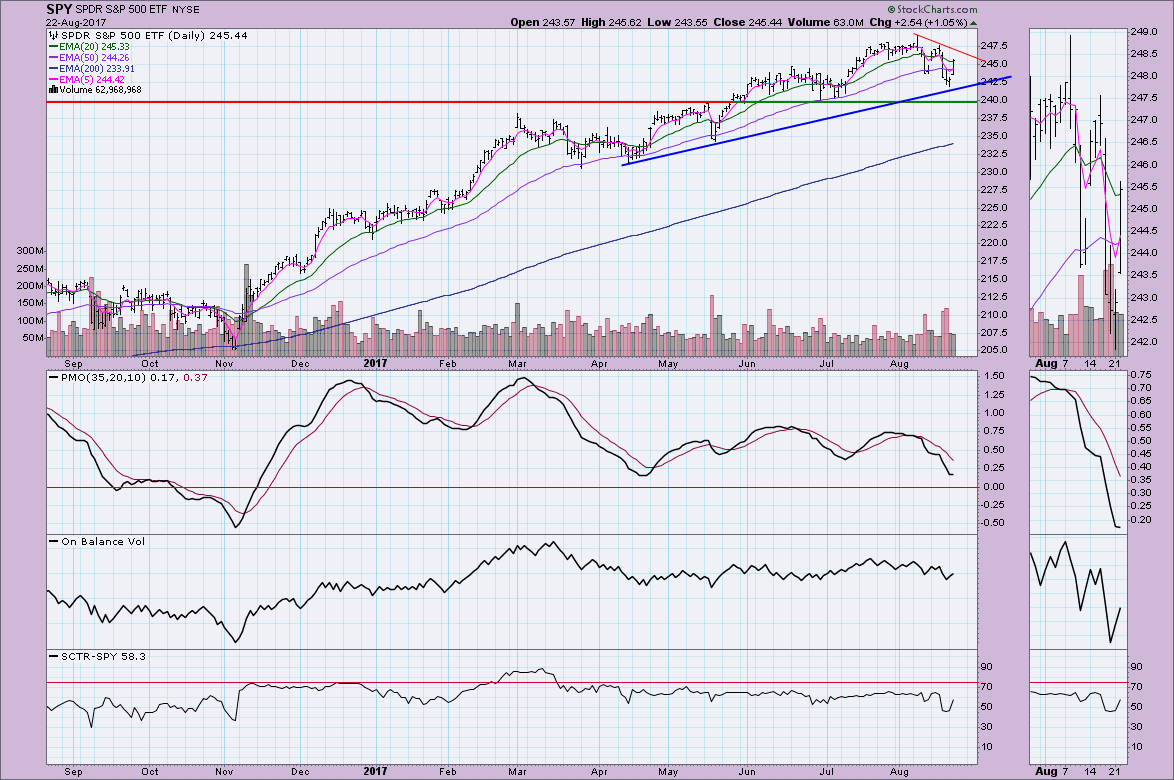
As I noted in today's headline, price bounced off rising bottoms support before it actually tested horizontal support at $240. The PMO was tugged upward in response to today's rally, though I'm not sure we will see much follow-through. You can see very short-term overhead resistance formed by the declining tops trendline drawn from all-time highs that will be the first hurdle. I like that the SCTR is responding positively, but volume was unimpressive on the day.
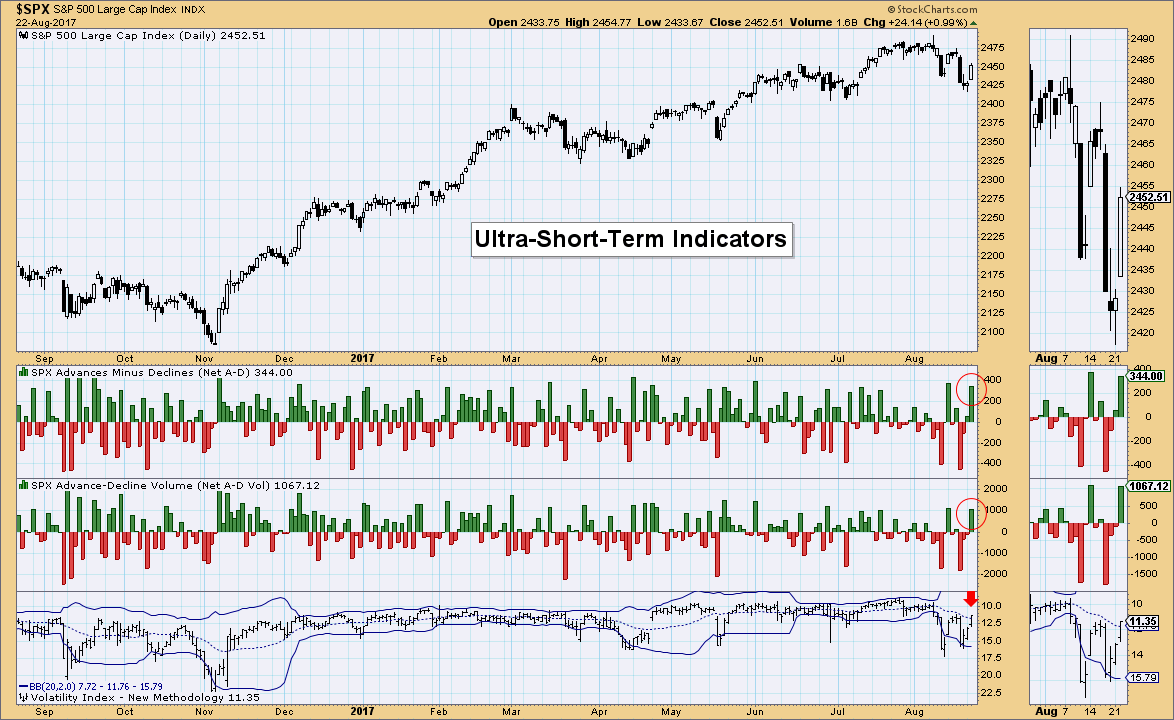
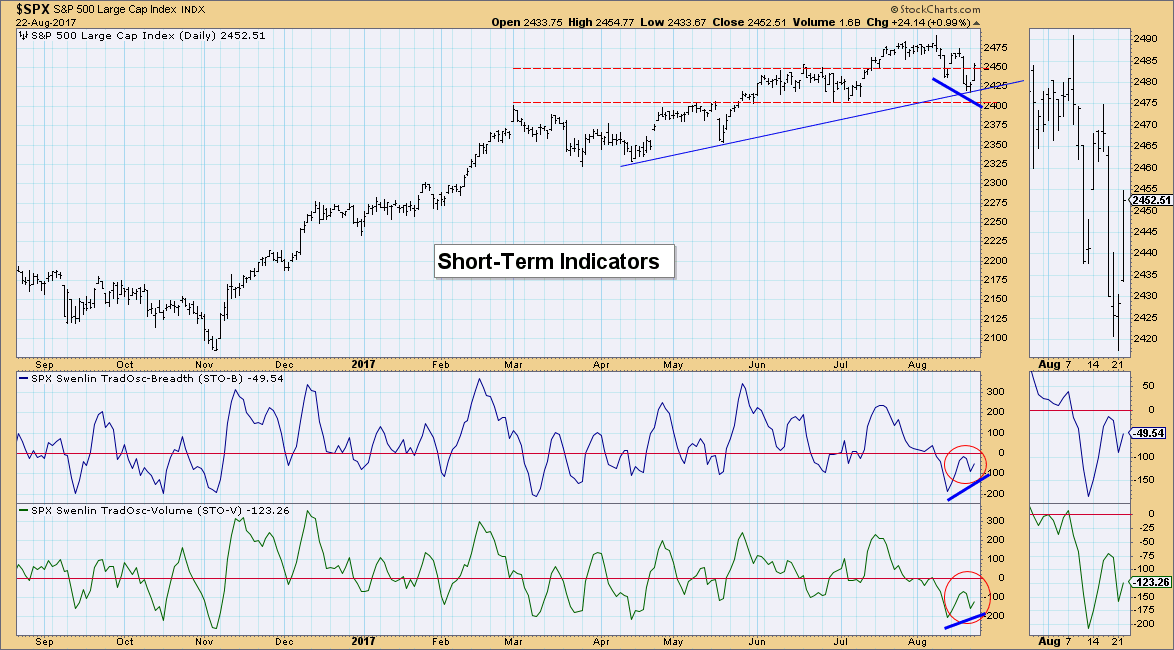
Ultra-Short-Term Indicators: We saw climactic breadth readings but not a comparable climactic reading on the VIX which remained tethered to its average. Consequently, I'm not looking at this as an exhaustion. It could be an initiation to higher prices, but without seeing the VIX pressing against either of its Bollinger Bands, I don't think we can really call these readings as an initiation or exhaustion.
Short-Term Indicators: I definitely do not like the inability of these indicators to penetrate the zero line. It is certainly encouraging to see them turn back up and there is a short-term positive divergence between indicator bottoms and price bottoms.
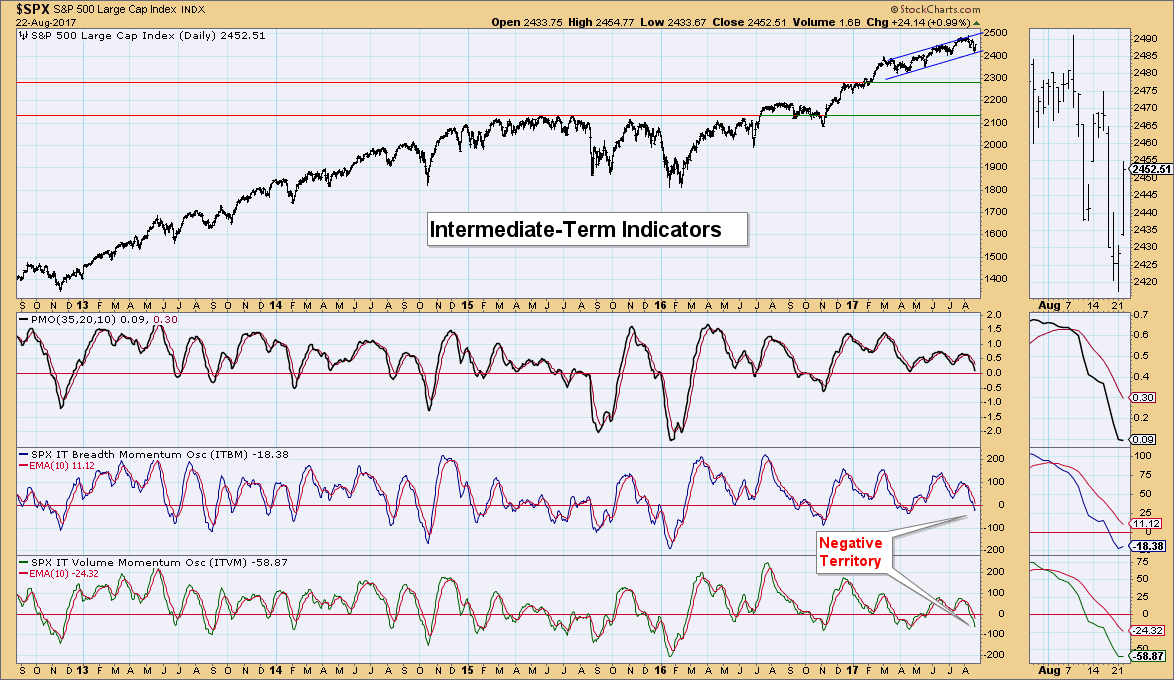
Intermediate-Term Indicators: These indicators turned up which is bullish, though I suspect this could be just another twitch. Good news is that they have reached near-term oversold territory. Of course we've seen much lower readings as in early 2016, but in the very bullish market experienced since the election, this does seem to be a good area for indicator reversals to the upside.
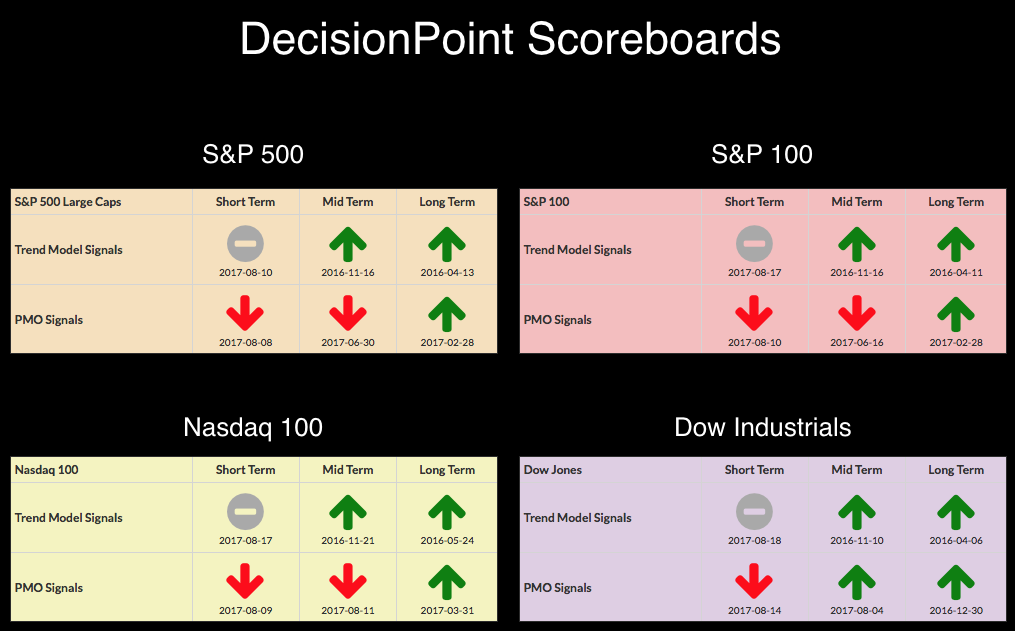
Conclusion: Today's rally was impressive and it managed to pull the indicators out of declines which is positive. I'd like to see a breakout above the short-term declining tops trendline on the SPY, but the market has been soft with a bearish leaning as seen with the current PMO SELL signals in place on all four of the Scoreboard indexes. I'll be watching intermediate-term indicators closely to see if they can get follow-through on the tick upward today.
DOLLAR
IT Trend Model: NEUTRAL as of 3/21/2016
LT Trend Model: SELL as of 05/24/2017
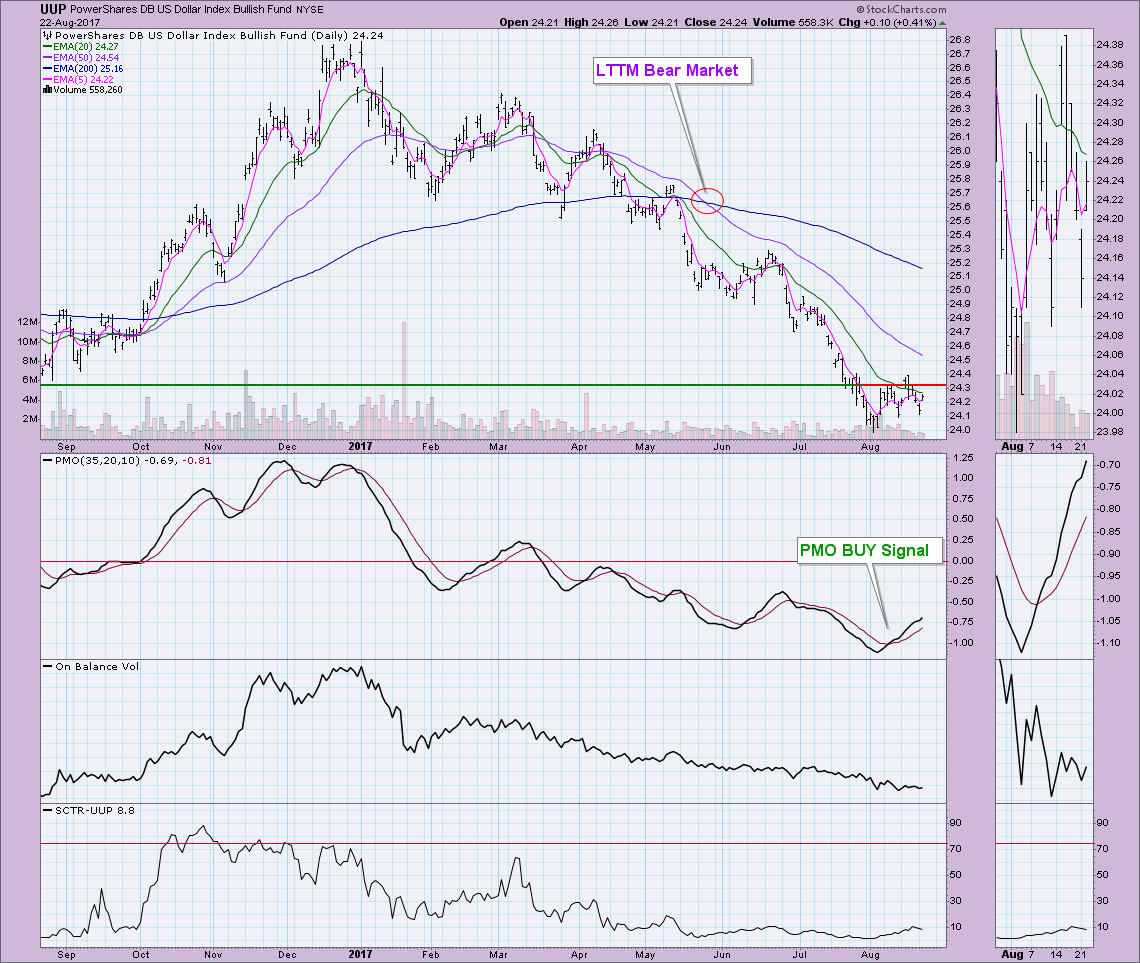
Since planning my honeymoon in Italy last March, the Dollar broke down below important support at $25.60 for UUP. Since then it has been a death spiral which made those Euro withdrawals in Italy particularly painful. Given that I'm back, It seems likely UUP will begin its recovery. Technically speaking the PMO BUY signal that arrived earlier this month looks good; however, price has been unable to pass through resistance at around $24.30 and the 20-EMA. The OBV isn't revealing anything, but a breakout seems likely here.
GOLD
IT Trend Model: BUY as of 7/31/2017
LT Trend Model: BUY as of 4/12/2017
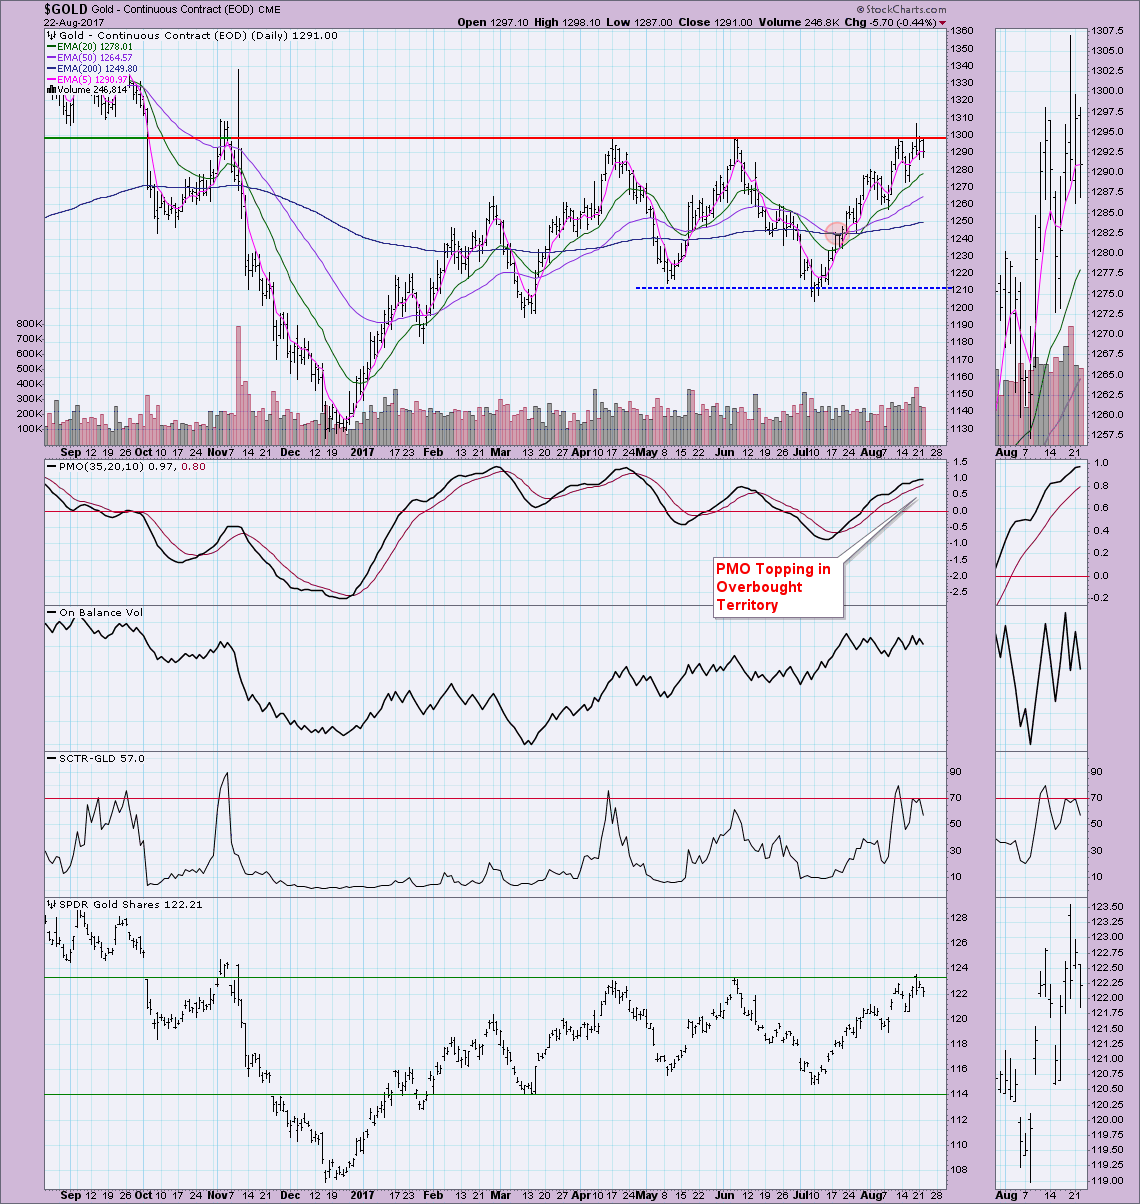
Gold has reached important overhead resistance at the 1300 level. I listened to Greg Schnell's analysis of Gold on Monday's MarketWatchers LIVE show and he is bullish on Gold. I have been bullish on Gold, but I don't like the PMO configuration here. Also knowing that the Dollar is poised for a breakout, I am skeptical that this level will be convincingly broken. The SCTR has also come down, although the OBV isn't revealing anything. At this point, I'd have to say I'm Neutral on Gold even though the EMAs are configured quite positively. I agree with Tom that we need to see a convincing breakout above $1300 for Gold and $124 for GLD.
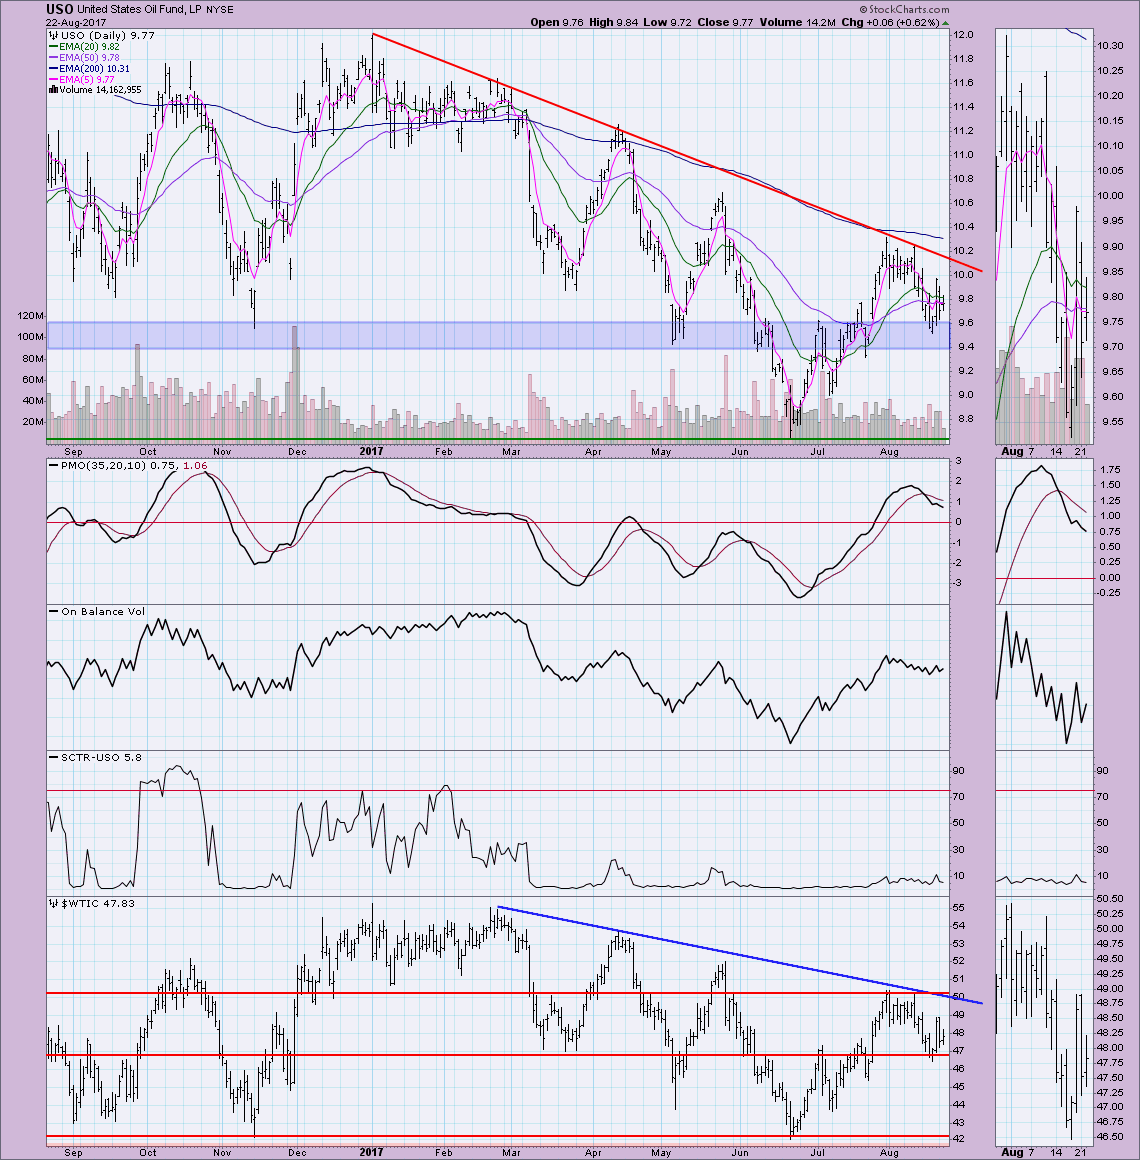
CRUDE OIL (USO)
IT Trend Model: BUY as of 8/1/2017
LT Trend Model: SELL as of 3/9/2017
USO continues to beat its head against declining tops line resistance, although support in the $9.50 range is holding up nicely. I would combine both and you can see a bearish descending triangle. Pair that with the recent PMO SELL signal in overbought territory and you have a recipe for a breakdown below $9.40.
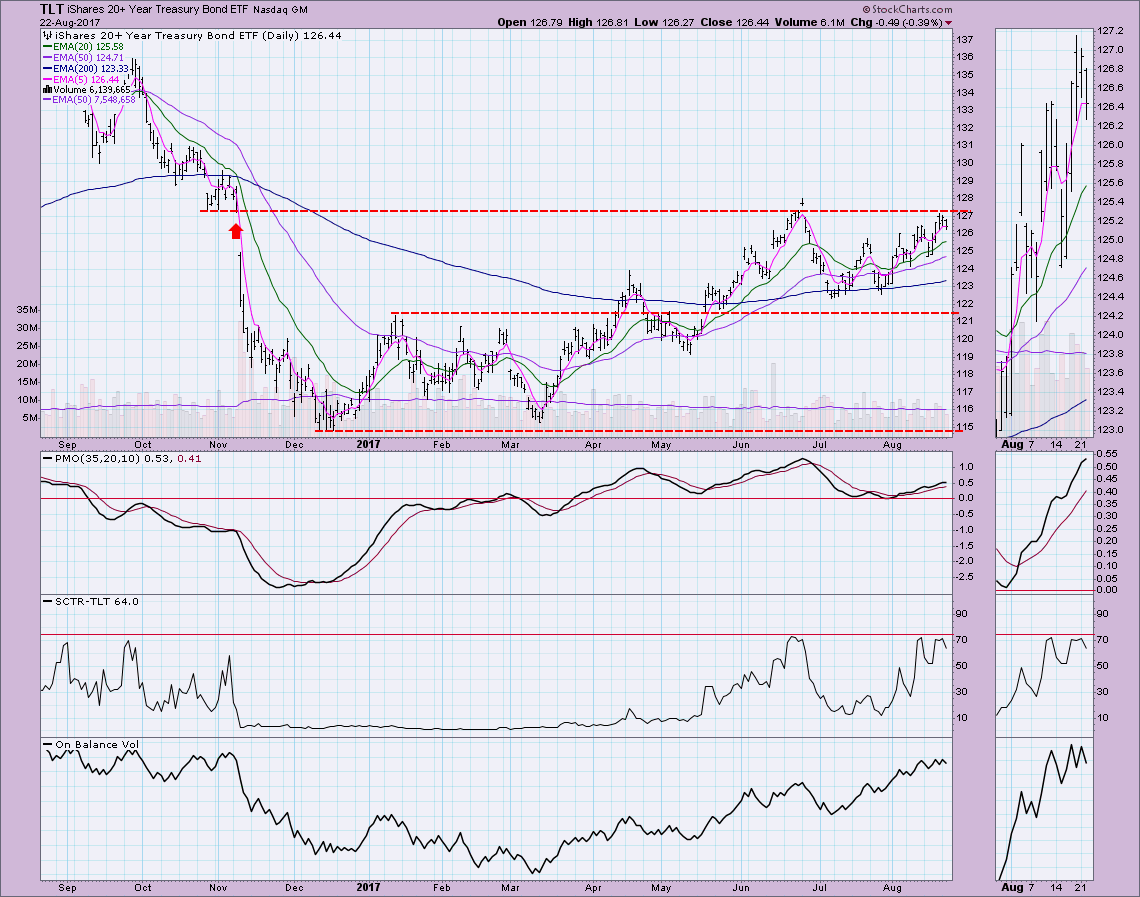
BONDS (TLT)
IT Trend Model: BUY as of 3/31/2017
LT Trend Model: BUY as of 6/16/2017
I remember before I left that Tom and I had done an "Agree/Disagree" segment on the MarketWatchers LIVE show asking whether the June high would turn out to be the high for the year. If I recall I said that resistance level would be broken before the end of the year. Well, TLT this is your time to shine. The PMO has been gently rising off the zero line which is positive. It isn't overbought and has room to move higher in support of a breakout. I like TLT and believe we will see that breakout soon.
Helpful DecisionPoint Links:
DecisionPoint Shared ChartList and DecisionPoint Chart Gallery
Price Momentum Oscillator (PMO)
Swenlin Trading Oscillators (STO-B and STO-V)
Technical Analysis is a windsock, not a crystal ball.
Happy Charting!
- Erin
**Don't miss DecisionPoint Commentary! Add your email below to be notified of new updates"**


