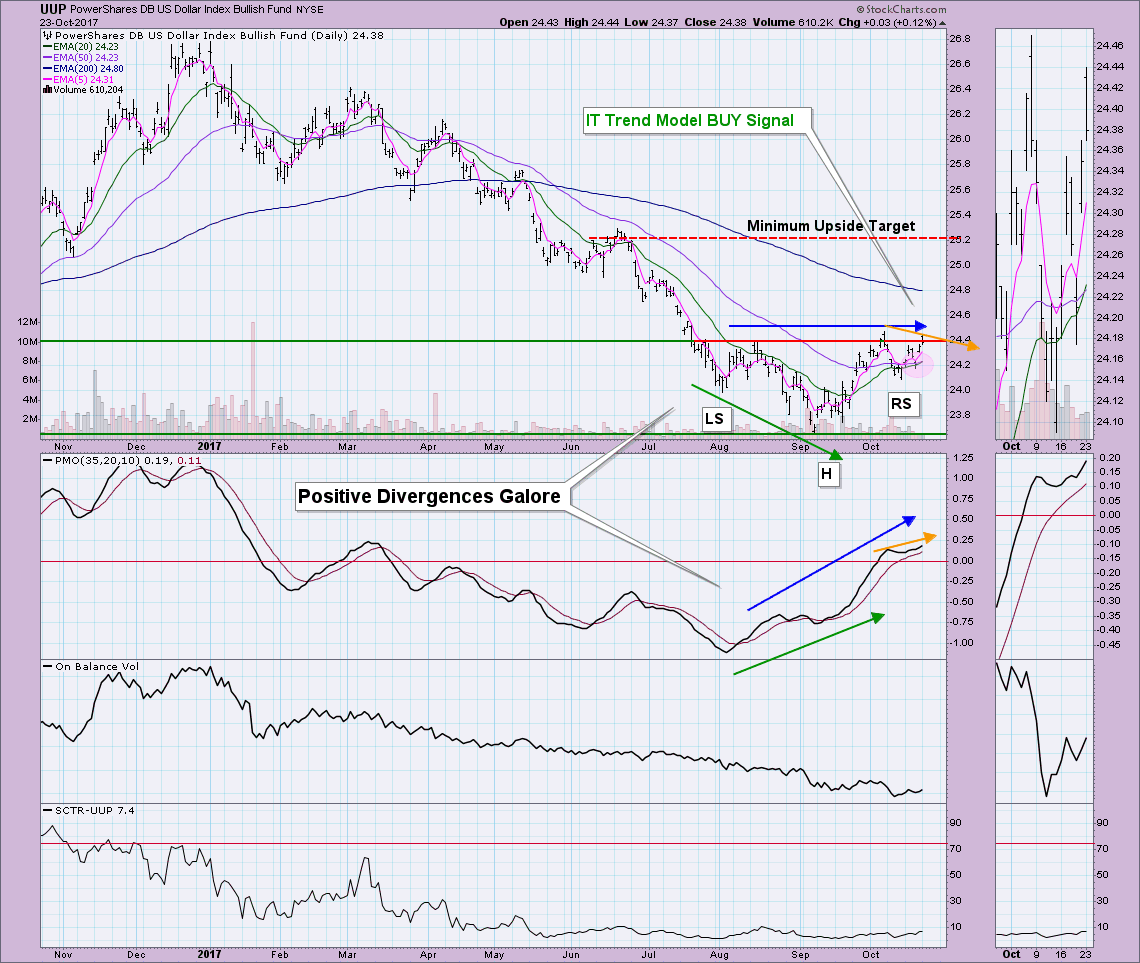
 On Friday, Gold minted a new IT Trend Model Neutral signal, so it isn't surprising to see the opposite occur for the Dollar. Looking at the chart of UUP, there are plenty of bullish characteristics. This new IT Trend Model BUY signal is a great confirmation of the very bullish reverse head and shoulders pattern that has formed.
Lots going on in this chart, let's break it down. First and foremost, the IT Trend Model BUY signal was generated when the 20-EMA crossed above the 50-EMA. There is technically still a bear market bias on UUP given the 50-EMA is so far below the 200-EMA. The 50-EMA is turning back up and that is a positive sign. The reverse head and shoulders pattern won't technically execute until this month's high is broken, but the expectation IS an upside breakout. The minimum upside target would around $25.20 and low and behold, it's an important area of overhead resistance. I love it when technical analysis works!
Next, the PMO is rising. It never gave up its BUY signal on the forming of the right shoulder. As noted, we are seeing numerous positive divergences that I would consider more evidence for an upside breakout. The PMO is also above zero now and resuming its rise. It has ample room to move higher before becoming overbought. I'd be really surprised if overhead resistance holds here at about $24.40.
Helpful DecisionPoint Links:
DecisionPoint Shared ChartList and DecisionPoint Chart Gallery
Price Momentum Oscillator (PMO)
Swenlin Trading Oscillators (STO-B and STO-V)
Technical Analysis is a windsock, not a crystal ball.
Happy Charting!
- Erin
**Don't miss DecisionPoint Commentary! Add your email below to be notified of new updates"**


