
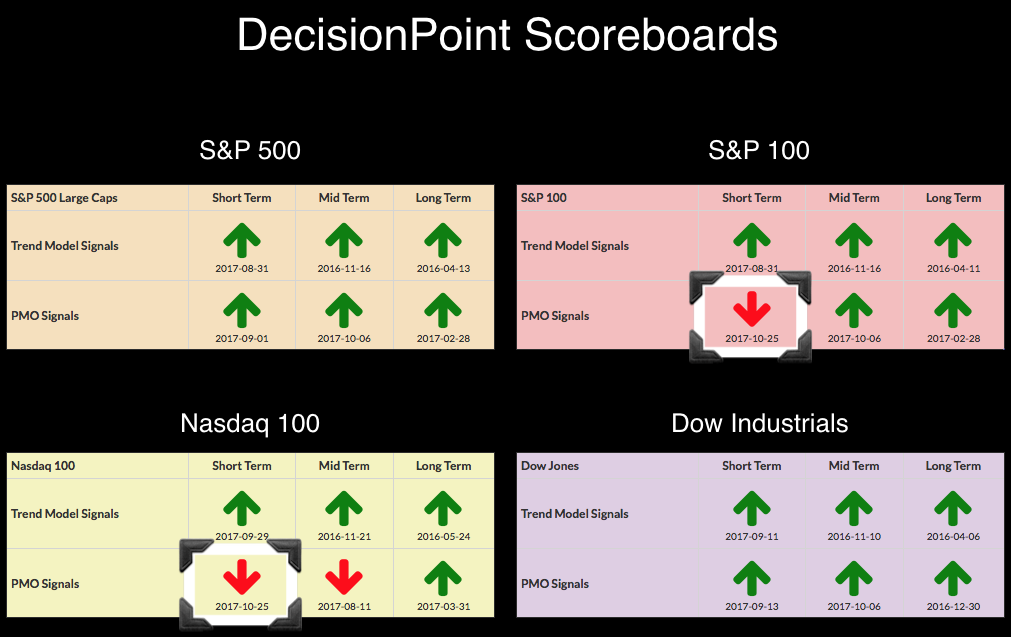
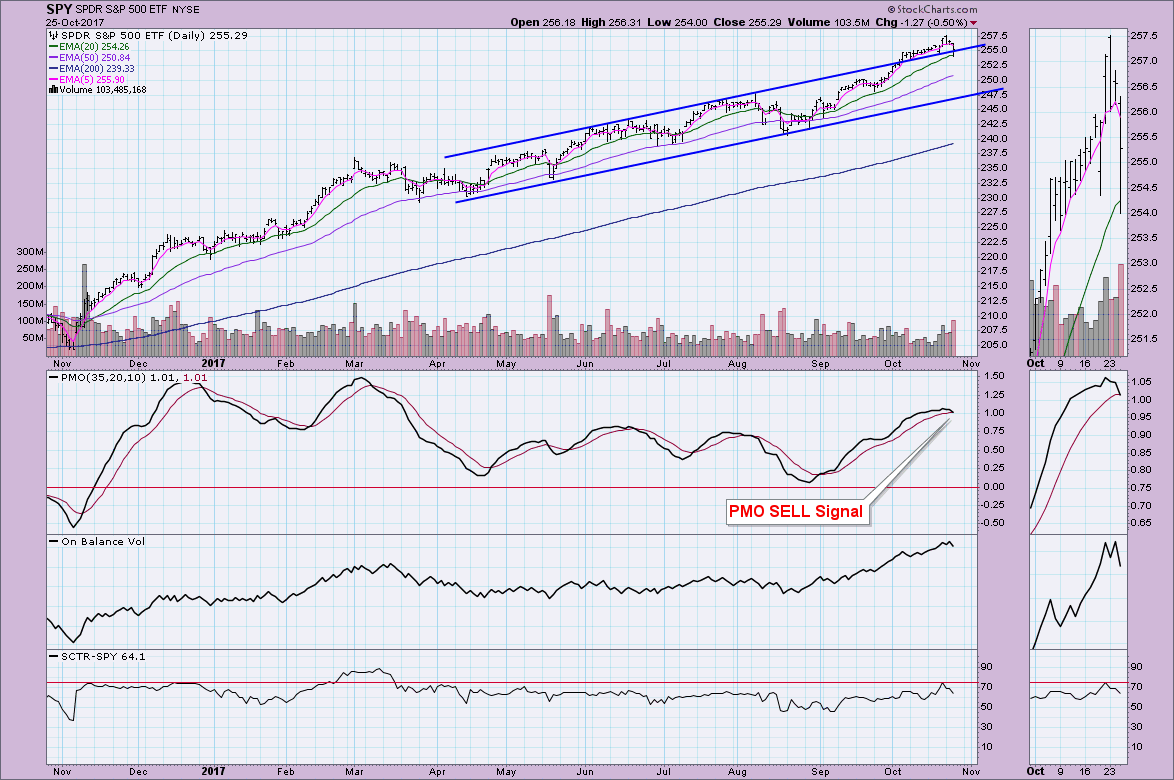
Two important changes occurred on our DP Scoreboards today. The OEX and NDX both logged new PMO SELL signals as their PMOs crossed below their signal lines. I had expected the SPX to follow suit, but by an incredibly thin margin, its PMO BUY signal survived. The SPY wasn't so fortunate as a new PMO SELL signal appeared on its daily chart. So, I know you're asking, "You mentioned a 'rally', how can you expect a rally with all those new SELL signals?" A rally 'pop' is just that. A quick or sharp move upward in one or two days. This can develop into more, but I use climactic indicators for their climaxes which generally result in market "pops" up or down.
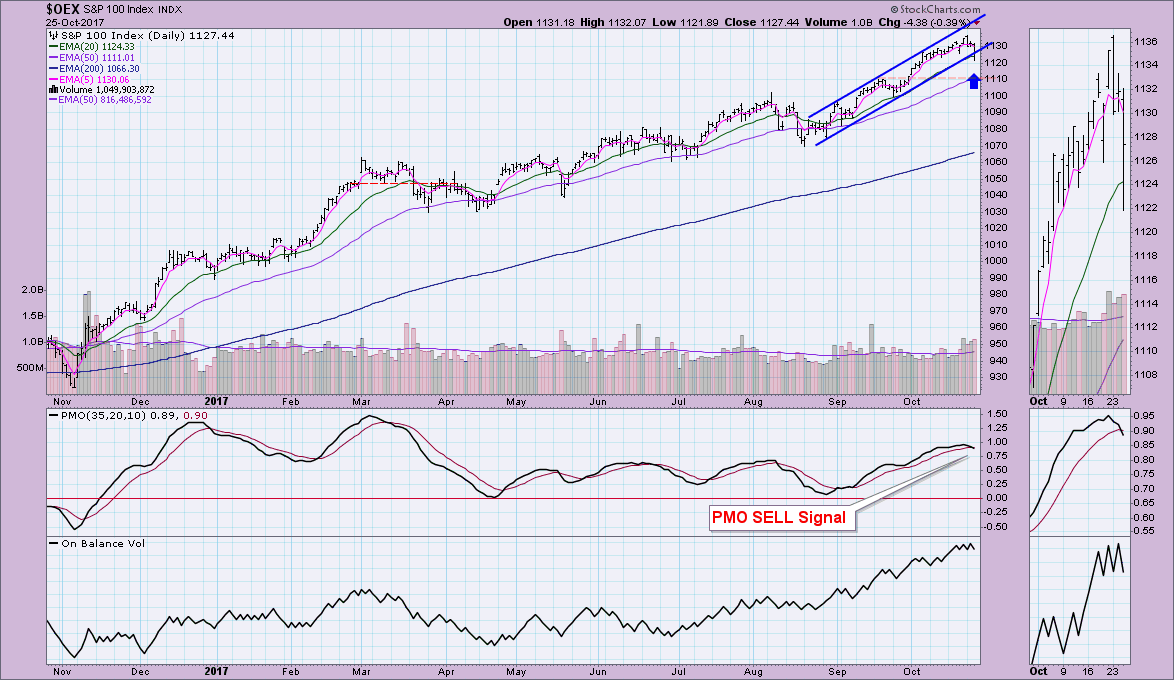
You'll notice on the OEX that price did drive below the rising bottoms trendline, but it did manage to close within...barely. Looking in the thumbnail, it looks less worrisome as price did close above the 20-EMA as well. I see a positive divergence between OBV and price. OBV tops/bottoms rising, price tops/bottoms are falling.
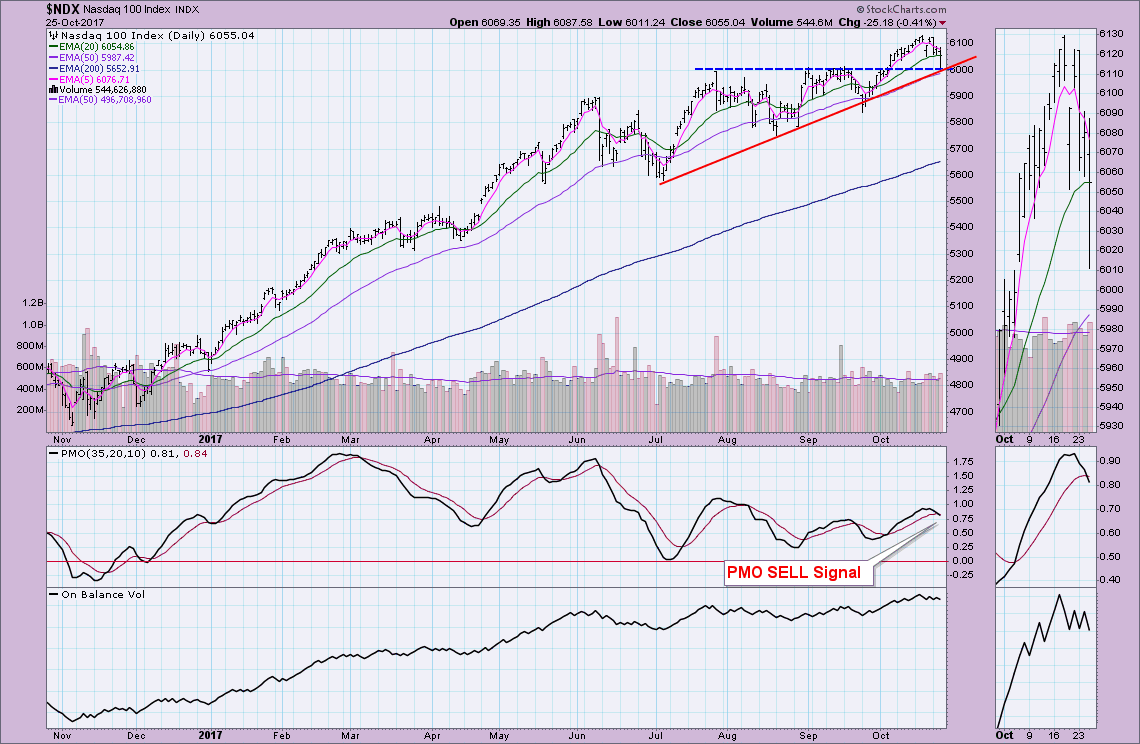
The NDX has now dropped back to support at 6000. It is also sitting on the rising bottoms trendline. This is very important support right now. A breakdown would nearly ensure a corrective move to 5900 if not further. Today's close was still above the 20-EMA so a complete breakdown really hasn't occurred just yet.
The purpose of the DecisionPoint Alert Daily Update is to quickly review the day's action, internal condition, and Trend Model status of the broad market (S&P 500), the nine SPDR Sectors, the U.S. Dollar, Gold, Crude Oil, and Bonds. To ensure that using this daily reference will be quick and painless, we are as brief as possible, and sometimes we let a chart speak for itself.
SIGNALS: Here we include charts of any important signal changes triggered today by our Intermediate-Term Trend Model.
NO NEW ITTM SIGNALS TO REPORT.
NOTE: Mechanical trading model signals define the implied bias of the price index based upon moving average relationships, but they do not necessarily call for a specific action. They are information flags that should prompt chart review. Further, they do not call for continuous buying or selling during the life of the signal. For example, a BUY signal will probably return the best results if action is taken soon after the signal is generated. Additional opportunities for buying may be found as price zigzags higher, but the trader must look for optimum entry points. Conversely, exit points to preserve gains (or minimize losses) may be evident before the model mechanically closes the signal.
STOCKS
IT Trend Model: BUY as of 11/15/2016
LT Trend Model: BUY as of 4/1/2016
I talked about it on today's MWL show. On Friday, the broadcasters and guests on all of the financial news networks were beyond giddy as they said their goodbyes with yet more record highs. This is a clear signal that the market was going to give up some profits this week. I'm mad that I put in for a higher close this week during our MWL sentiment poll after I watched the news network party. Remember sentiment is contrarian. If everyone is ridiculously bullish, expect a reversal. Well, the reversal began on Monday and has continued. This could've been a much worse day when you look at the 10-minute bar chart. Price did manage to pick itself back up at the end of the day to close down 0.50%.
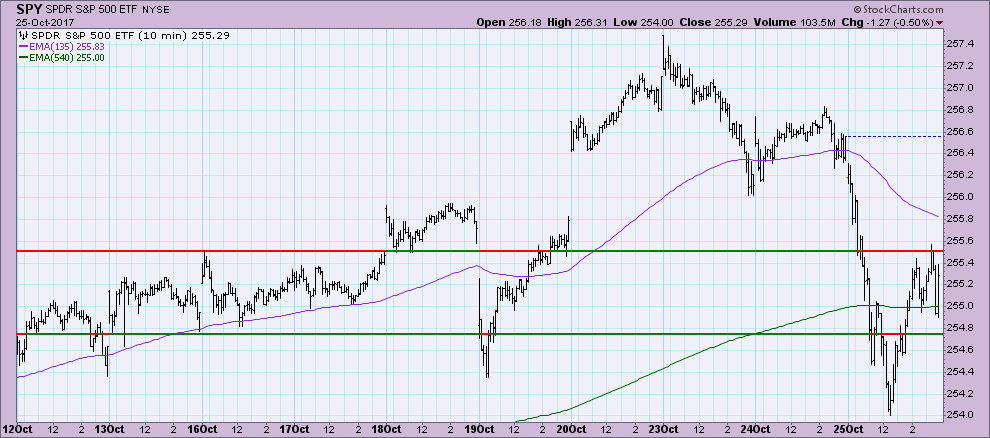
As with the OEX above, the SPY is seeing a breakdown. Only for the SPY, it is breaking back down into the rising trend channel I've annotated. It did close above the 20-EMA and the rising trend channel. The PMO did trigger a SELL signal in somewhat overbought territory. Support is critical right now and if we see the SPY close below the 20-EMA, I'd be looking for a continuation of a decline to $250 on the SPY.
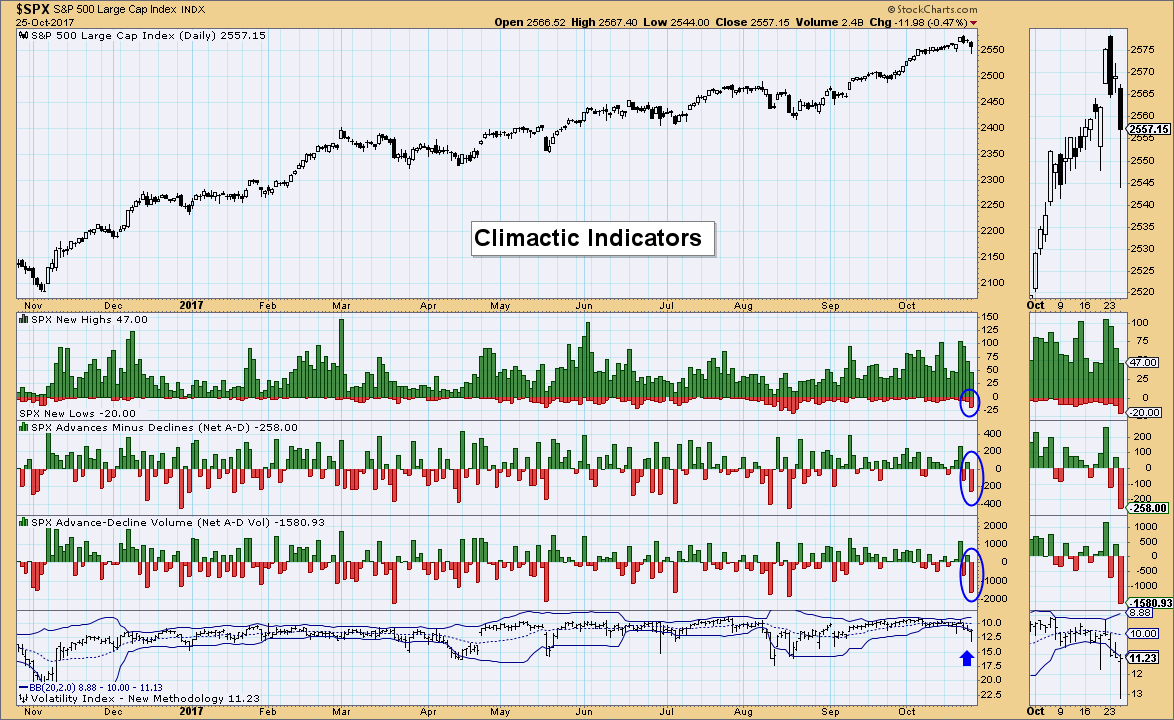
Climactic Indicators: The VIX has closed beneath the Bollinger Band for three days. Today we saw climactic readings to the downside. Typically these types of climaxes are initiation impulses or exhaustion readings. I would look at the last three days of decline and suggest that this is a selling exhaustion. When we get a very short-term selling exhaustion, expect to see a rally "pop" the next day or two. As I said above, 'pops' can turn into a new trend, but these indicators I use to identify possible climaxes that point to market direction for a day or two.
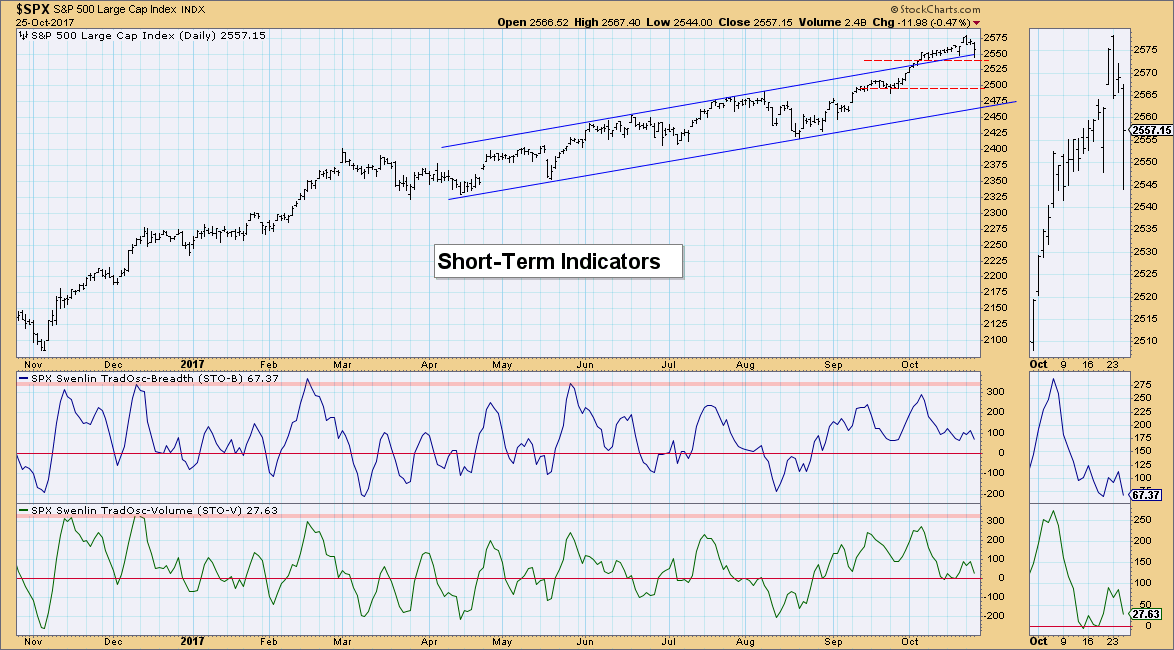
Short-Term Indicators: We are seeing hesitation by these indicators to pick a side. It was positive to see them unwind out of overbought territory during a small rally, but right now they are somewhat directionless. They remain above the zero line which is positive, but the decline is looking worrisome. A strong bull market should keep these indicators oscillating above the zero line. A dip below will be a caution flag.
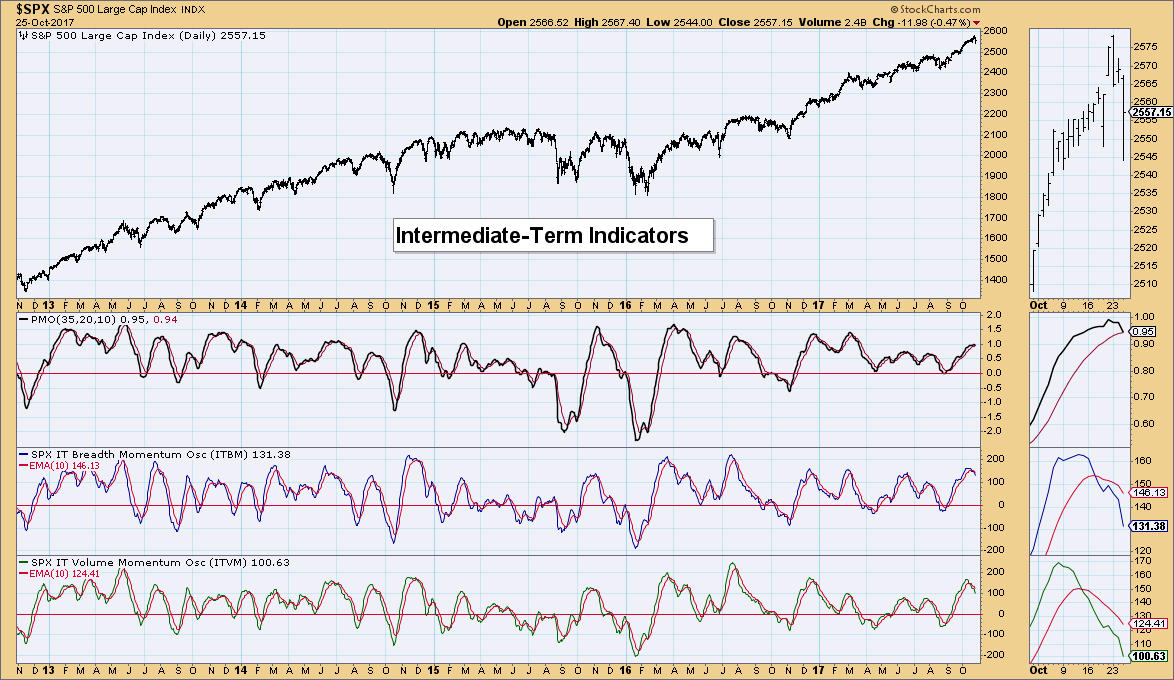
Intermediate-Term Indicators: I do not like the configuration of the IT indicators. It appeared they were going to turn back around, but with the PMO failing as well, it's time to be cautious, possibly moving more to cash or tightening stops on investments.
Conclusion: We are likely to see a rally pop tomorrow, or basically a blow off. After that, consolidation or decline is likely given the negative configuration of short- and intermediate-term indicators.
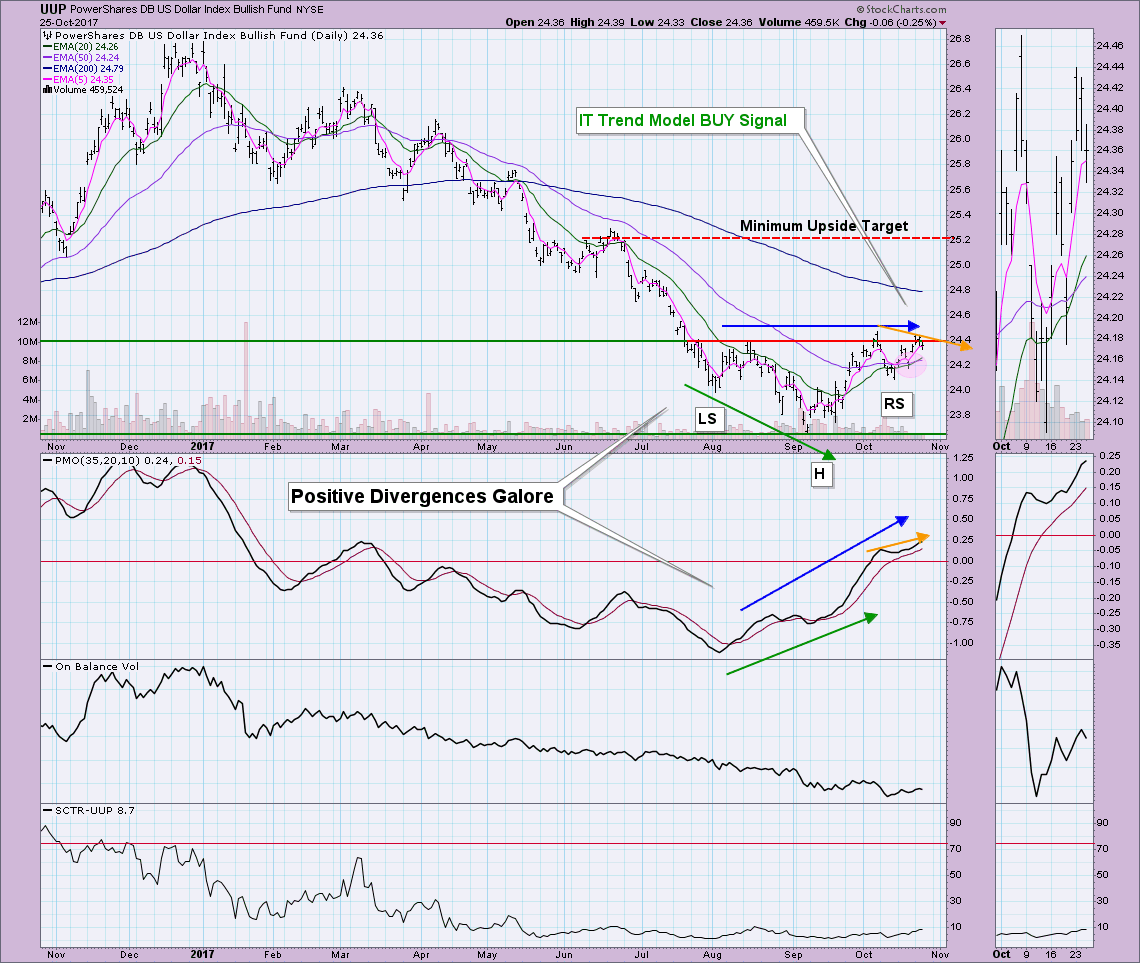
DOLLAR
IT Trend Model: NEUTRAL as of 3/21/2016
LT Trend Model: SELL as of 05/24/2017
I wrote about the Dollar on Monday and my analysis hasn't really changed. I'm bullish on the Dollar. The chart pattern (reverse head and shoulders) is bullish. The new ITTM BUY signal is bullish. Then there are a number of positive divergences in different timeframes between PMO and price.
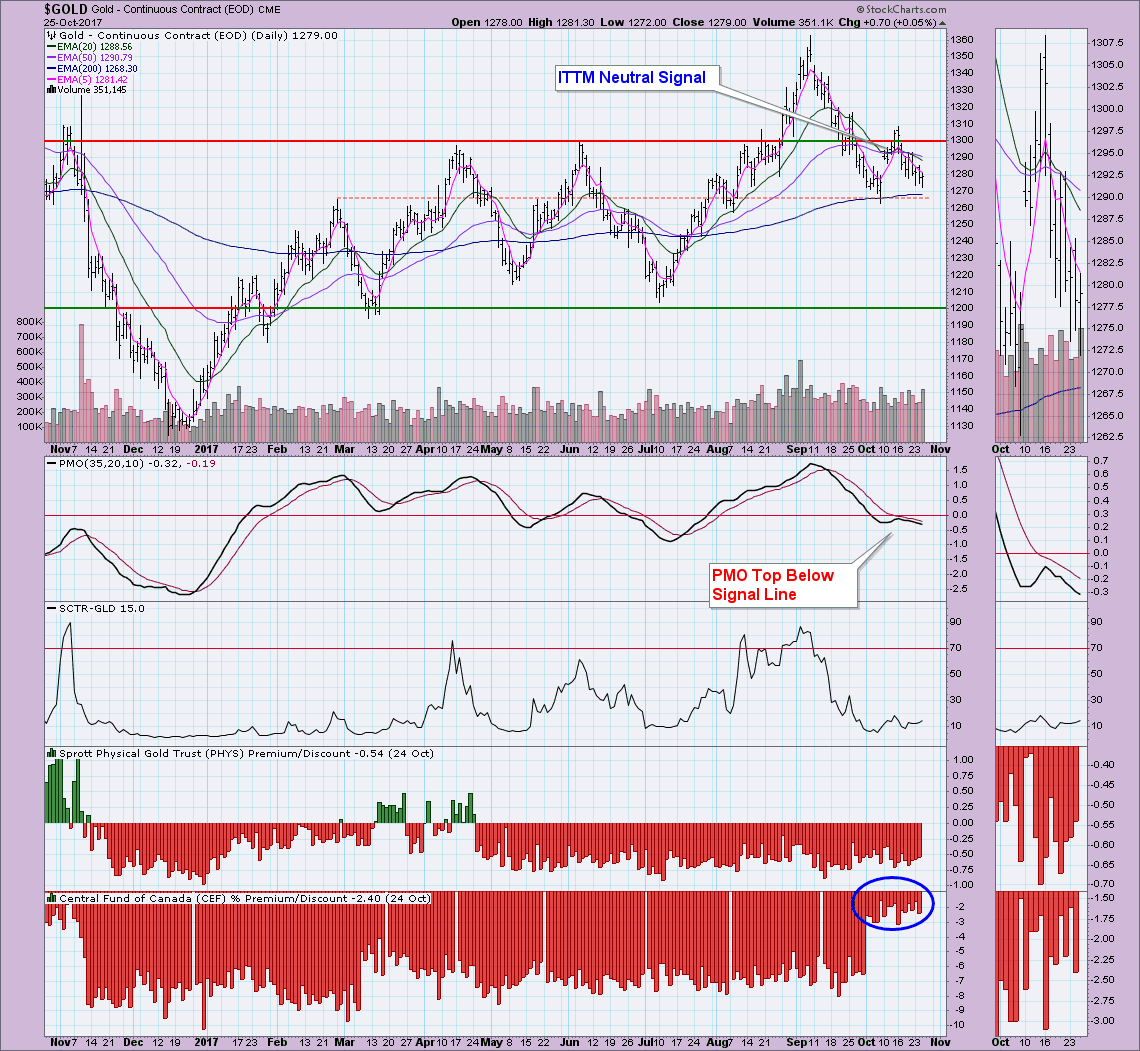
GOLD
IT Trend Model: NEUTRAL as of 10/20/2017
LT Trend Model: BUY as of 4/12/2017
I'm bearish on Gold. The head fake or bear kiss on the PMO in mid-October is bearish and the PMO is still falling. Support is nearing at about 1265 or 1270, but indicators aren't in line with a bounce here. I also wanted to point out that investors aren't bearish enough to suggest a new rally. The discounts on the closed end Gold and Silver funds (CEF and PHYS) aren't deep enough.
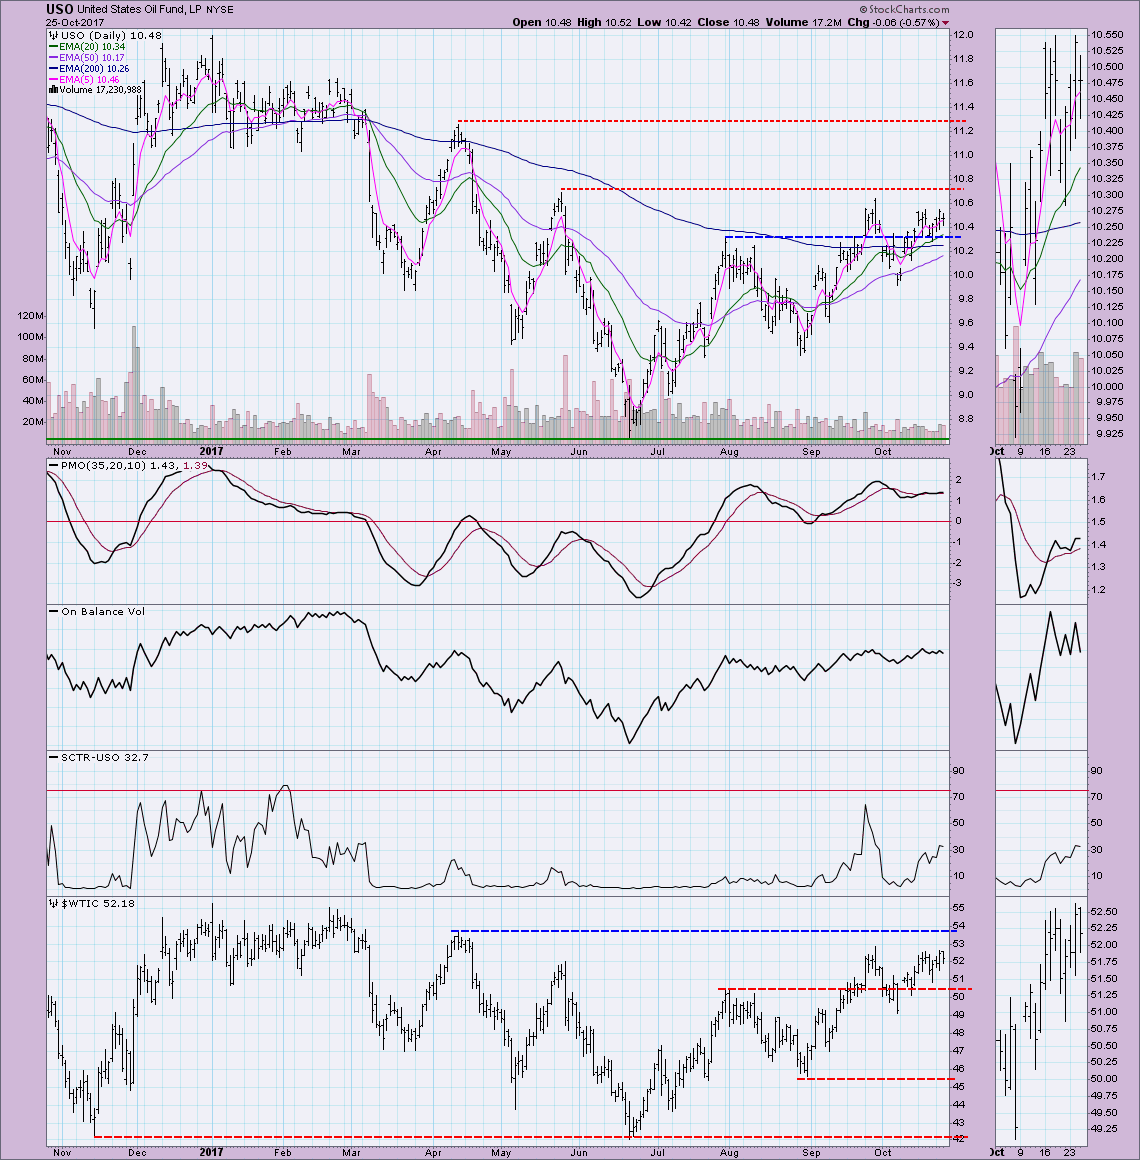
CRUDE OIL (USO)
IT Trend Model: SELL as of 8/29/2017
LT Trend Model: SELL as of 3/9/2017
USO has been chopping around just above $10.30. $10.70 is easily holding as resistance. The PMO is trending higher somewhat, but the hesitation and twitching tells me not to put too much weight on it. OBV is flat. I would expect to see more sideways movement between the $10.30 and $10.70 trading channel.
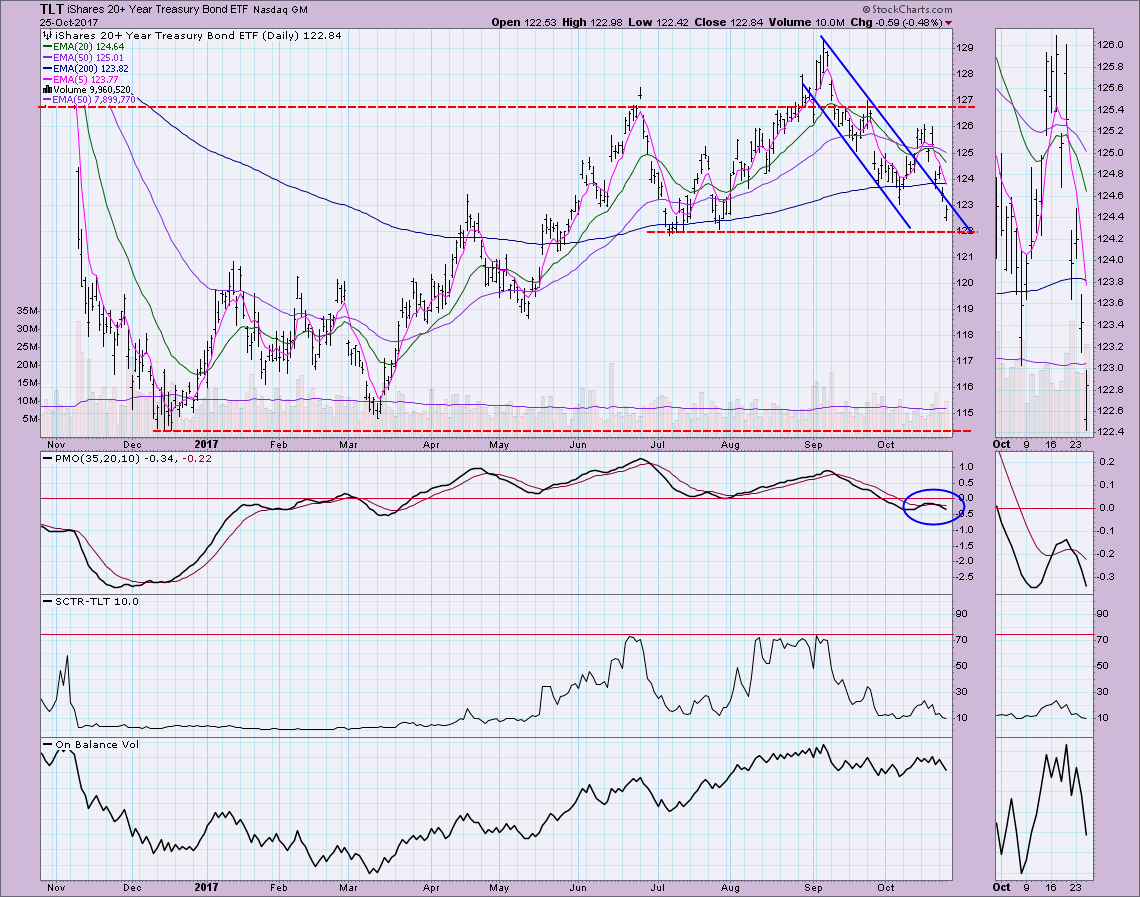
BONDS (TLT)
IT Trend Model: Neutral as of 10/5/2017
LT Trend Model: BUY as of 6/16/2017
TLT made a valiant effort to breakout from the steep declining trend channel, but gravity pulled it lower and it is now back within the declining trend channel. Important support has arrived at $122. The PMO head fake earlier this month is just more evidence that TLT is very weak. If $122 doesn't hold, I'd look for a drop to $120, along the Jan/Feb 2017 tops.
Helpful DecisionPoint Links:
DecisionPoint Shared ChartList and DecisionPoint Chart Gallery
Price Momentum Oscillator (PMO)
Swenlin Trading Oscillators (STO-B and STO-V)
Technical Analysis is a windsock, not a crystal ball.
Happy Charting!
- Erin
**Don't miss DecisionPoint Commentary! Add your email below to be notified of new updates"**


