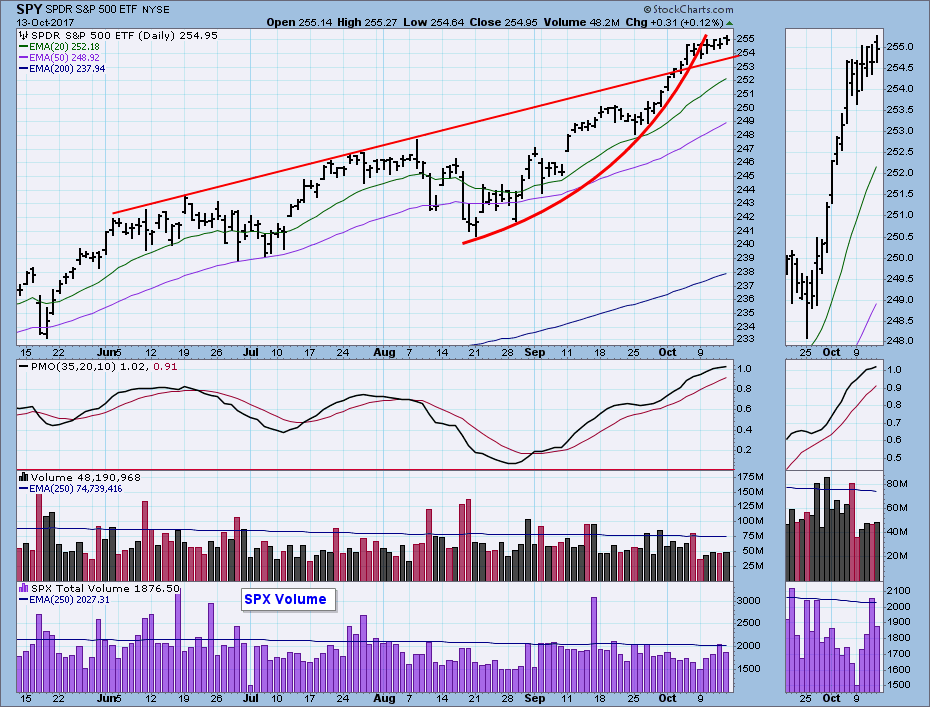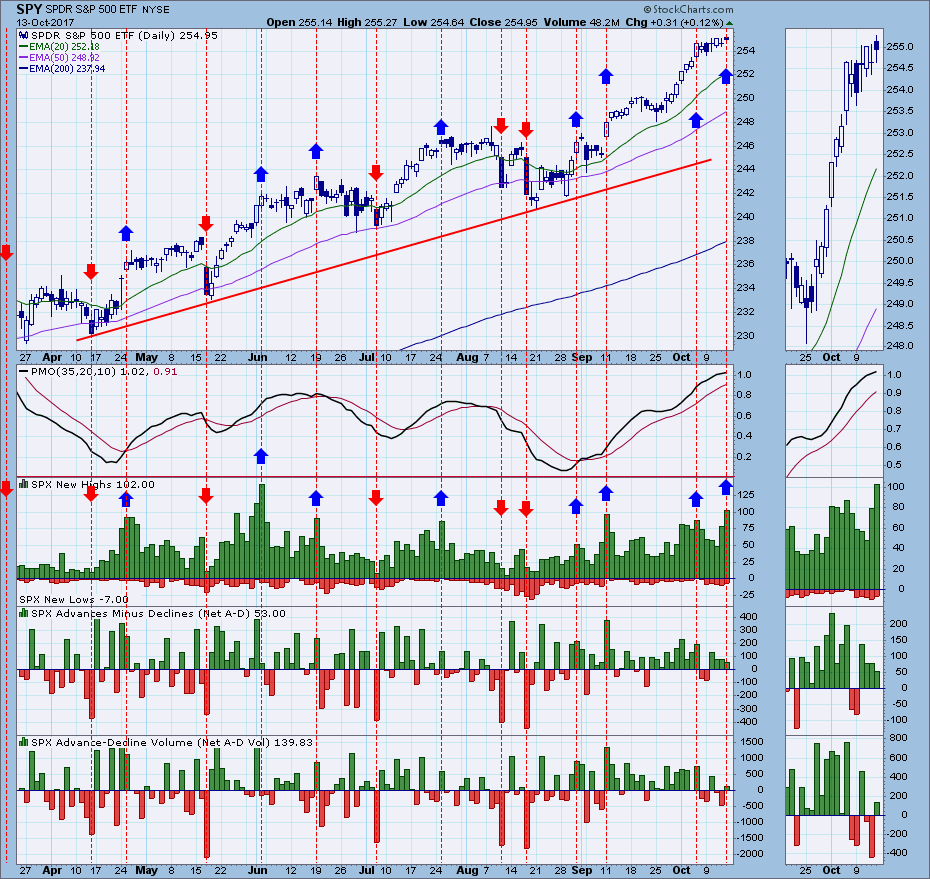
Last week I identified a short-term parabolic advance, a pattern in which price advances in an ever-steepening upward curve. Typically parabolics become too steep and they collapse. In this case price moved sideways through the curve, effectively neutralizing the bearish implications of the formation. We currently have a small rising flag formed by this week's price bars, which is bullish, but we need to look at the broader picture.
The DecisionPoint Weekly Wrap presents an end-of-week assessment of the trend and condition of the stock market (S&P 500), the U.S. Dollar, Gold, Crude Oil, and Bonds.
STOCKS
IT Trend Model: BUY as of 11/15/2016
LT Trend Model: BUY as of 4/1/2016
The daily PMO is well above the previous three tops, but there is plenty of room for it to move to the top of the one-year range shown on the chart. Price, as you can see, has moved above the top of the rising tops line drawn across the June, July, and August tops, but I doubt that this is significant in light of what we see on the weekly chart below.
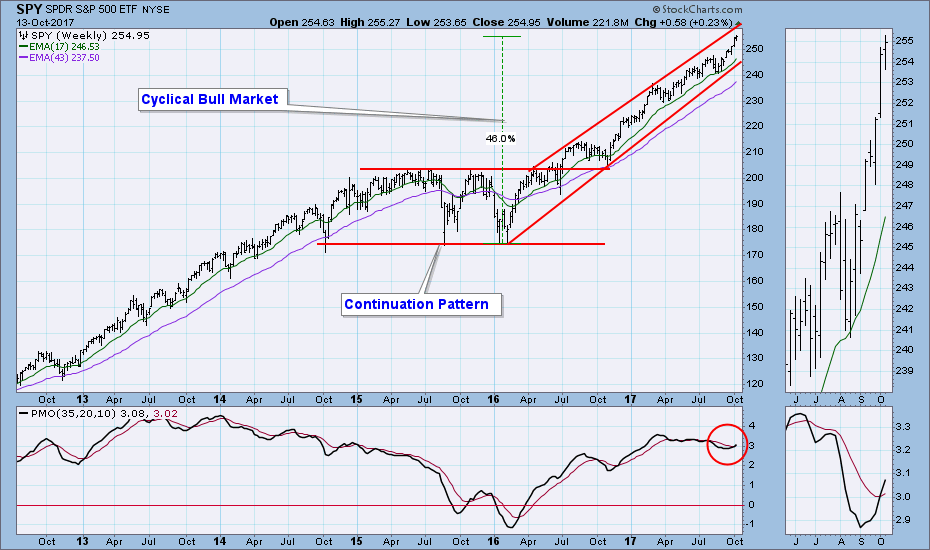
The weekly SPY chart remains bullish as price continues to rise within the cyclical bull market rising trend channel, but it is overbought within that context. To date the 17-month cyclical bull market gains are +46%.
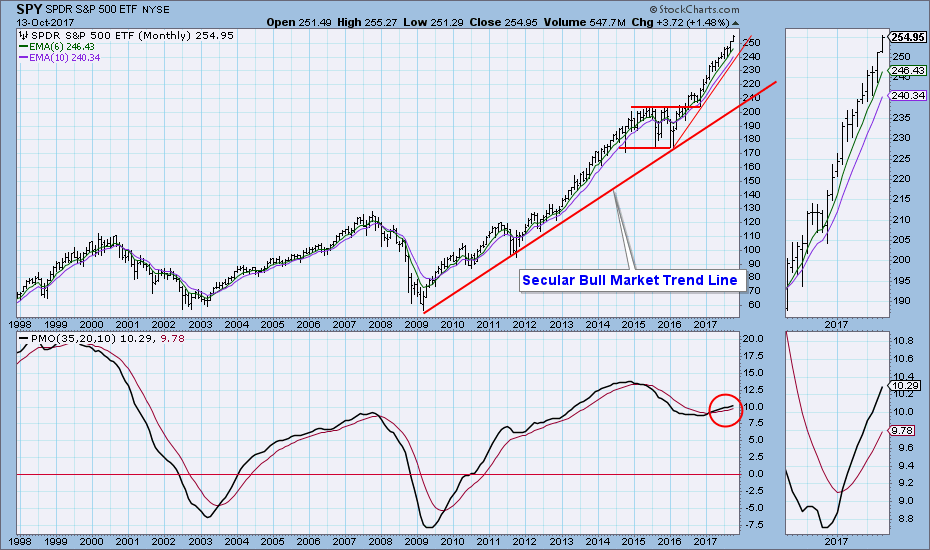
We are not due to look at the monthly chart yet, but I think we should be reminded of how steep the price advance has become, and how far price has departed from the secular bull market rising trend line.
Climactic Indicators: It looks to me as if there was a buying climax on Friday -- the number of new highs was the highest since early June. This is probably a sign that the up move has exhausted itself.
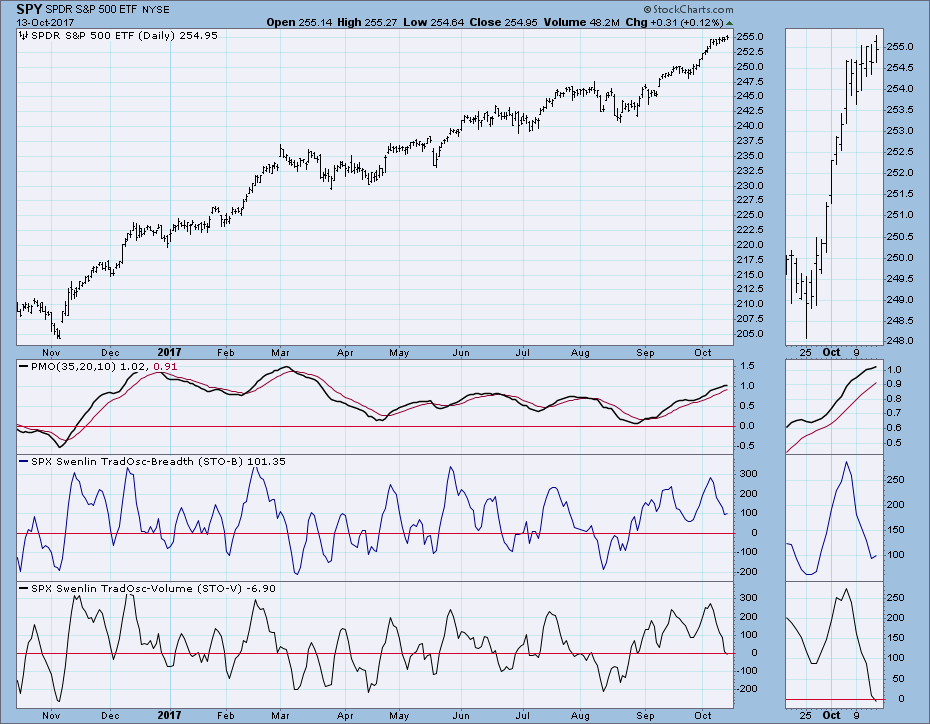
Short-Term Market Indicators: Notice how these indicators have fallen, while price has held its ground and even advanced slightly. This is an example of an "internal correction," and is bullish behavior in this time frame; however, there is plenty of room for the indicators to decline further before they become oversold relative to their normal range.
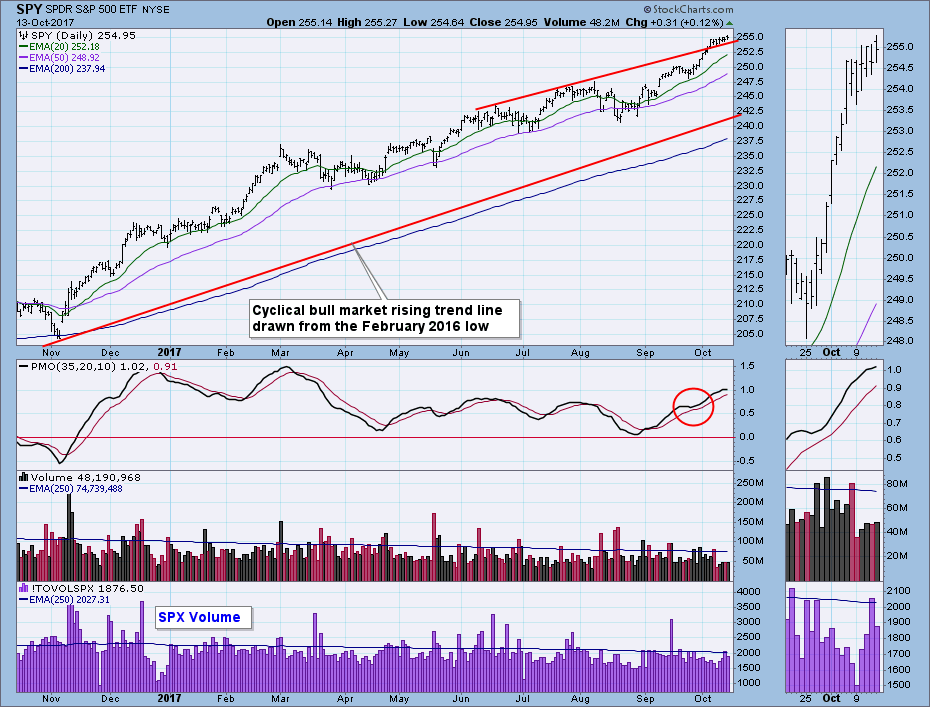
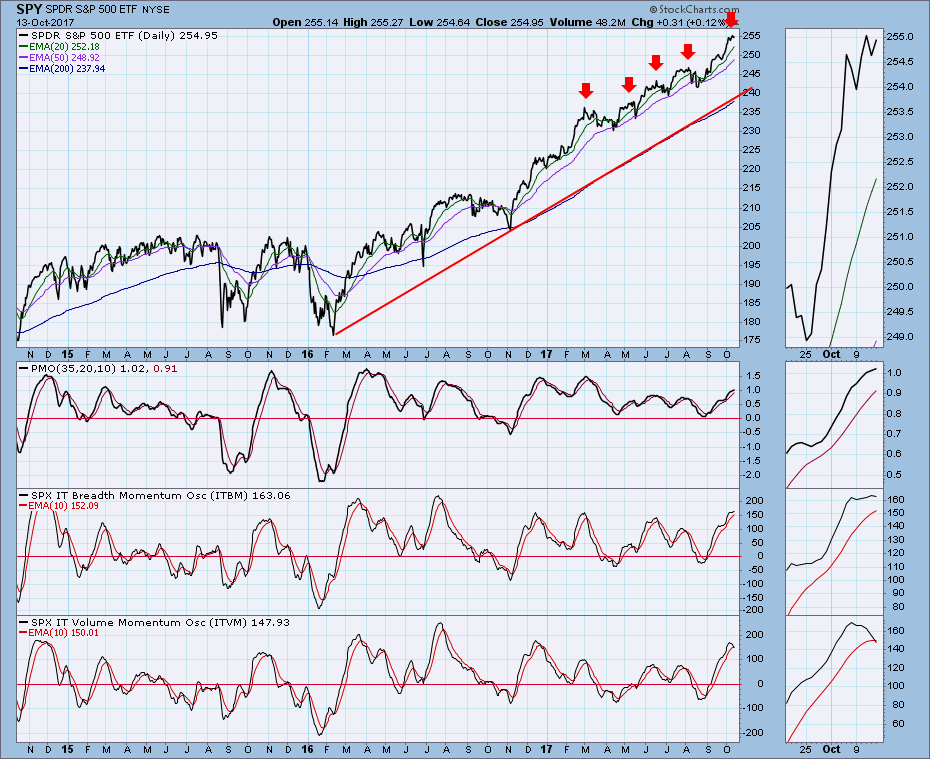
Intermediate-Term Market Indicators: These indicators are overbought and topping, and price is well above the rising trend line drawn from the February 2016 low. This looks precarious to me.
Conclusion: The market is overbought, extremely overbought in some cases. Short-term indicators show weakness in that time frame, while intermediate-term indicators are overbought and topping. The overlay of these two time frames tells me that we're headed for some trouble. That does not necessarily mean big trouble in this bull market, but we're still vulnerable for a pullback or consolidation. As I have been saying, the small magnitude corrections that we have observed most of this year are examples of what we can probably expect.
DOLLAR (UUP)
IT Trend Model: NEUTRAL as of 3/21/2017
LT Trend Model: SELL as of 5/24/2017
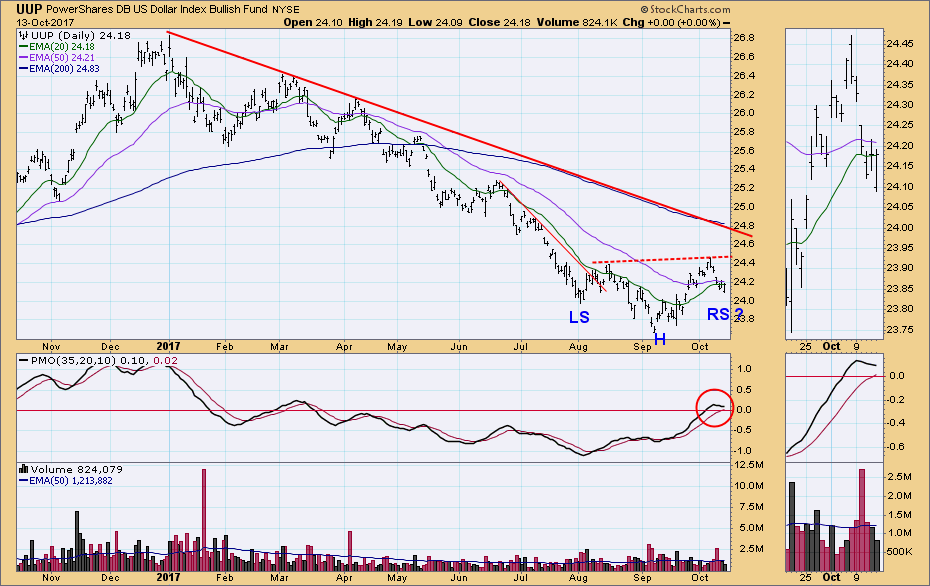
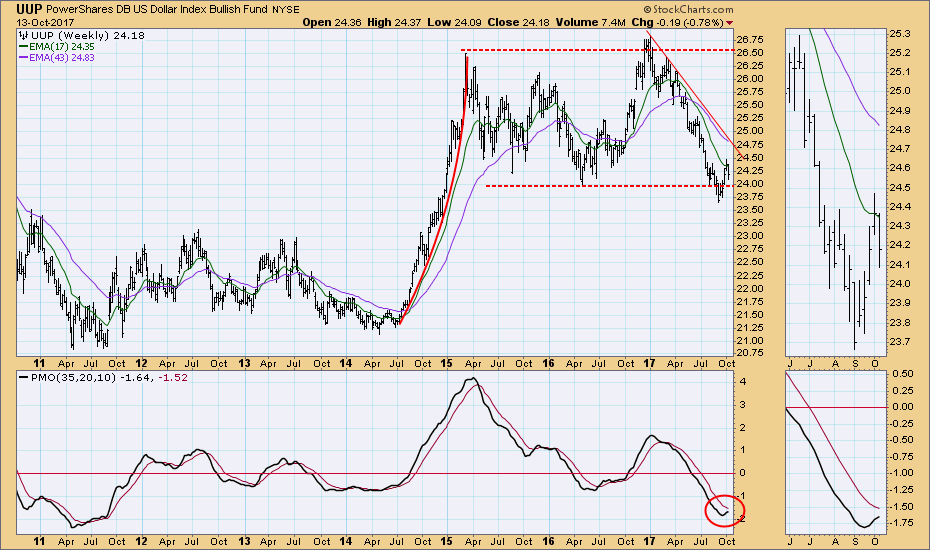
There is a possible reverse head and shoulders forming on the UUP daily chart. For it to execute, price needs to bottom soon, and then it needs to break up through the neckline drawn across the August and October tops.
The weekly PMO is rising, although it has decelerated in response to this week's price pullback. The line of support drawn across the 2016 low suggests a likely level for a bounce to initiate the right shoulder cited in the daily chart discussion.
GOLD
IT Trend Model: BUY as of 7/31/2017
LT Trend Model: BUY as of 4/12/2017
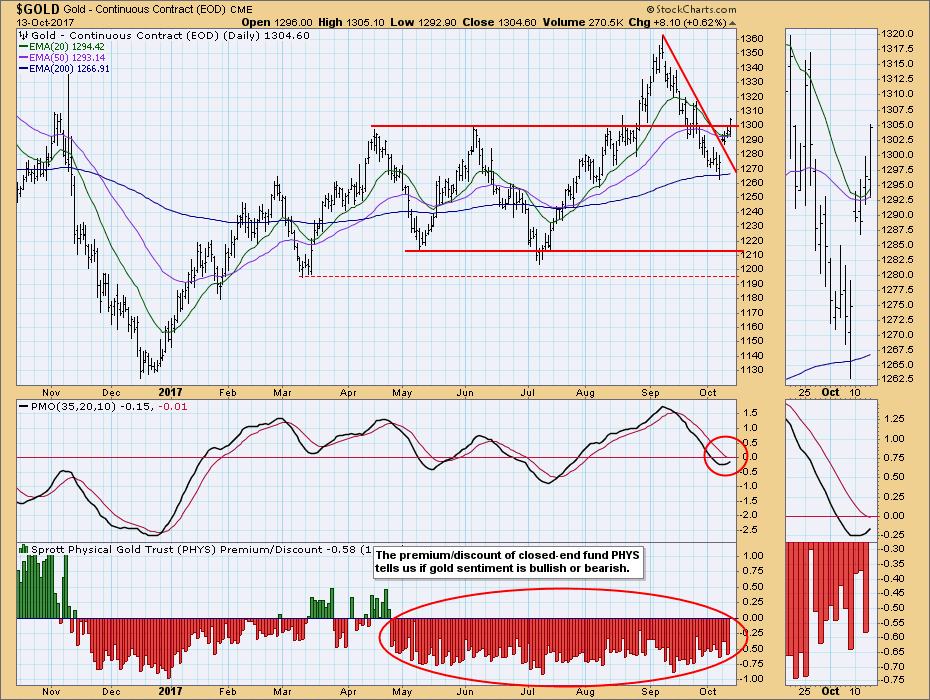
Gold has broken back above the horizontal resistance line, as well as the declining tops line drawn from the September top, and the daily PMO is rising again. While the chart is bullish, I feel that gold is still struggling, probably because sentiment remains bearish.
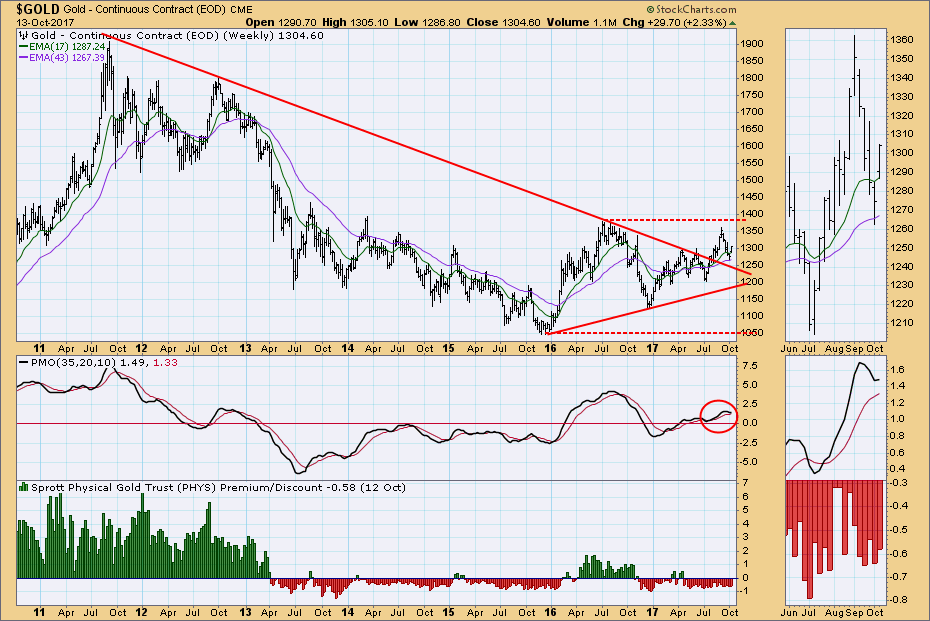
Since the beginning of this year price has moved higher, but the weekly PMO shows the stutter-step quality of internal strength.
CRUDE OIL (USO)
IT Trend Model: BUY as of 9/6/2017
LT Trend Model: SELL as of 3/9/2017
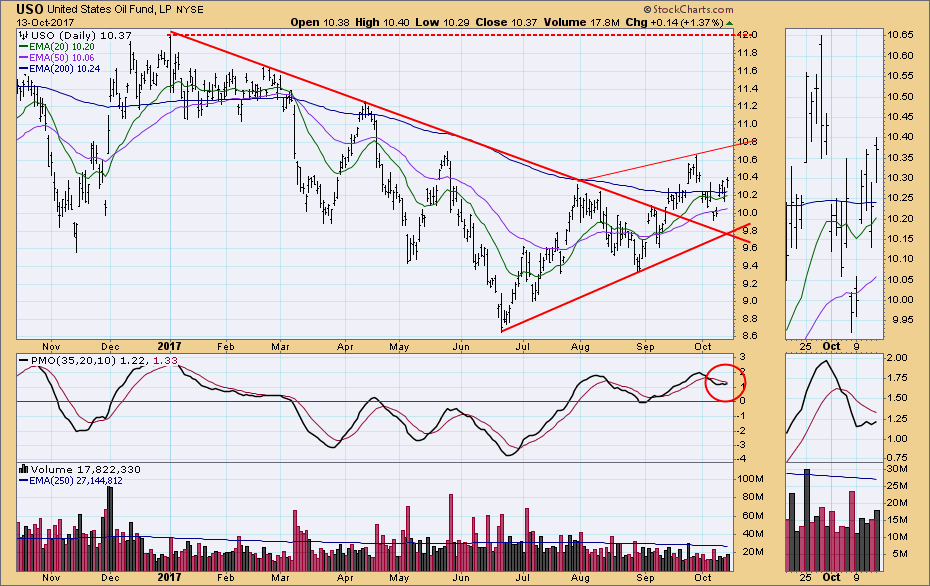
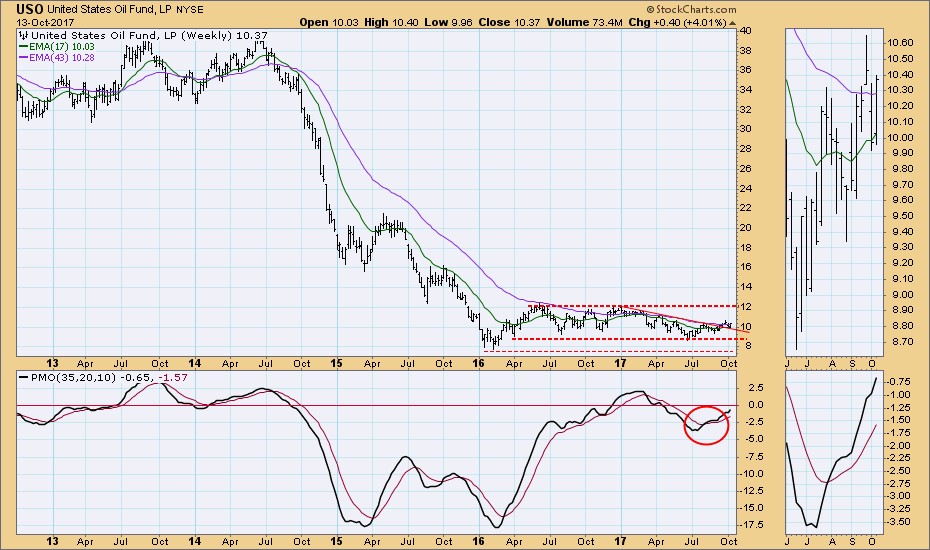
Last month price broke above a 10-month declining tops line, and it is in a rising trend. Also, the daily PMO is rising again.
This chart is bullish. The weekly PMO is rising, and there is plenty of room for price to rise before it hits resistance at the top of the trading channel.
BONDS (TLT)
IT Trend Model: NEUTRAL as of 10/5/2017
LT Trend Model: BUY as of 6/16/2017
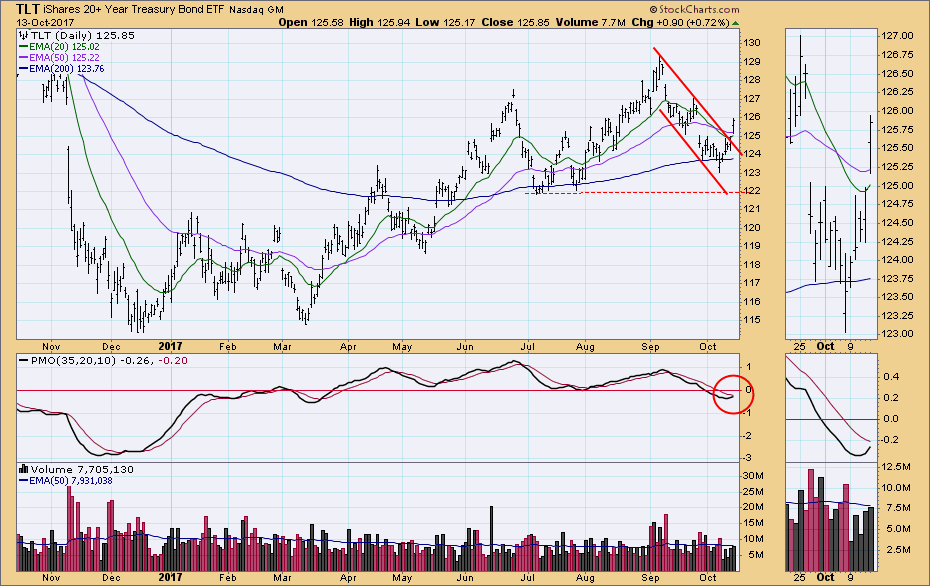
On the TLT daily chart price has broken up through the top of a declining trend channel, and the daily PMO has turned up. The IT Trend Model recently changed from BUY to NEUTRAL, but as long as price remains above the 20EMA and 50EMA, they will converge and a crossover BUY signal will result.
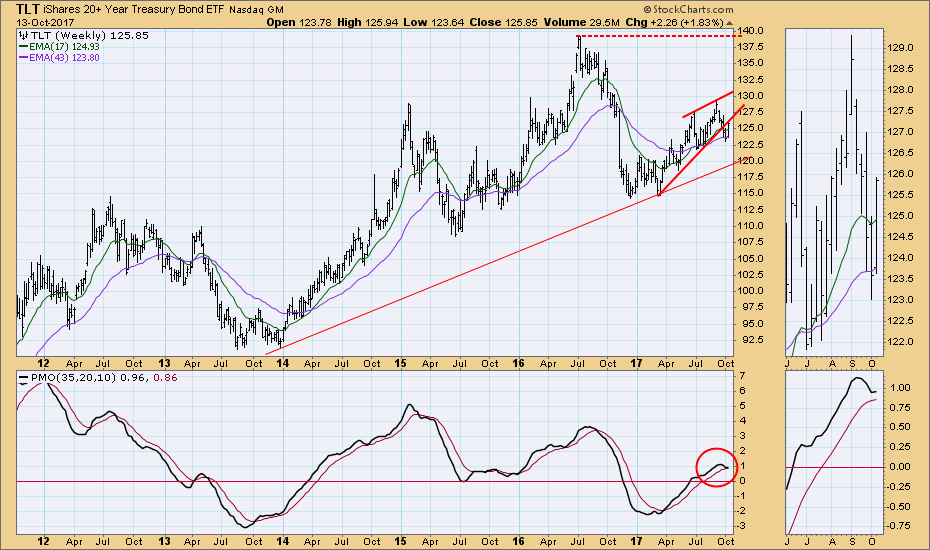
The weekly chart shows price breaking down from a rising wedge last week, and this week price has snapped back to the broken support line, now a line of resistance. The weekly PMO turned up, but just barely. The bullish action on the daily chart supports the view that the longer-term is turning bullish as well.
**Don't miss any of the DecisionPoint commentaries! Go to the "Notify Me" box toward the end of this blog page to be notified as soon as they are published.**
Technical Analysis is a windsock, not a crystal ball.
Happy Charting!
- Carl
NOTE: The signal status reported herein is based upon mechanical trading model signals, specifically, the DecisionPoint Trend Model. They define the implied bias of the price index based upon moving average relationships, but they do not necessarily call for a specific action. They are information flags that should prompt chart review. Further, they do not call for continuous buying or selling during the life of the signal. For example, a BUY signal will probably (but not necessarily) return the best results if action is taken soon after the signal is generated. Additional opportunities for buying may be found as price zigzags higher, but the trader must look for optimum entry points. Conversely, exit points to preserve gains (or minimize losses) may be evident before the model mechanically closes the signal.
Helpful DecisionPoint Links:
DecisionPoint Shared ChartList and DecisionPoint Chart Gallery
Price Momentum Oscillator (PMO)
Swenlin Trading Oscillators (STO-B and STO-V)

