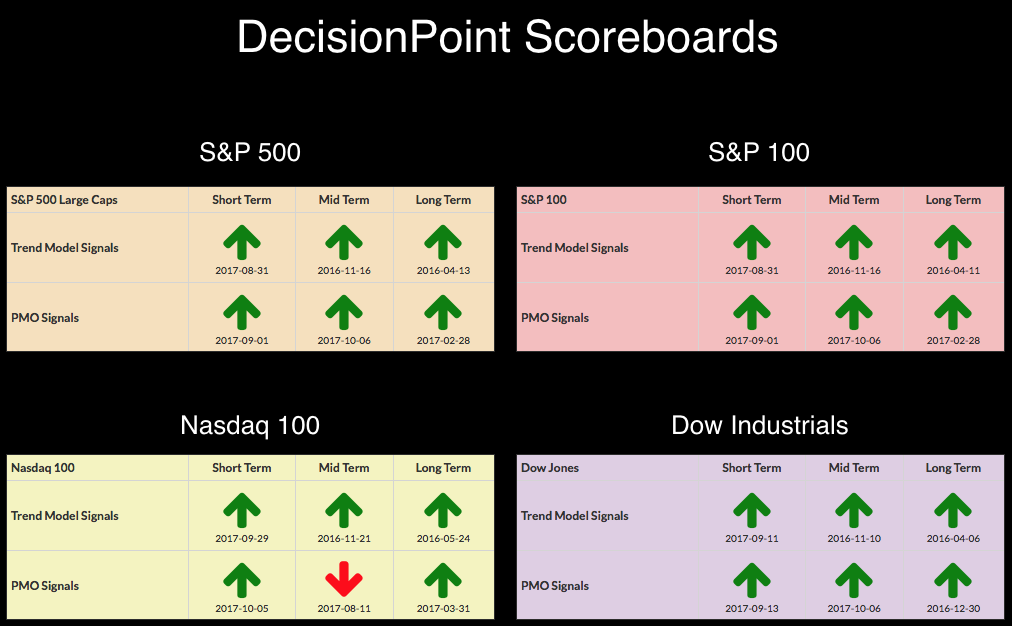
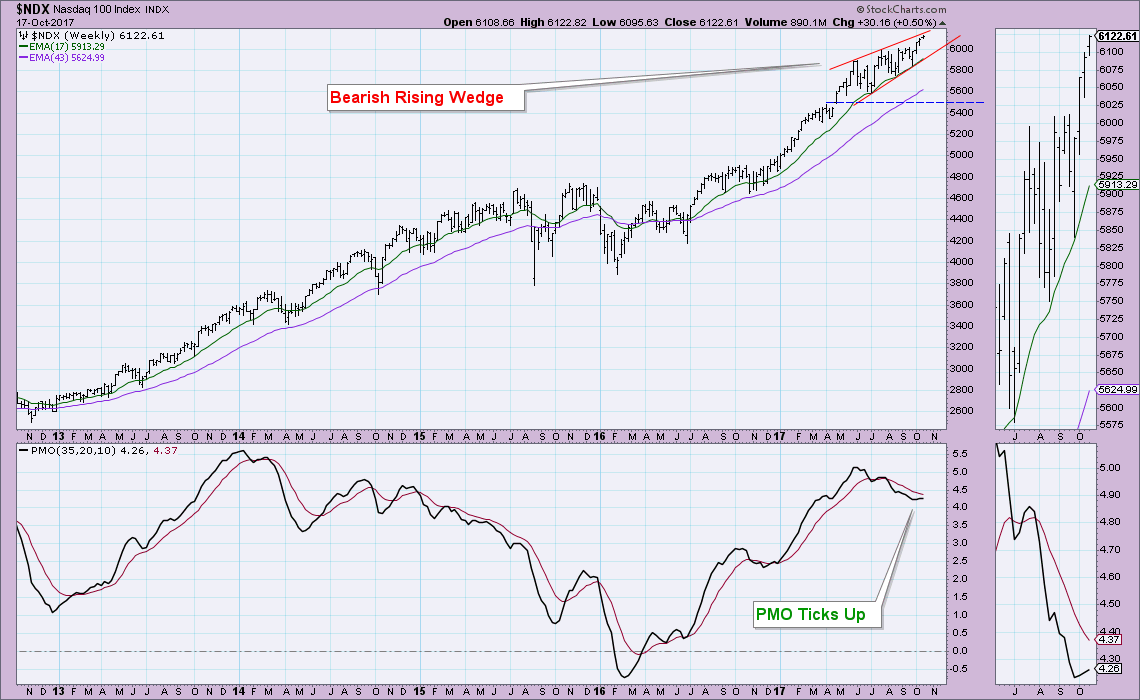
 Teflon rally, perma-rally, overbought rally, irrational exuberance...whatever you call it, our indicators are suggesting at a least pause in the action, if not a pullback. Looking at the DP Scoreboards, we see all green arrows (buy signals) except for the IT PMO signal on the NDX. Although the NDX's weekly PMO is rising, the margin remains somewhat wide between it and its signal line as you can see in the weekly chart of the NDX below.
The purpose of the DecisionPoint Alert Daily Update is to quickly review the day's action, internal condition, and Trend Model status of the broad market (S&P 500), the nine SPDR Sectors, the U.S. Dollar, Gold, Crude Oil, and Bonds. To ensure that using this daily reference will be quick and painless, we are as brief as possible, and sometimes we let a chart speak for itself.
SIGNALS: Here we include charts of any important signal changes triggered today by our Intermediate-Term Trend Model.
NO NEW SIGNAL CHANGES TO REPORT.
NOTE: Mechanical trading model signals define the implied bias of the price index based upon moving average relationships, but they do not necessarily call for a specific action. They are information flags that should prompt chart review. Further, they do not call for continuous buying or selling during the life of the signal. For example, a BUY signal will probably return the best results if action is taken soon after the signal is generated. Additional opportunities for buying may be found as price zigzags higher, but the trader must look for optimum entry points. Conversely, exit points to preserve gains (or minimize losses) may be evident before the model mechanically closes the signal.
STOCKS
IT Trend Model: BUY as of 11/15/2016
LT Trend Model: BUY as of 4/1/2016
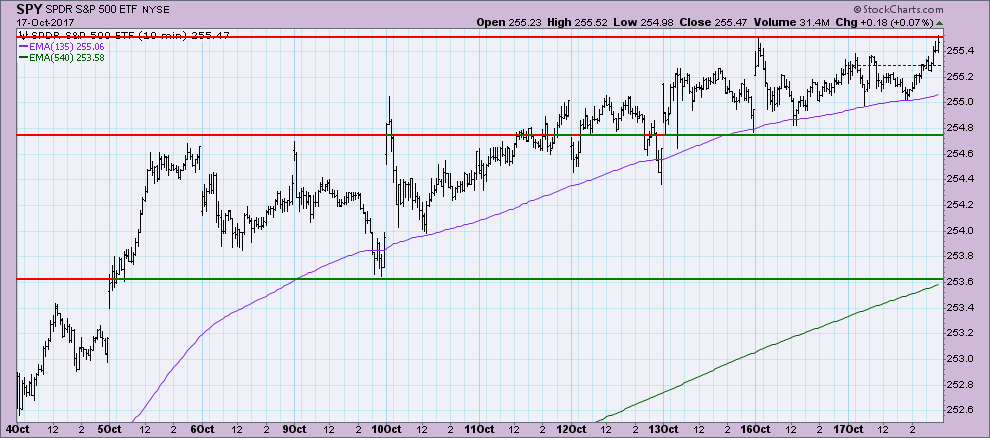
Today a new all-time high was set for both the SPX and the SPY. Looking at the 10 minute bar chart, we can see that for the last three days price has been essentially moving sideways.
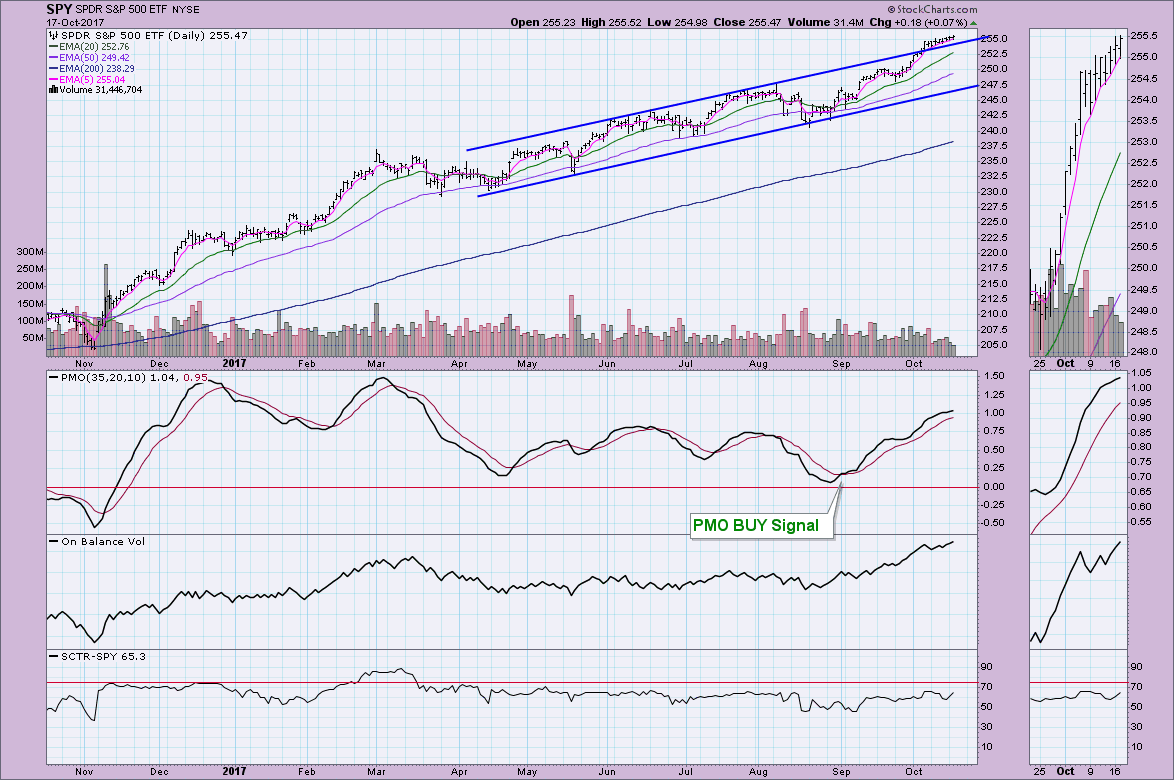
The SPY chart displays healthy indicators and support being held along the top of the longer-term rising trend channel.
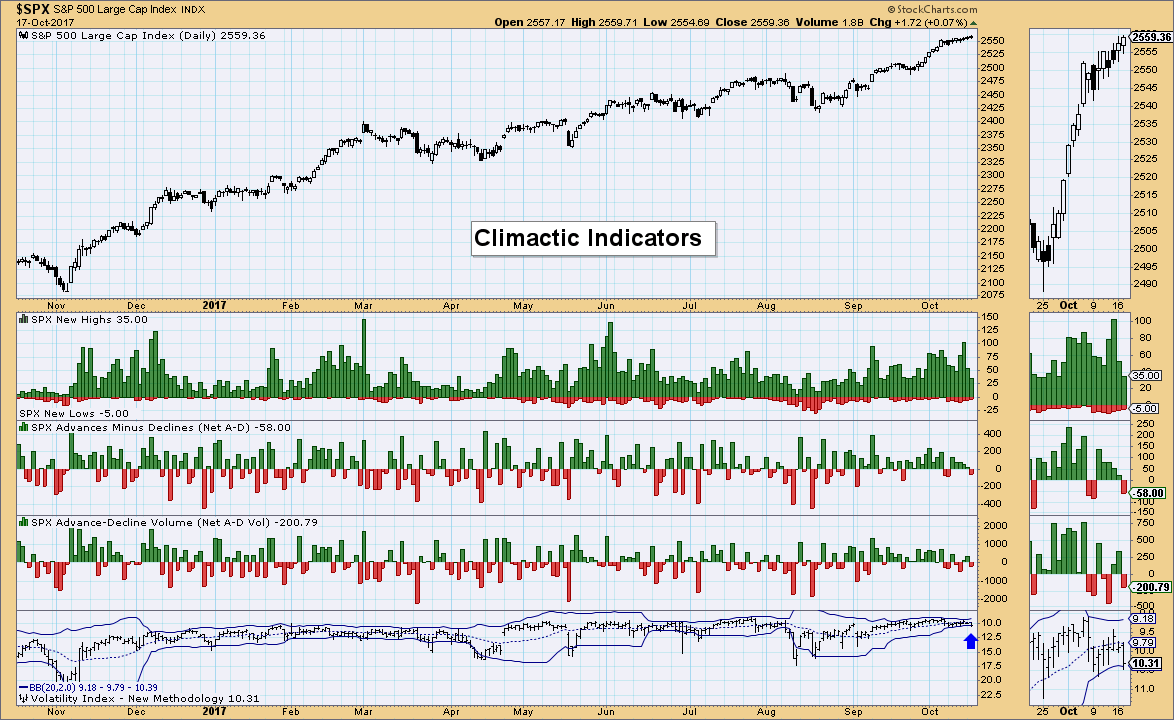
Ultra-Short-Term Indicators: Carl wrote about a possible buying exhaustion shaping up on Friday. Notice that despite new all-time highs being set, the Net A-D data shows declines led advances. The Bollinger Bands on the VIX are so thin, I don't think they're particularly helpful but you could make a case for some bearishness given the rising VIX today. It appears to me the market is exhausted.
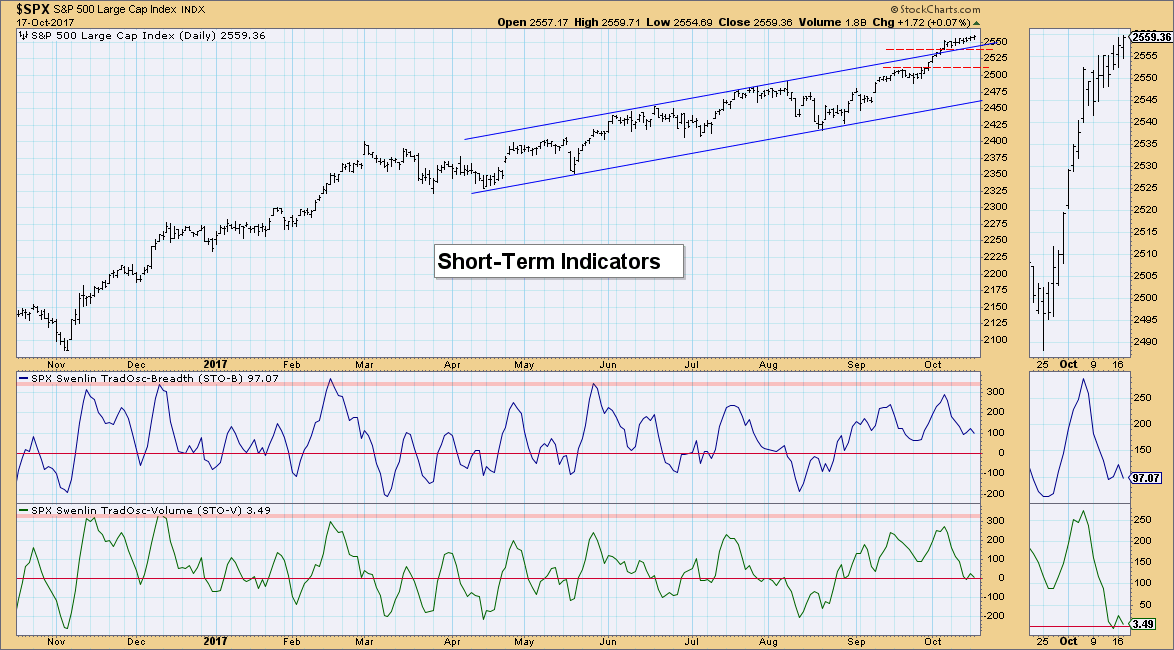
Short-Term Indicators: Notice that the short-term indicators have both topped. This would suggest lower prices in the coming week or two.
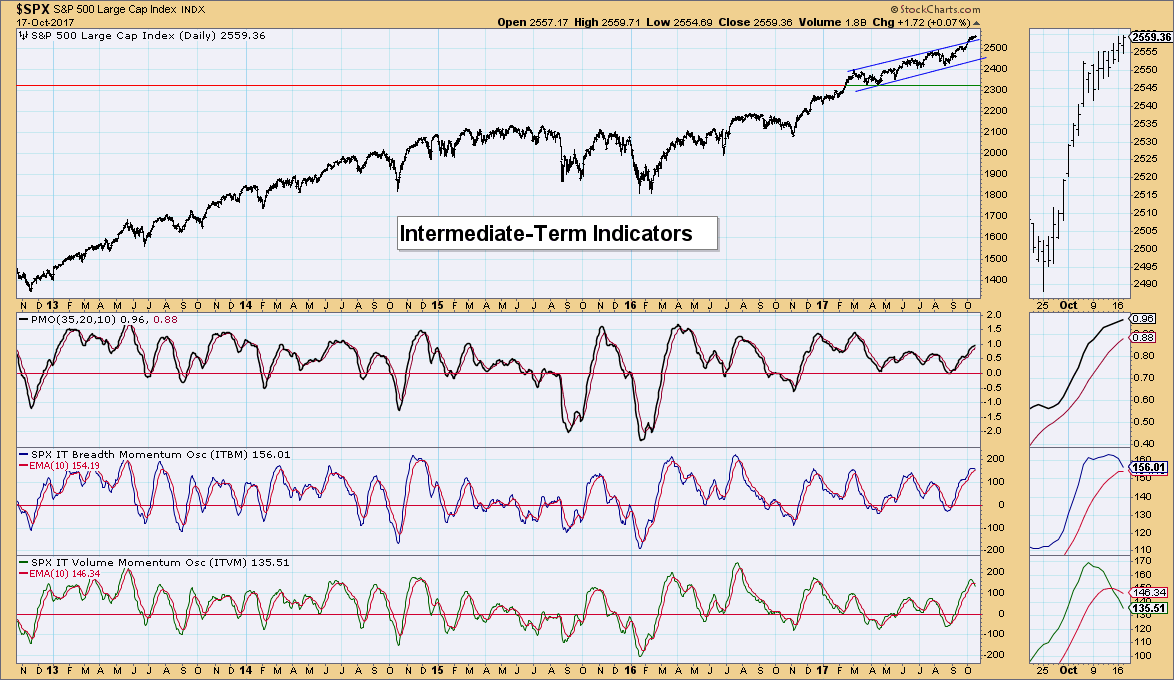
Intermediate-Term Indicators: These indicators certainly suggest the market is exhausted and will likely be turning over.
Conclusion: Despite setting new all-time highs, the indicators are suggesting the market is exhausted. I would expect to see a pullback very soon. Not convinced we'll see a correction given the rising PMOs, but a pause or pullback makes sense.
DOLLAR
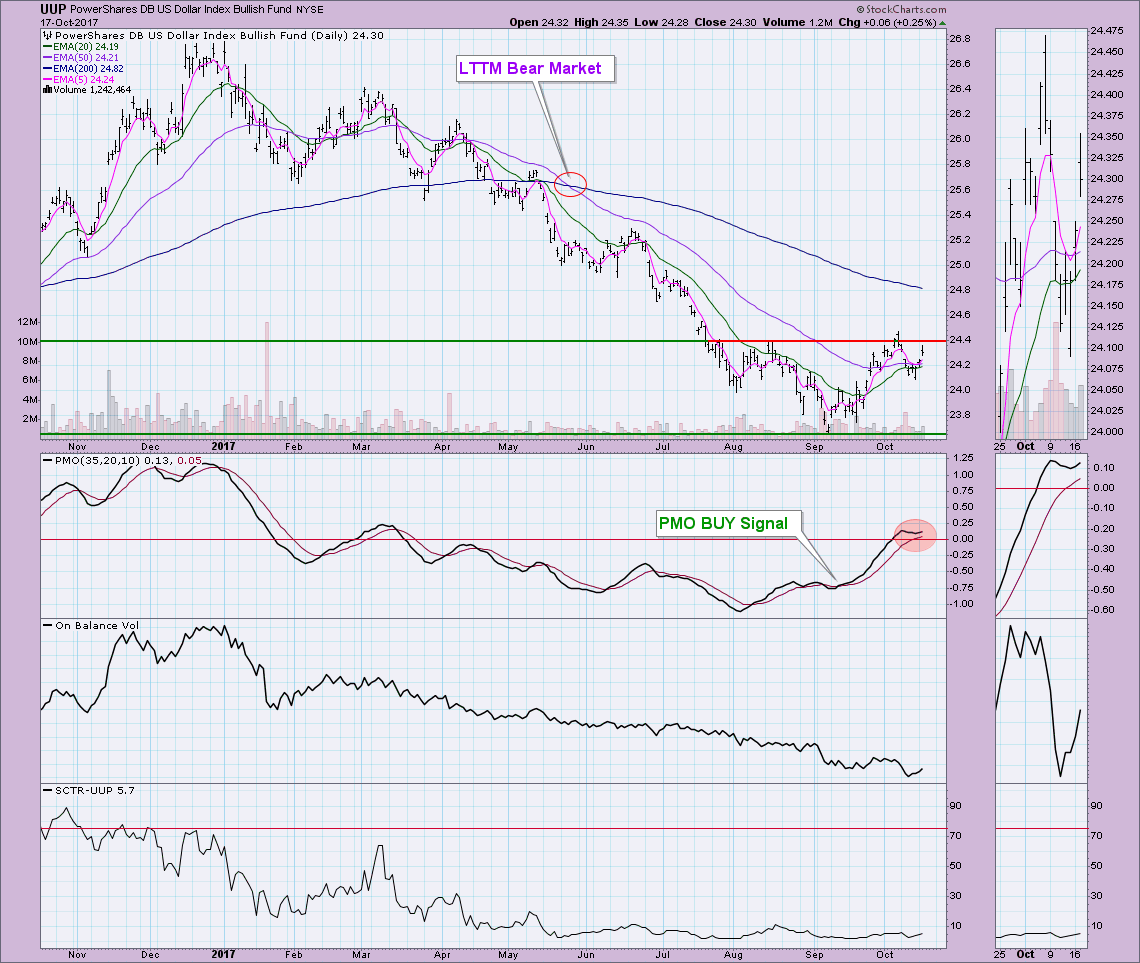
IT Trend Model: NEUTRAL as of 3/21/2016
LT Trend Model: SELL as of 05/24/2017
The Dollar has reached overhead resistance. However, the PMO certainly suggests that resistance will be broken. The OBV has turned with the rising volume. The SCTR hasn't reacted, but it is a longer-term indicator. A perfect confirmation would be a 20/50-EMA positive crossover that would trigger an IT Trend Model BUY signal.
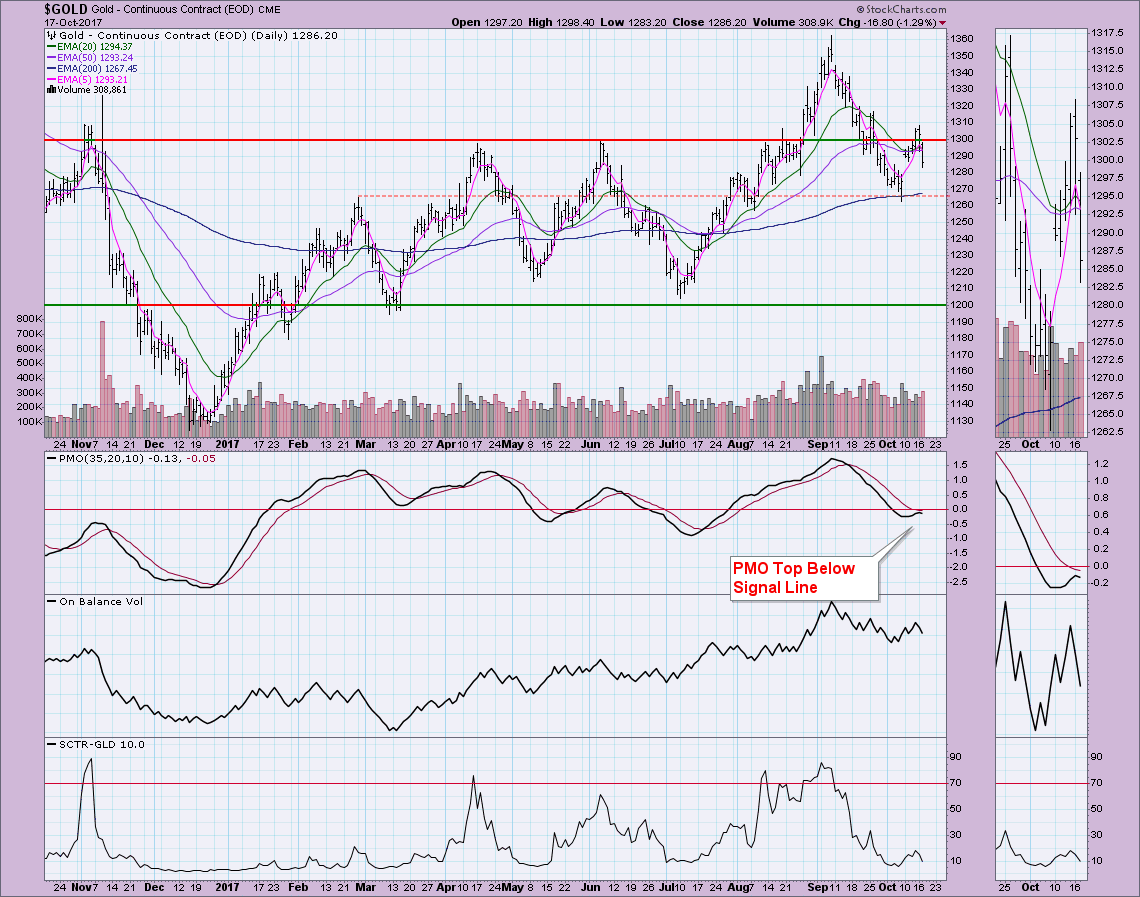
GOLD
IT Trend Model: BUY as of 7/31/2017
LT Trend Model: BUY as of 4/12/2017
Gold seems to have topped. What's worse is that the PMO topped beneath its signal line. I find that particularly bearish. My expectation had been a test of the 1200 level. I'm not that bearish given the PMO is close to near-term oversold territory, but I would expect to see at least a test of the 200-EMA around the 1265-1270 level.
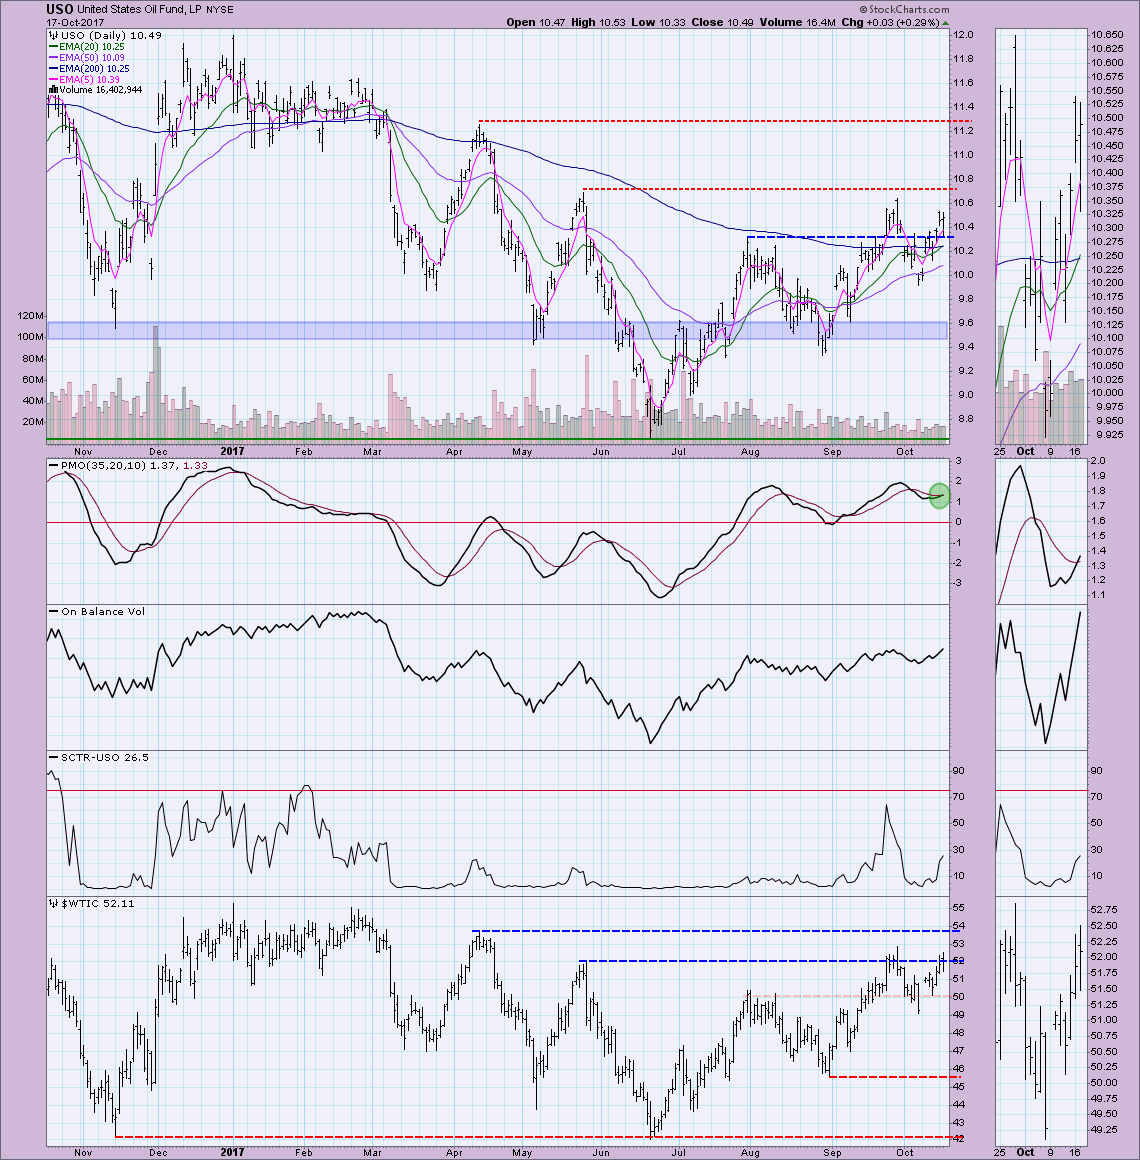
CRUDE OIL (USO)
IT Trend Model: SELL as of 8/29/2017
LT Trend Model: SELL as of 3/9/2017
USO broke above resistance again at $10.30 and is so far holding onto it as support. The new PMO BUY signal suggests to me that we will see the $10.70 level tested. Past that, I would be worried about an overbought PMO. If the PMO continues to rise past near-term overbought territory, I'd still be comfortable, but I'd be very vigilant about watching for a PMO top.
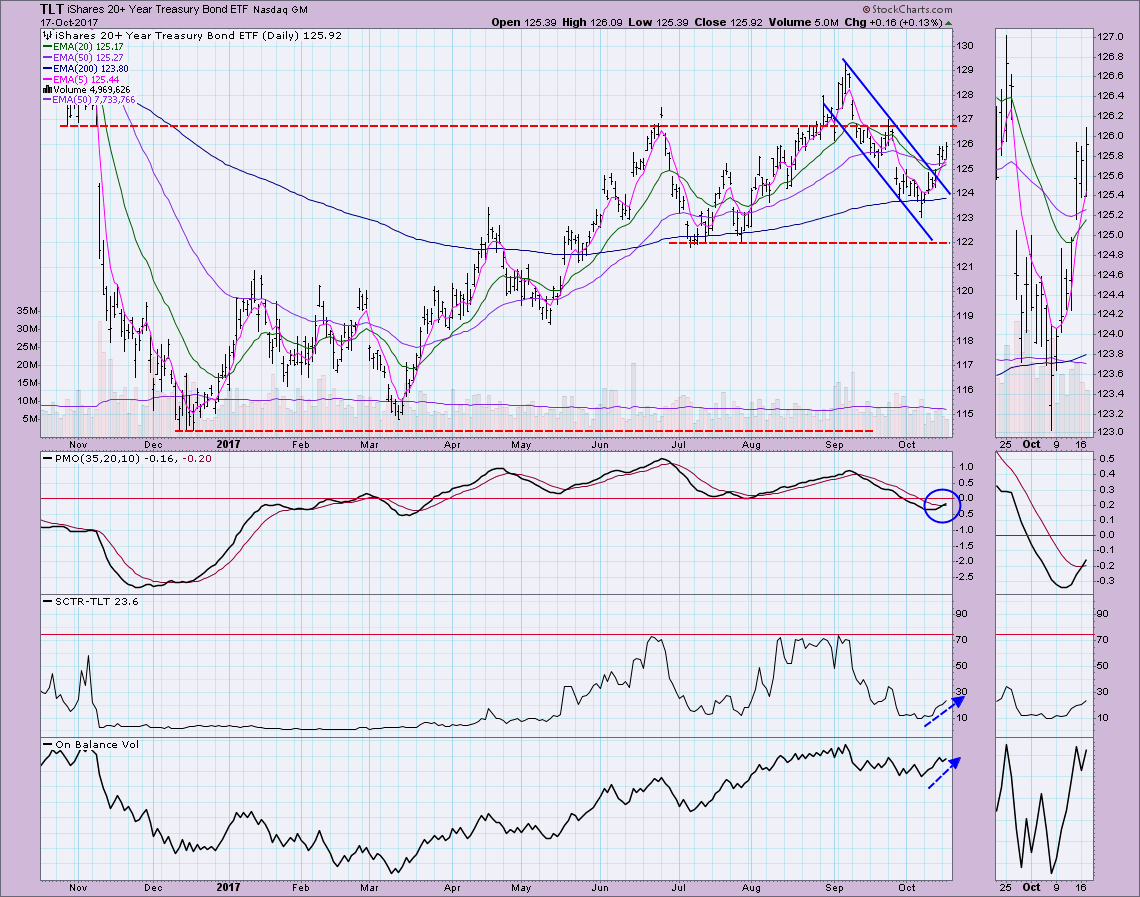
BONDS (TLT)
IT Trend Model: Neutral as of 10/5/2017
LT Trend Model: BUY as of 6/16/2017
TLT gapped up out of the declining trend channel. The chart has definitely moved bullish. The PMO triggered a BUY signal today and we can see that the 20-EMA is making a break for the 50-EMA. A positive 20/50-EMA crossover would generate an IT Trend Model BUY signal. Given the very positive indicator configuration, I expect resistance will be broken at $127.
Helpful DecisionPoint Links:
DecisionPoint Shared ChartList and DecisionPoint Chart Gallery
Price Momentum Oscillator (PMO)
Swenlin Trading Oscillators (STO-B and STO-V)
Technical Analysis is a windsock, not a crystal ball.
Happy Charting!
- Erin
**Don't miss DecisionPoint Commentary! Add your email below to be notified of new updates"**


