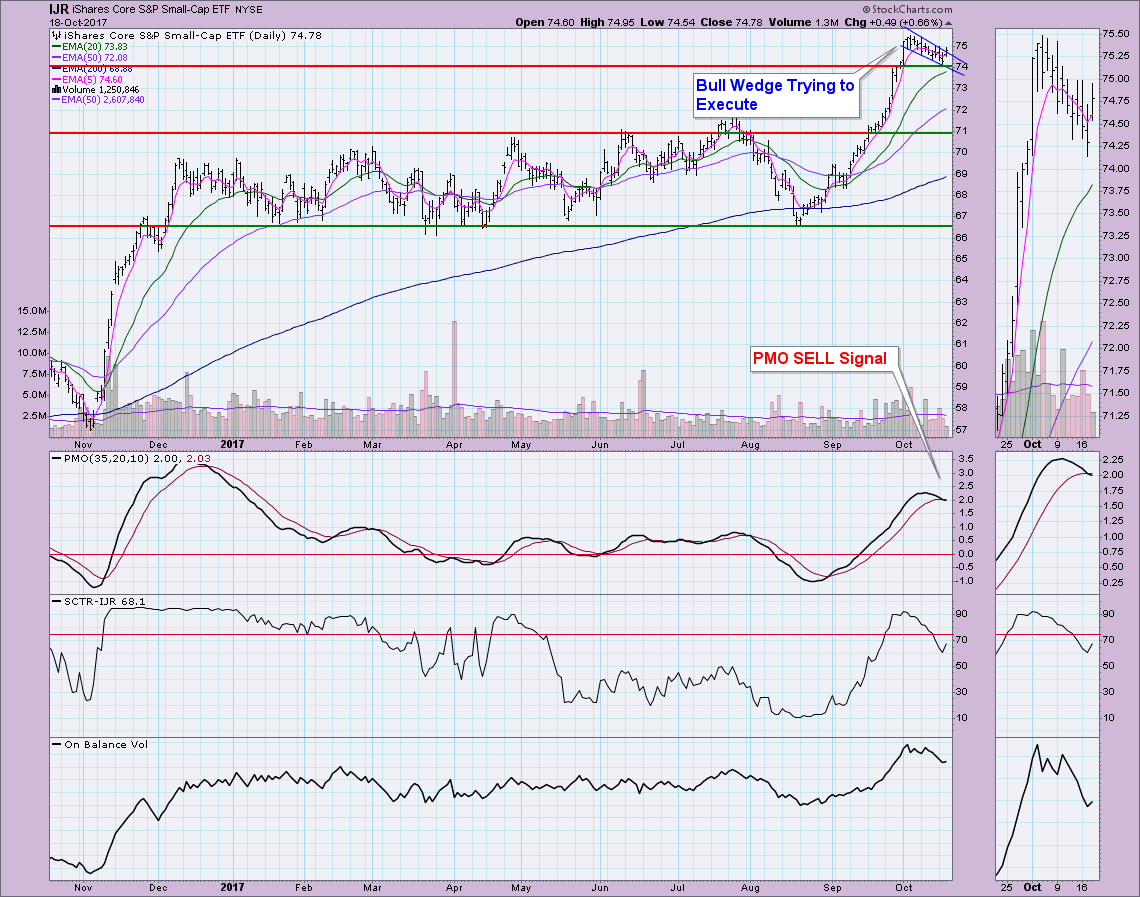
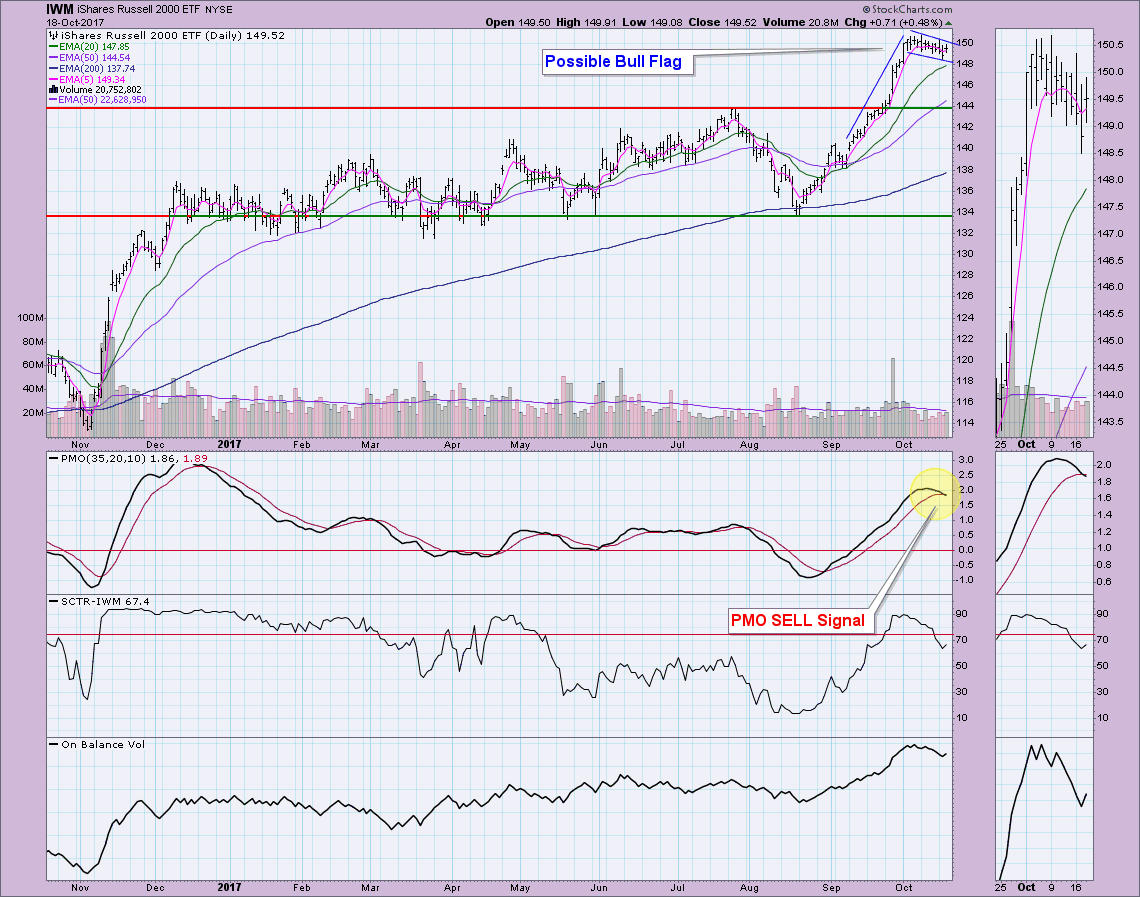
The short-term rally in large-cap indexes like the SPX, OEX and INDU was not contagious for the S&P 600 or Russell 2000. Below I've annotated their associated ETFs, IJR and IWM to show you the new PMO SELL signals. Although these SELL signals arrived today, a look at the charts suggests that these signals will whipsaw back to BUY signals.
You'll note on both IJR and IWM that the PMOs are overbought. Generally PMO SELL signals in overbought territory tend to be more successful in calling a decline than signals that arrive in oversold territory. That being said, I don't believe these SELL signals will gel. While I do believe that the market is very overbought, it is also in the midst of what appears to be an unstoppable rally. The pullback on small-caps is actually encouraging to me, it sets them up for a bounce.
With IJR, I've annotated a declining wedge formation that is in the process of executing. The OBV has been declining as selling has been somewhat fast and furious over the past week. However, it is ticking up above previous tops earlier in the year. The price trend is very positive with plenty of margin between the rising EMAs.
IWM has not quite broken out of the declining trend channel that it has formed over the past two weeks. I don't see it as a wedge, like IJR, but I do think it has the possibility of being a bull flag (as does IJR for that matter). These formations, if executed, call for a minimum upside target the length of the flagpole added to the breakout point or top of the pole. In this case, the flagpole length is at least $10 which would give us a target around $160.
Conclusion: While I don't like seeing these indexes underperforming the SPX, remember that they accelerated upward far faster than large-cap indexes. It is understandable that they needed some time to pause and pullback. PMO signals do tend to lag and in this case I suspect these SELL signals are lagging. However, if we see a breakdown below Tuesday's intraday lows, I reserve the right to reevaluate.
Helpful DecisionPoint Links:
DecisionPoint Shared ChartList and DecisionPoint Chart Gallery
Price Momentum Oscillator (PMO)
Swenlin Trading Oscillators (STO-B and STO-V)
Technical Analysis is a windsock, not a crystal ball.
Happy Charting!
- Erin
**Don't miss DecisionPoint Commentary! Add your email below to be notified of new updates"**


