 I know we all have seen the commercials for the newest or best investment of the decade. Now we are getting emails flooding our inboxes claiming to have an "investment of a lifetime"! I'm not saying that these are traps or always bad, but I can tell you, before you believe the amazing claims, a look at the chart is a MUST. I was recently sent a question via email with an attachment of one of these such headlines on BioHiTech Global (BHTG). I generally can't review or answer all of my emailed chart suggestions, but the headline was just "too good". I had to see this chart.
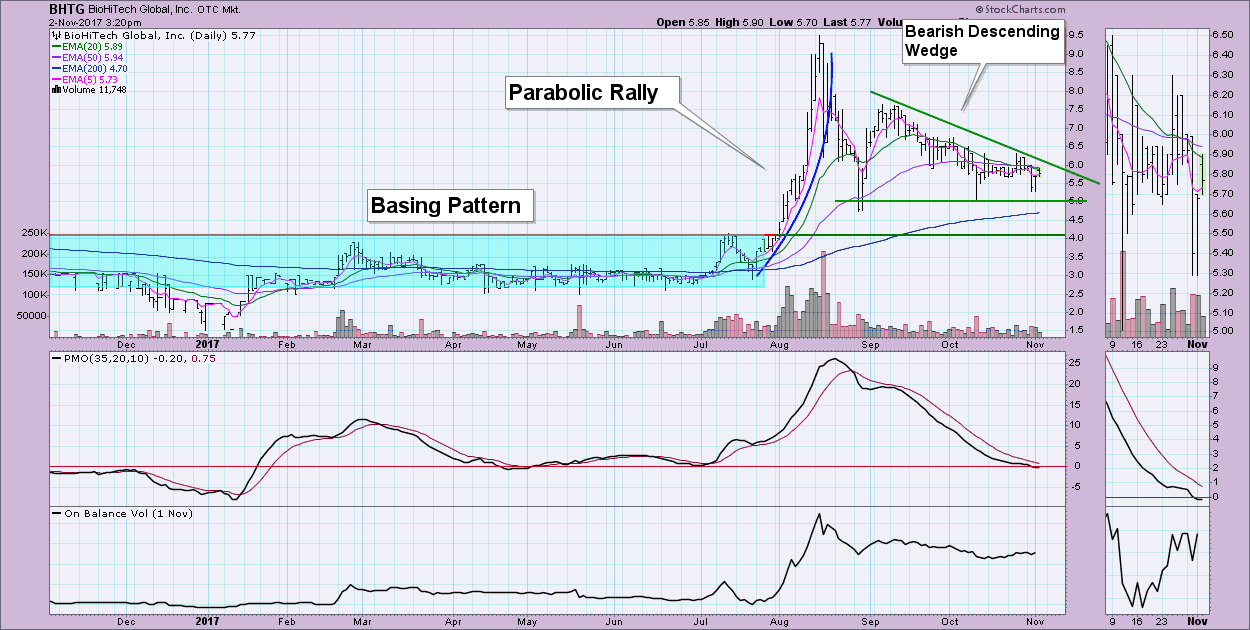
First, I prefer not to trade such a volatile stock; volume typically is less than 30,000 shares. This tells me that email blasts are made to manipulate this stock; not something I want to be involved in. Past that, let's look at the technicals of this chart. I found it interesting that I had just written about the parabolic chart pattern using Intel (INTC) as an example and here is another sample already. BHTG executed a parabolic chart pattern as expected. The collapse is always quick and very painful. On this stock, I can't imagine the pain (and honestly the euphoria) that this pattern caused in August. This was right about the time the market was coming back to life. Knowing that the market as a whole has been in a rising trend since late August, I hear alarm bells when I see the declining trend that began in early September.
Since the collapse, we can see a bearish descending wedge. I think you could also make a case for a symmetrical triangle. In either case, the expectation is a breakdown. A symmetrical triangle is a continuation pattern, this means we should expect it to resolve in the direction it was already going before the pattern formed...that would be down.
The Trend Models are also configured poorly. The big attention flag is the recent 20/50-EMA negative crossover. That gave us a Neutral signal. I also note a ST Trend Model Neutral signal that arrived in mid-September. The 5-EMA crossed below the 20-EMA and it hasn't managed to get back above. Another alarm bell is going off.
The PMO is on a SELL signal but is decelerating. I still don't like it. I would want to see at least three days of a rising PMO or a BUY signal, but you still wouldn't want to hop in until the Trend Models clear the Neutral signals. (Neutral means fully hedged or in cash...not shorting, again we want to limit risk exposure).
Given the problems and the chart patterns, I would expect to see a drop to at least $4, if not lower to the $3 level which posed as strong resistance from March to July. Those are the next levels of support.
Conclusion: These types of investments are soooooo tempting. The "brochure" is telling you that it WILL go up! Well the "technicals" tell a very different story. I could be completely wrong here, but I couldn't in good conscience ever suggest an investment of this type.
Helpful DecisionPoint Links:
DecisionPoint Shared ChartList and DecisionPoint Chart Gallery
Price Momentum Oscillator (PMO)
Swenlin Trading Oscillators (STO-B and STO-V)
Technical Analysis is a windsock, not a crystal ball.
Happy Charting!
- Erin
**Don't miss DecisionPoint Commentary! Add your email below to be notified of new updates"**


