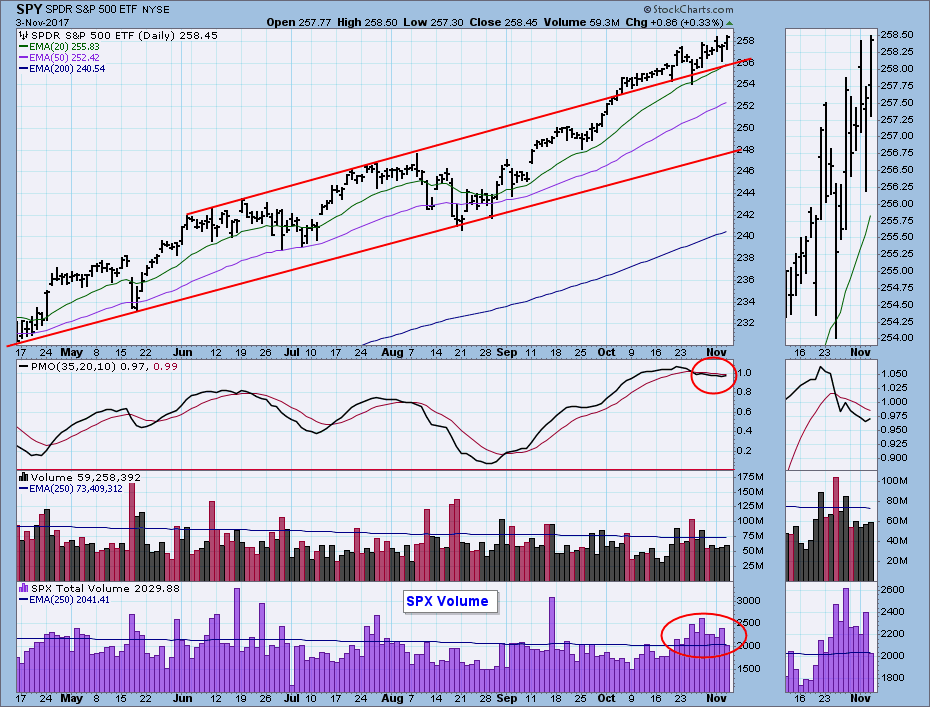
Of my comment, "Not out of the woods yet," you might ask, "What woods?" The market, after all, did manage to grind higher this week, so what's the problem? The problem that I see is a persistent weakness in our intermediate-term indicators, but we will get into that later. More immediately, we note that this week higher prices were accompanied by much higher than average S&P 500 volume. This could be a sign of distribution.
The DecisionPoint Weekly Wrap presents an end-of-week assessment of the trend and condition of the stock market (S&P 500), the U.S. Dollar, Gold, Crude Oil, and Bonds.
STOCKS
IT Trend Model: BUY as of 11/15/2016
LT Trend Model: BUY as of 4/1/2016
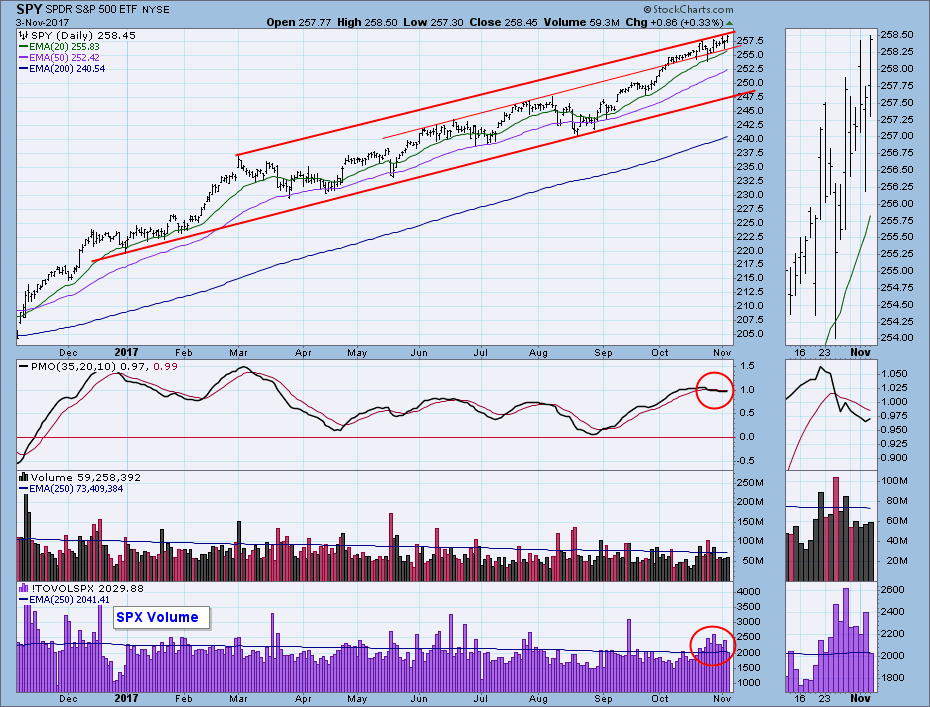
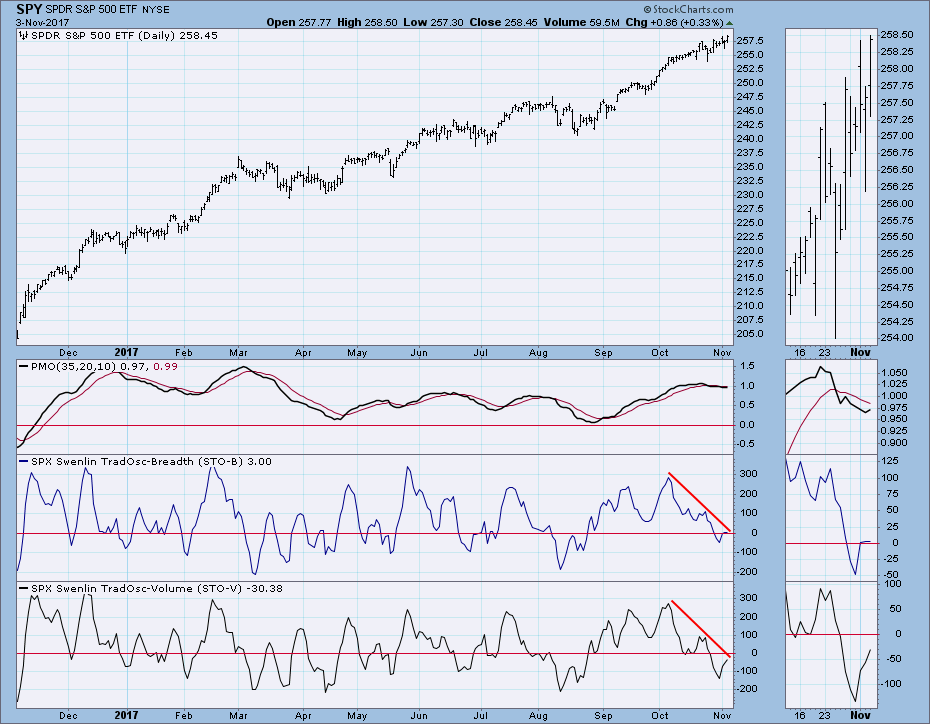
Daily Chart: The PMO has been falling below the signal line, but it displays as a sideways struggle because price is still churning higher. The recent high SPX volume combined with struggling price is a short-term negative. The trend lines drawn on this daily chart are somewhat useful, but the weekly chart gives a better perspective.
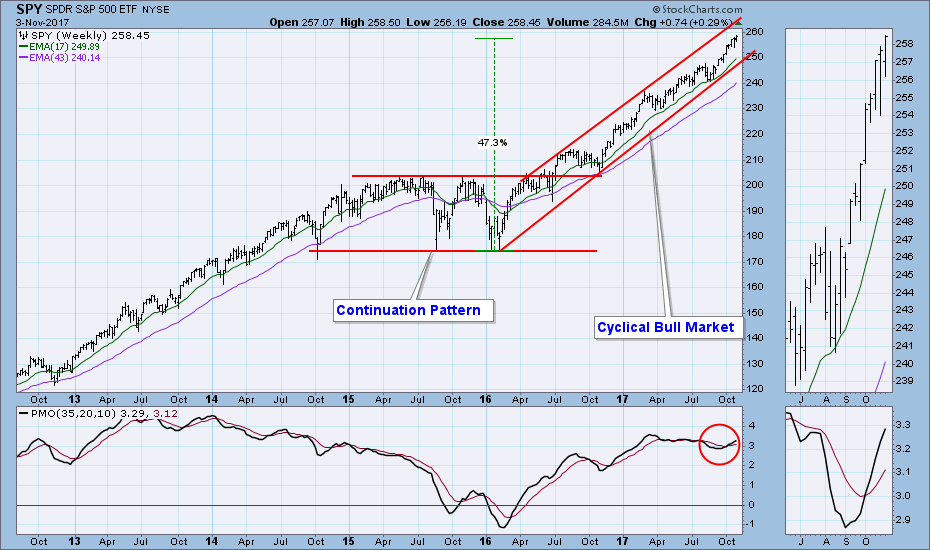
Weekly Chart: This time frame gives us the best perspective of the cyclical bull market, which has a more accelerated angle of ascent than the 2013-2014 time period. The continuation pattern is really a substitute for the cyclical bear market that was expected.
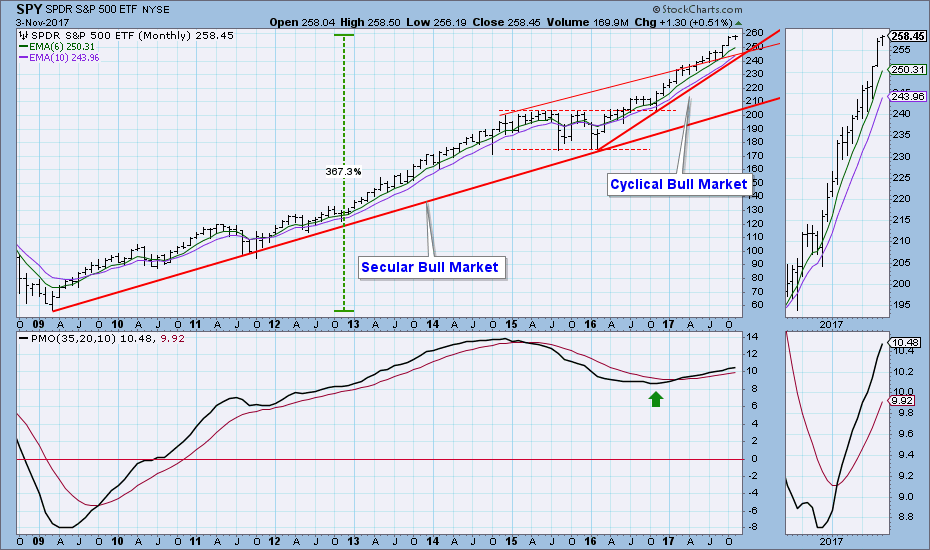
Monthly Chart: I have adjusted the monthly chart to include only the period of the current secular bull market. Note that SPY has broken above the top of the rising trend channel.
Short-Term Market Indicators: There are clear negative divergences from the beginning of October.
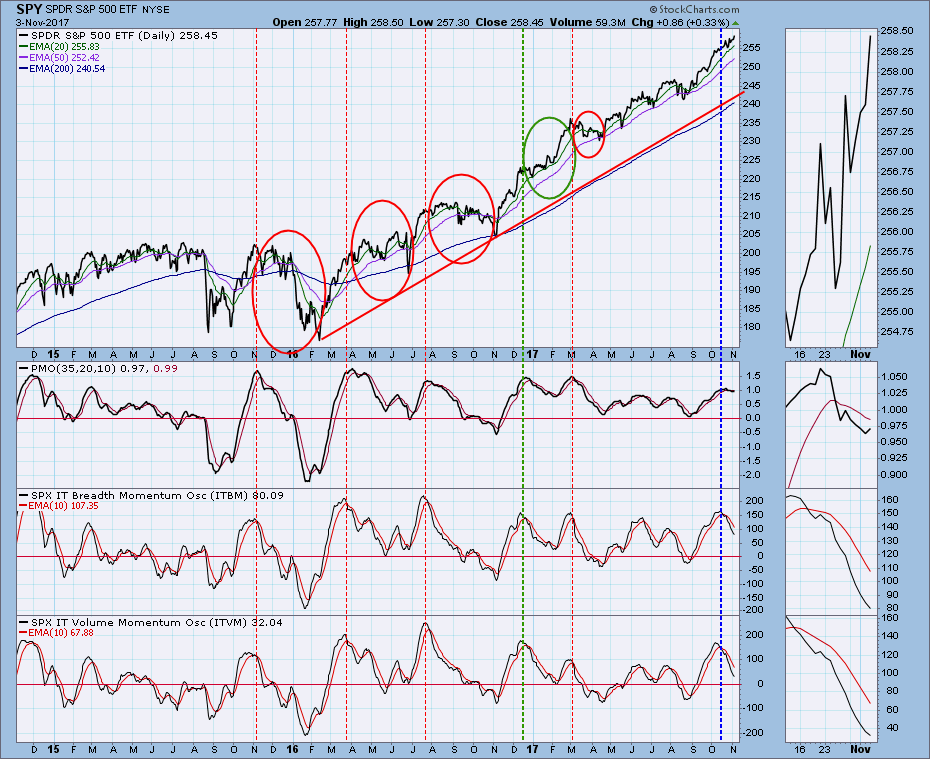
Intermediate-Term Market Indicators: The ITBM, ITVM, and PMO have all topped in overbought territory and are headed lower. These internal conditions merit a higher than normal level of caution. On the chart below I have marked with a red ellipse prior instances where the indicators in this time frame put in tops. Note that it is not unusual for there to be a significant delay between the time the indicators top and when price finally responds appropriately. Just to prove that nothing is perfect, there is also a green ellipse highlighting a time when price simply ignored the internal signs and just moved higher. Since the most recent indicator tops, the market has moved higher, but it is too soon to to conclude that there is no downside ahead.
Conclusion: The intermediate-term indicators are below their signal line and falling, and experience shows that this internal weakness could easily result in a price correction. I see no reason to think that a major decline is about to take place. That could change if we are hit with a serious exogenous event; otherwise, I think the up trend is safe until at least the first of next year.
DOLLAR (UUP)
IT Trend Model: BUY as of 10/23/2017
LT Trend Model: SELL as of 5/24/2017
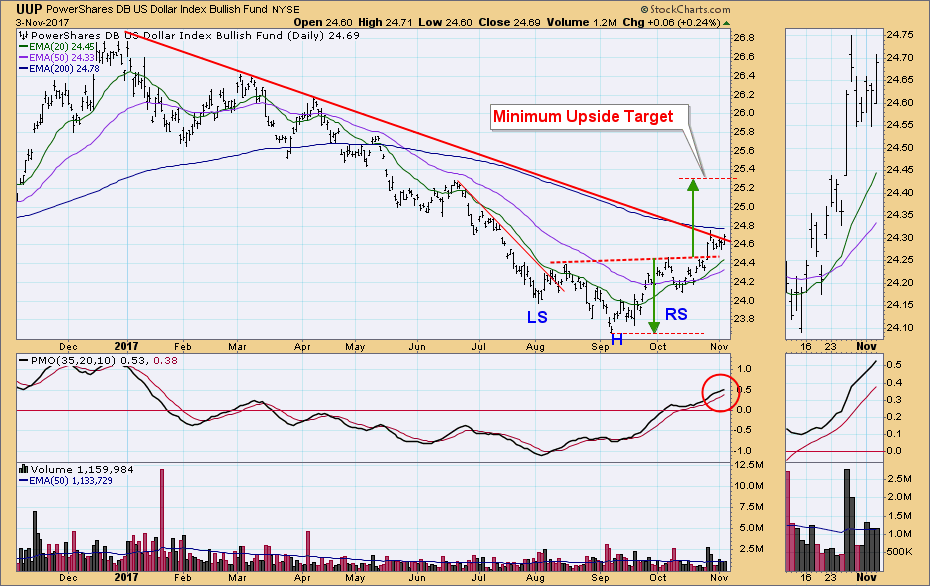
Daily Chart: The reverse head and shoulders pattern executed when price broke up through the neckline. Now UUP has encountered resistance from the declining tops line drawn from the January top. My assumption is that a breakout is coming soon.
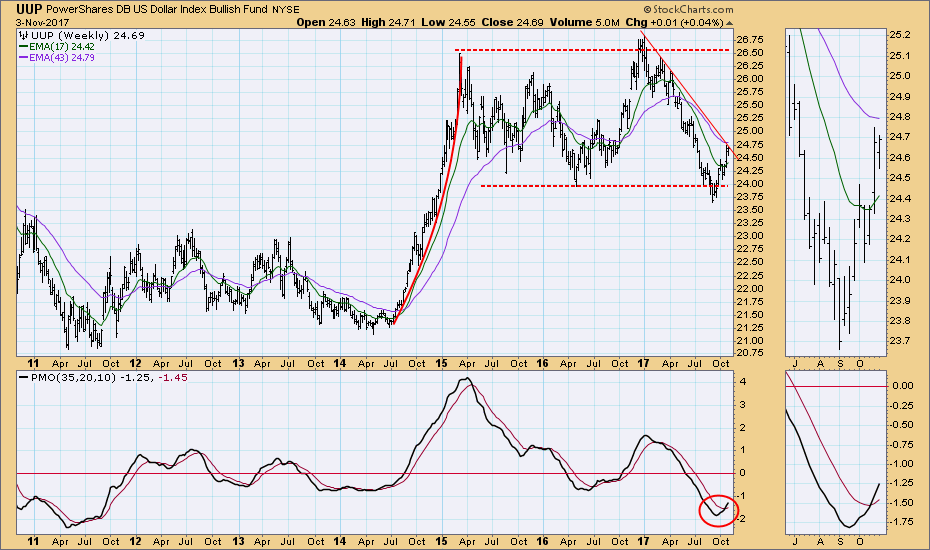
Weekly Chart: As I said last week, the configuration of the weekly PMO is very encouraging -- a nice smooth descent, transitioning into a clean, open bottom. And of course, the PMO has crossed up through the signal line. All this points toward continued positive movement.
GOLD
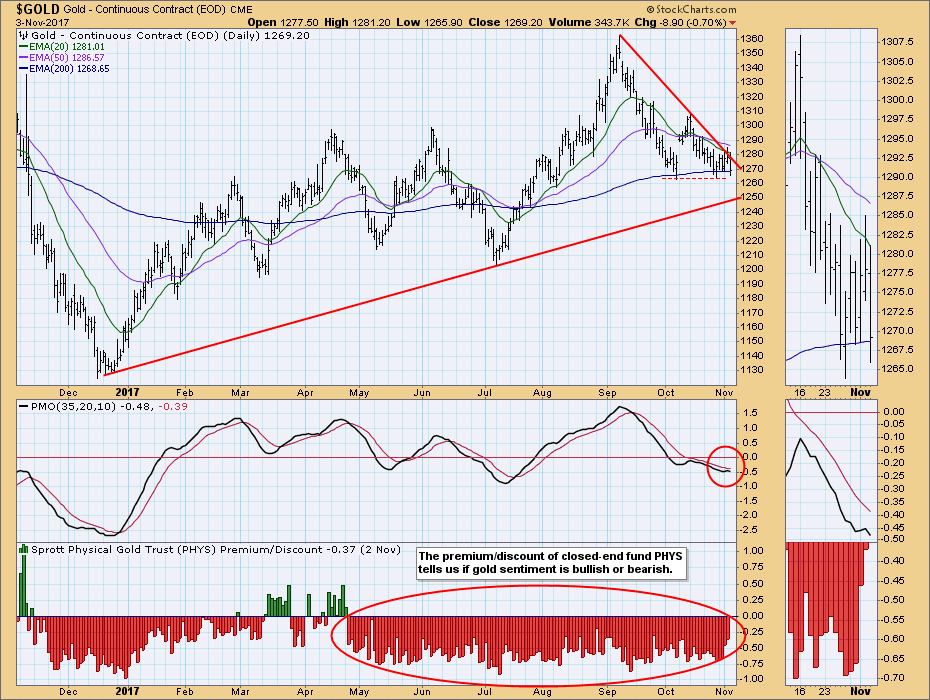
IT Trend Model: NEUTRAL as of 10/20/2017
LT Trend Model: BUY as of 4/12/2017
Daily Chart: The positive picture for the dollar does not bode well for gold. Gold has failed to break above the declining tops line drawn from the September top, and sentiment remains negative.
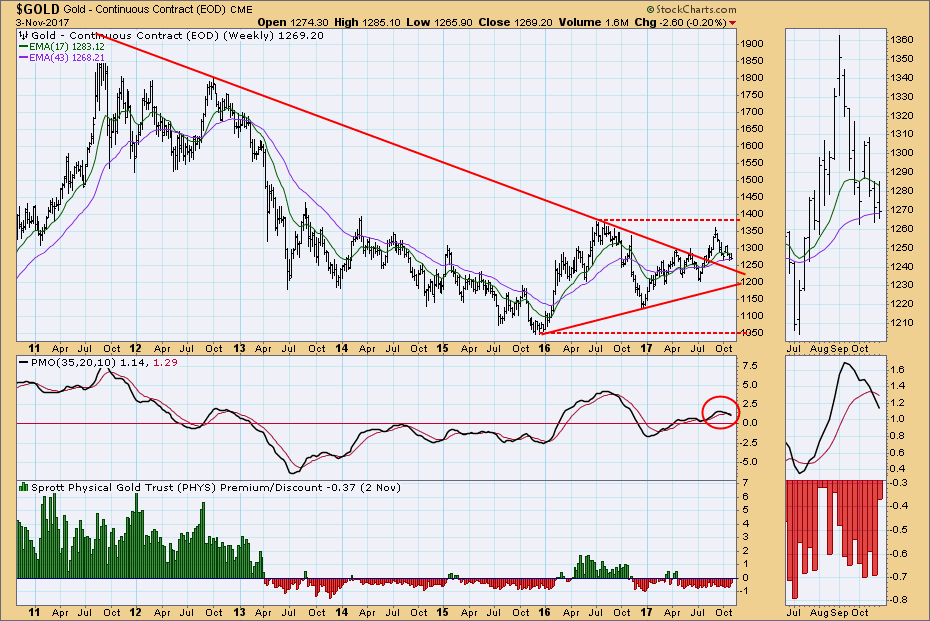
Weekly Chart: Gold's weekly PMO is below the signal line and falling, although price and PMO have been trending up for 22 months. I would characterize gold as positive but struggling.
CRUDE OIL (USO)
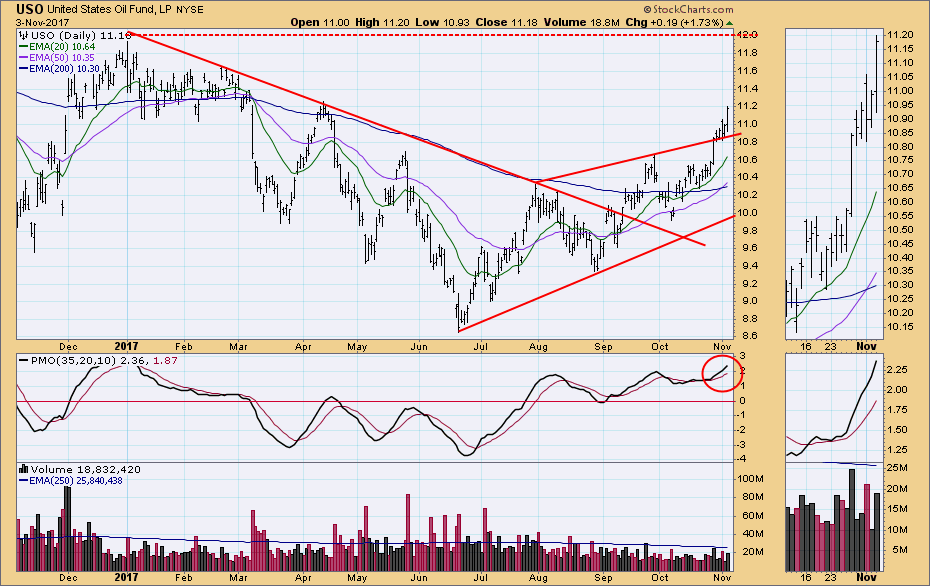
IT Trend Model: BUY as of 9/6/2017
LT Trend Model: BUY as of 11/2/2017
Daily Chart: After churning just above a line of support, USO is now moving higher in earnest. There is significant resistance at 12.00, which is more evident on the weekly chart.
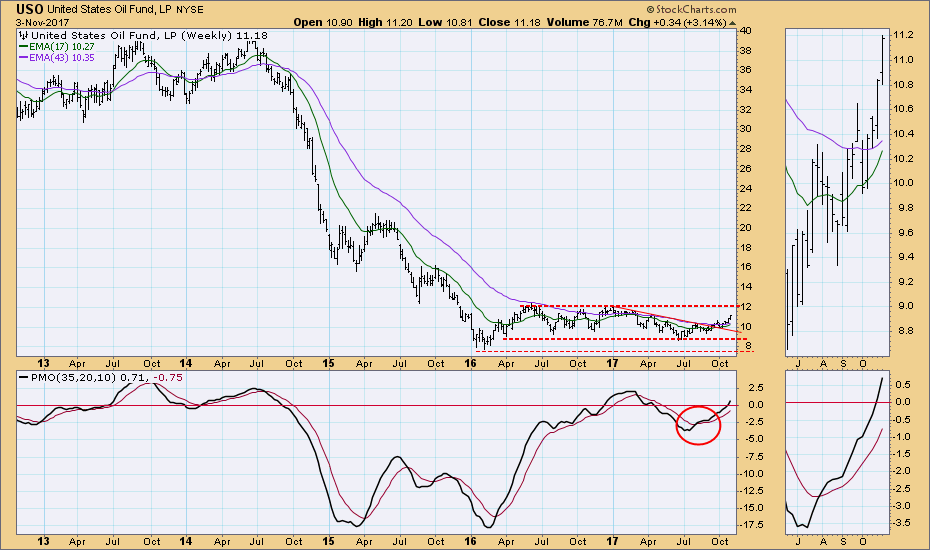
Weekly Chart: USO is past the halfway point in the trading channel. The top of the channel seems a likely place for the up trend to stall.
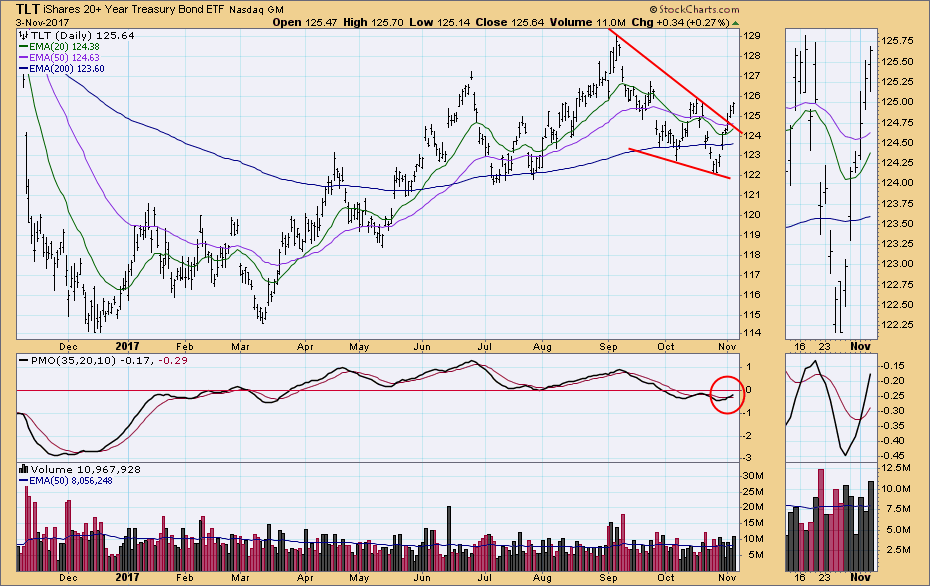
BONDS (TLT)
IT Trend Model: NEUTRAL as of 10/5/2017
LT Trend Model: BUY as of 6/16/2017
Daily Chart: TLT has broken out of the falling wedge formation, and the daily PMO has crossed up through the signal line, so the picture is somewhat bullish.
Weekly Chart: The weekly PMO has turned up, but there is a possible head and shoulders pattern forming.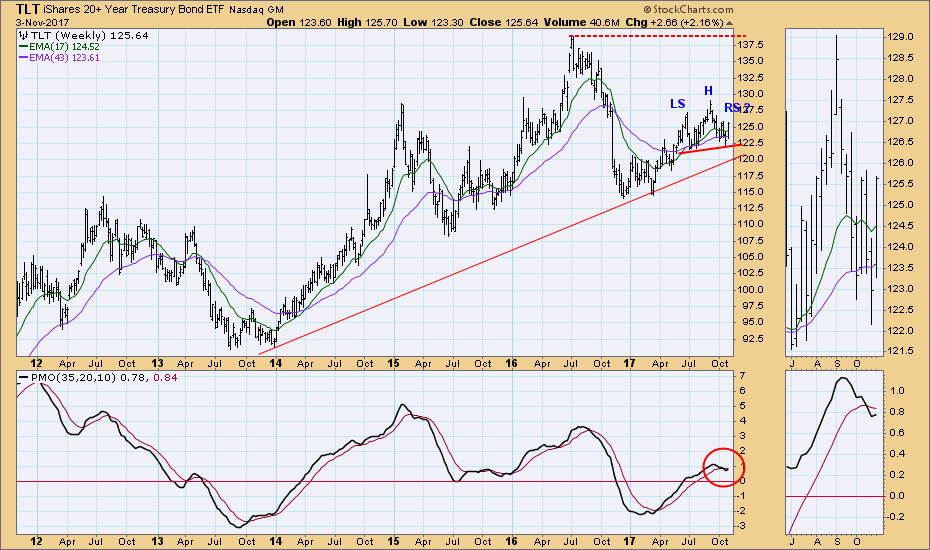
**Don't miss any of the DecisionPoint commentaries! Go to the "Notify Me" box toward the end of this blog page to be notified as soon as they are published.**
Technical Analysis is a windsock, not a crystal ball.
Happy Charting!
- Carl
NOTE: The signal status reported herein is based upon mechanical trading model signals, specifically, the DecisionPoint Trend Model. They define the implied bias of the price index based upon moving average relationships, but they do not necessarily call for a specific action. They are information flags that should prompt chart review. Further, they do not call for continuous buying or selling during the life of the signal. For example, a BUY signal will probably (but not necessarily) return the best results if action is taken soon after the signal is generated. Additional opportunities for buying may be found as price zigzags higher, but the trader must look for optimum entry points. Conversely, exit points to preserve gains (or minimize losses) may be evident before the model mechanically closes the signal.
Helpful DecisionPoint Links:
DecisionPoint Shared ChartList and DecisionPoint Chart Gallery
Price Momentum Oscillator (PMO)
Swenlin Trading Oscillators (STO-B and STO-V)


