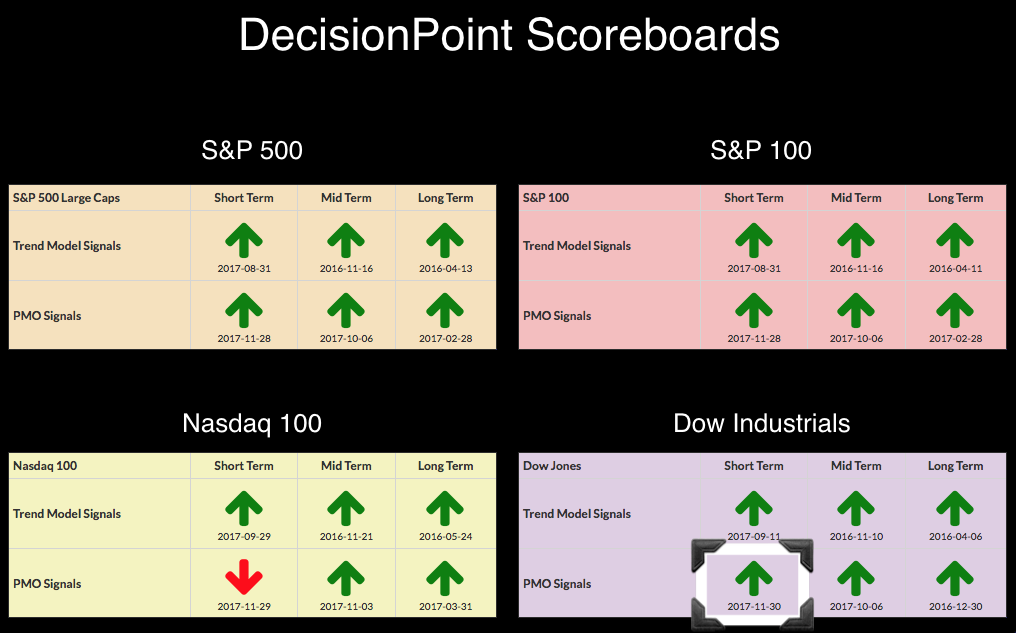
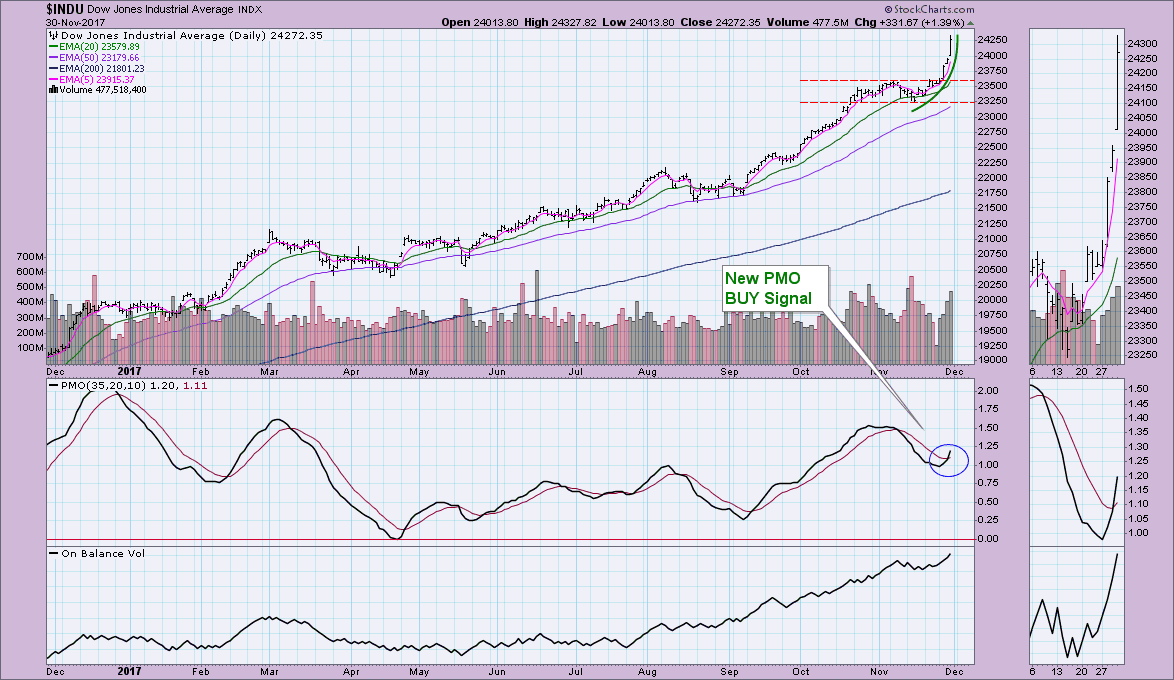
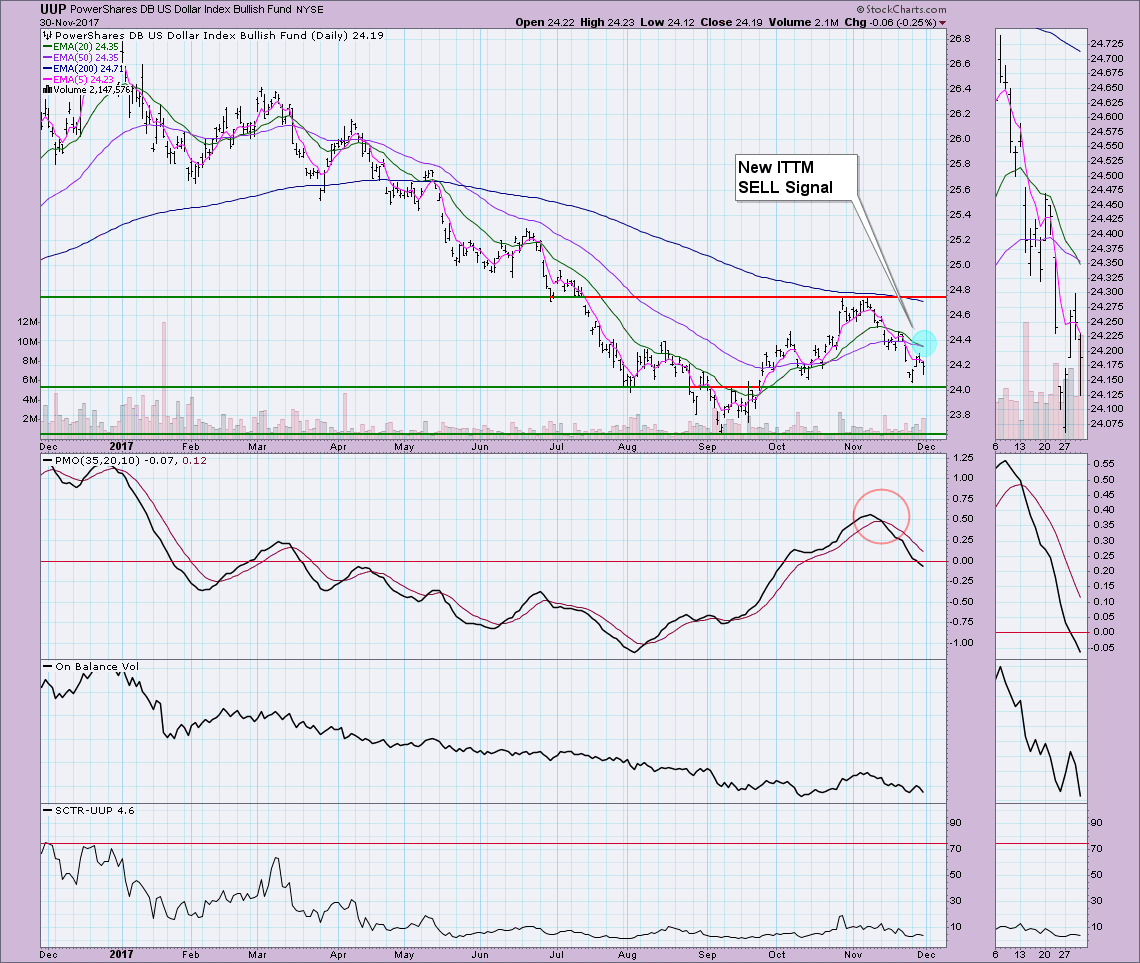
Two important signal changes arrived today that you need to know about. First, the Dow Industrials triggered a new ST PMO BUY signal. Talk about a bifurcated market, the NDX gets a PMO SELL signal yesterday and today the Dow continues its parabolic rise and logs a BUY signal. The second signal is the new IT Trend Model SELL signal on the Dollar (UUP). After reviewing UUP in yesterday's DP Alert, I did warn everyone that this was coming.
Here's a look at the Dow's new PMO BUY signal. I wasn't exaggerating about a parabolic move on the industrials. I always get concerned when I see these patterns. A rise this quick makes price so vulnerable to a price shock decline to clear overbought conditions. However, I'm not overly concerned due to the BUY signal that was thoughtful and deliberate rather than a hard yank over the PMO's signal line. The PMO is NOT overbought, there is plenty of room to move higher. I do think we are going to see a pullback off this parabola, but worst case would be to bring it back to support at last week's overhead resistance.
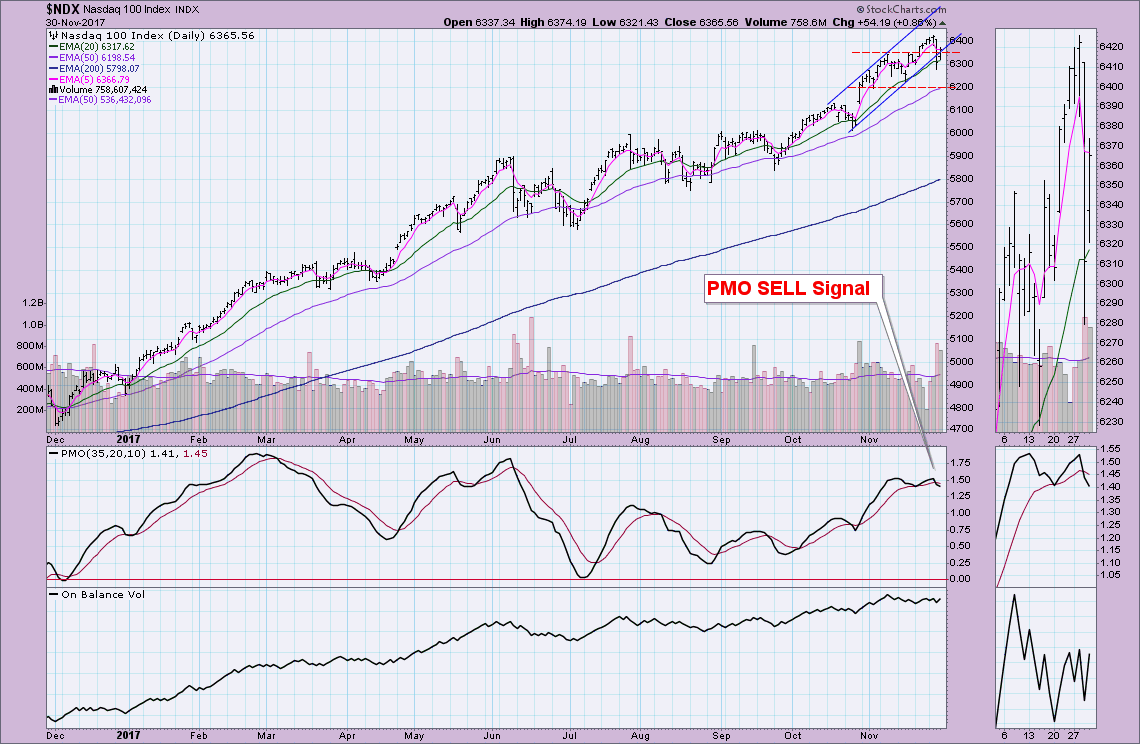
I think the NDX chart should be reviewed simply to compare its PMO to the Dow's above. The NDX made up some ground today with a nice rally, but the PMO was almost completely unaffected in its decline. Technology is still likely in for some decline as money appears to be rotating into financials and industrials (hence the new PMO BUY signal on the Dow).
The 20-EMA crossed below the 50-EMA while the 50-EMA was below the 200-EMA and this generated a SELL signal. Had the 50-EMA been above the 200-EMA, the signal would have been a "Neutral". Neutral, meaning in cash or fully hedged. The reverse head and shoulders tried to execute but never quite made it to its calculated target before turning down. The PMO SELL signal gave us nice warning that this was coming. Given the new ITTM SELL signal and the current trajectory of the PMO, I'm looking for support at $24.00 to be tested and likely broken with price testing the September low.
Helpful DecisionPoint Links:
DecisionPoint Shared ChartList and DecisionPoint Chart Gallery
Price Momentum Oscillator (PMO)
Swenlin Trading Oscillators (STO-B and STO-V)
Technical Analysis is a windsock, not a crystal ball.
Happy Charting!
- Erin
**Don't miss DecisionPoint Commentary! Add your email below to be notified of new updates"**


