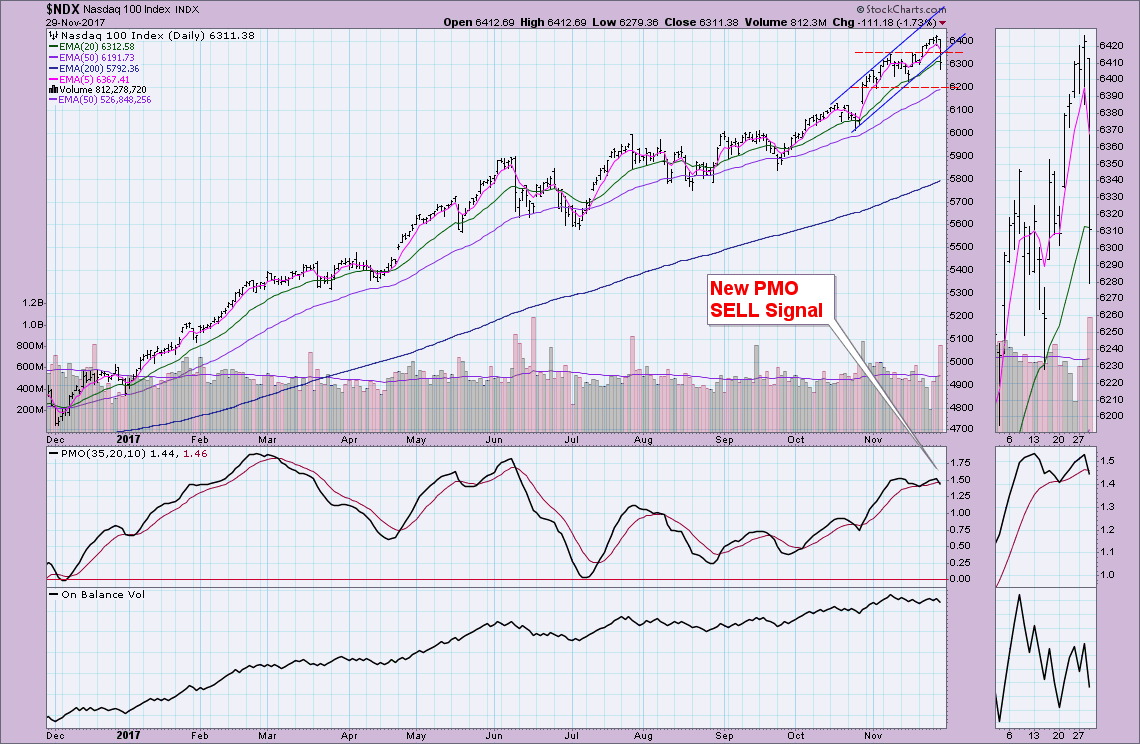

Technology fell apart today as money appeared to be rotating out of technology and into financials which had a brilliant day. The PMO was yanked down below its signal line on the NDX. Yesterday, the PMO was rising and price looked strong. What a difference a day can make. Meanwhile, the SPX and OEX had very small declines today and the Dow actually finished up 0.44%.
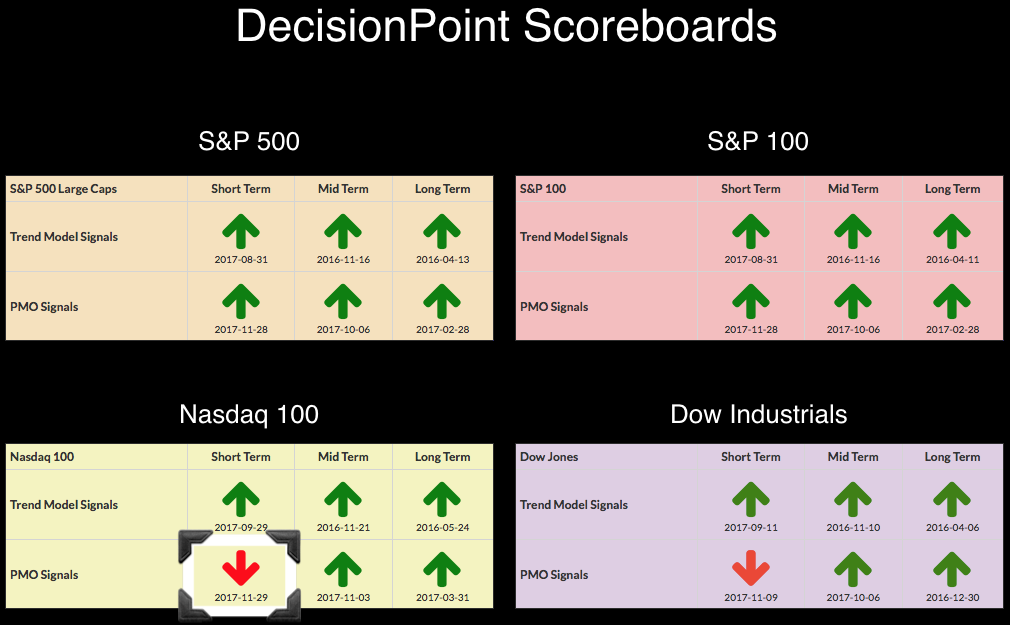
Support is not that far away at 6200, but the amount of money flying out of technology today has the earmarks of an initiation. High volume selling with a deep decline and a new PMO SELL signal isn't likely a selling exhaustion. We could be in for a bifurcated market into December. I say this because indicators and price charts for the SPX, OEX and Dow are quite bullish right now.
The purpose of the DecisionPoint Alert Daily Update is to quickly review the day's action, internal condition, and Trend Model status of the broad market (S&P 500), the nine SPDR Sectors, the U.S. Dollar, Gold, Crude Oil, and Bonds. To ensure that using this daily reference will be quick and painless, we are as brief as possible, and sometimes we let a chart speak for itself.
STOCKS (DP Trend Model Signals are Based on SPY)
IT Trend Model: BUY as of 11/15/2016
LT Trend Model: BUY as of 4/1/2016
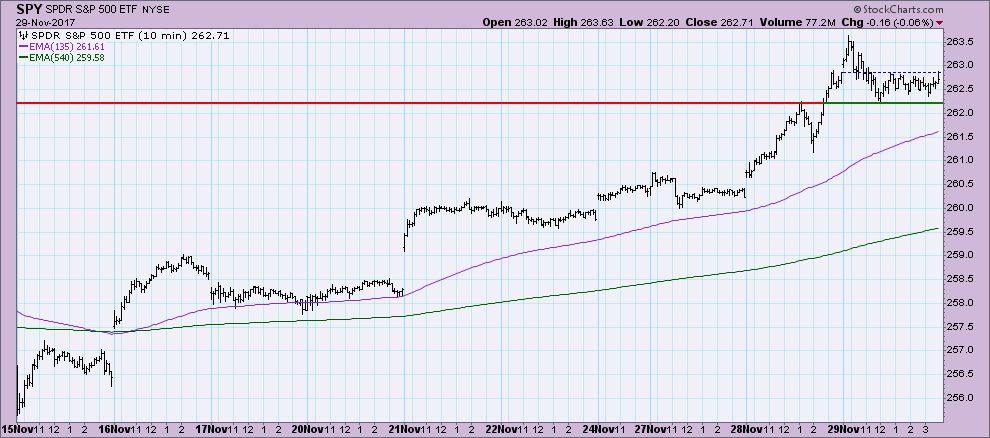
The market started higher today, but lost ground into lunch. After that price consolidated sideways, unable to move into positive territory. A new all-time intraday high was set and now will perform as overhead resistance.
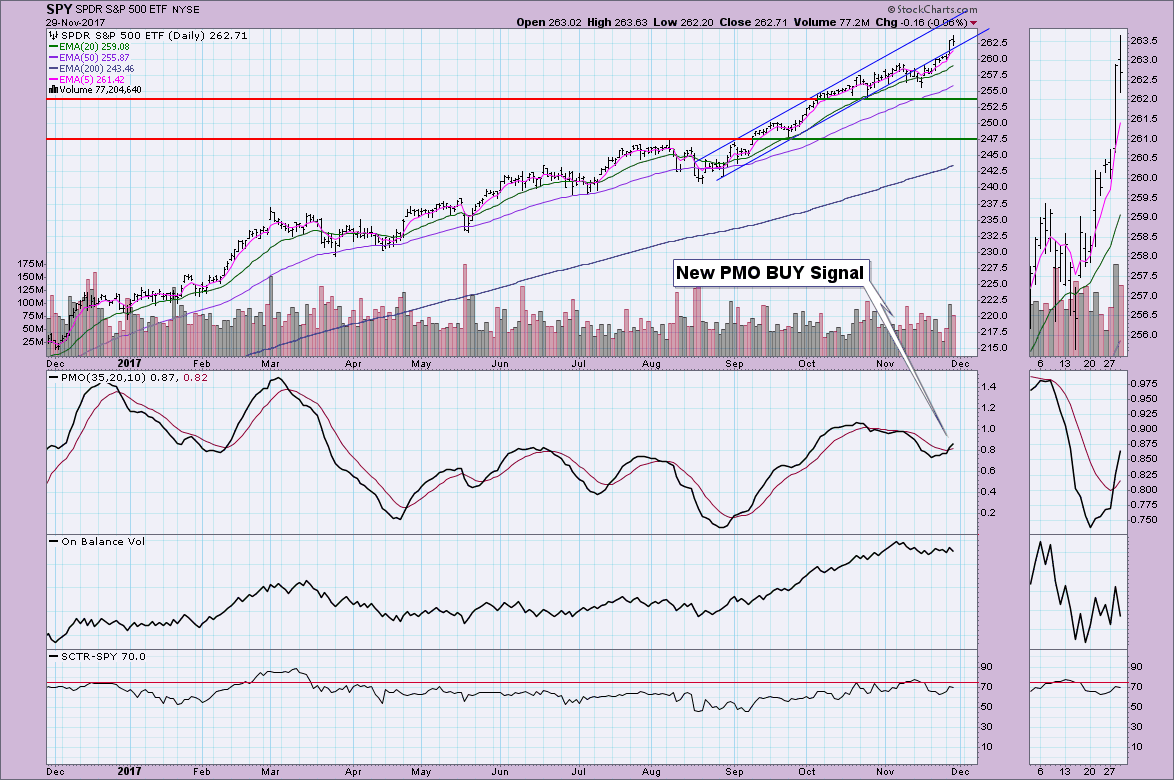
Notice the strong PMO on the SPY. Whereas the NDX saw its PMO pulled downward, the SPY shows absolutely no deterioration of the PMO's rise.
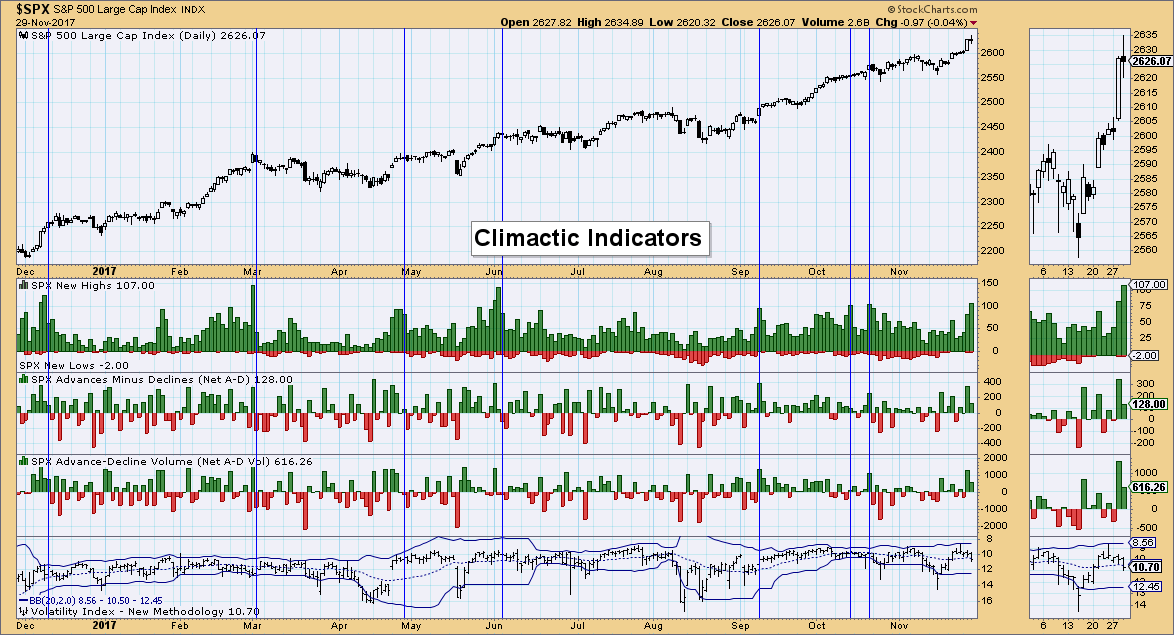
Climactic Indicators: I've annotated times we've seen new highs over 100. We saw these readings today. These are very short-term indicators. Notice that if we see these high readings in conjunction with high A-D readings, a decline typically follows. Given we aren't seeing the same climactic readings on the Net A-Ds, I don't see this as a problem. You'll notice that we've typically seen sideways consolidation when the net A-D readings are low and the new highs are above 100.
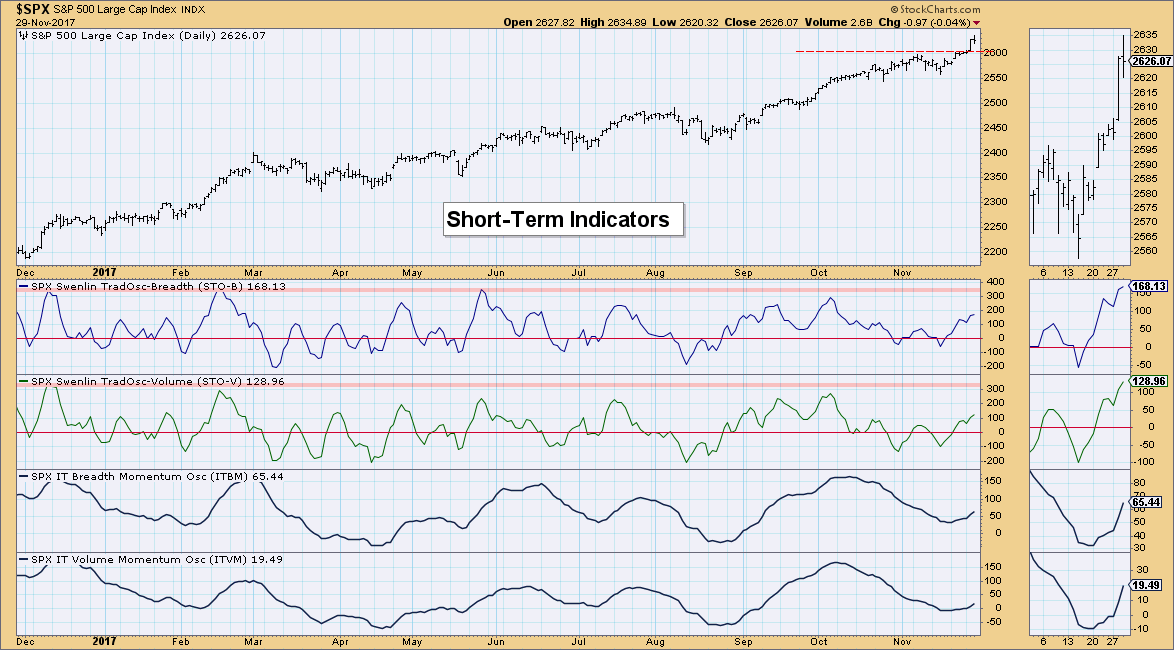
Short-Term Indicators: I'm very happy with these short-term indicators. They called the recent bottom and you'll note that as soon as we began to see the ITBM and ITVM turn up, the STO readings were confirmed. These indicators are not particularly overbought and can accommodate more upside.
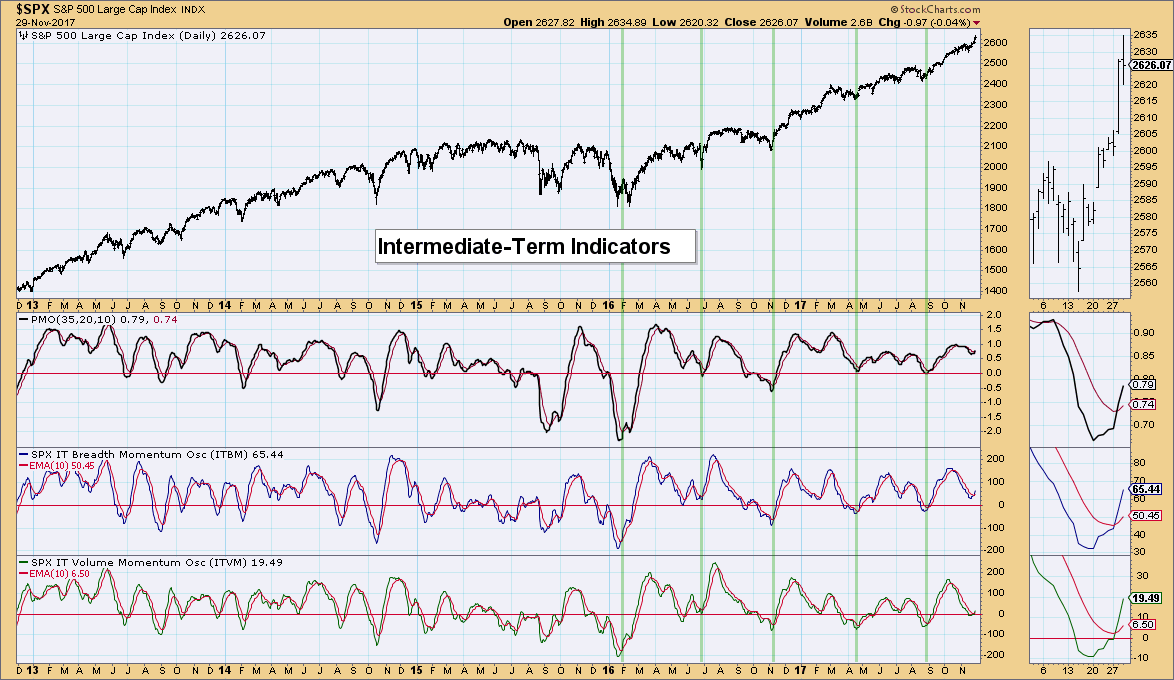
Intermediate-Term Indicators: The positive crossovers on the ITBM and ITVM also confirm this intermediate-term rally.
Conclusion: I am expecting the Santa Claus rally to continue. The only issue we could run into is the correction on the NDX. We've seen technology lead the markets, so that could be something to worry about. However, with ST and IT indicators looking so robust, I have to take a bullish stance on the market as a whole right now.
DOLLAR
IT Trend Model: BUY as of 10/23/2017
LT Trend Model: SELL as of 05/24/2017
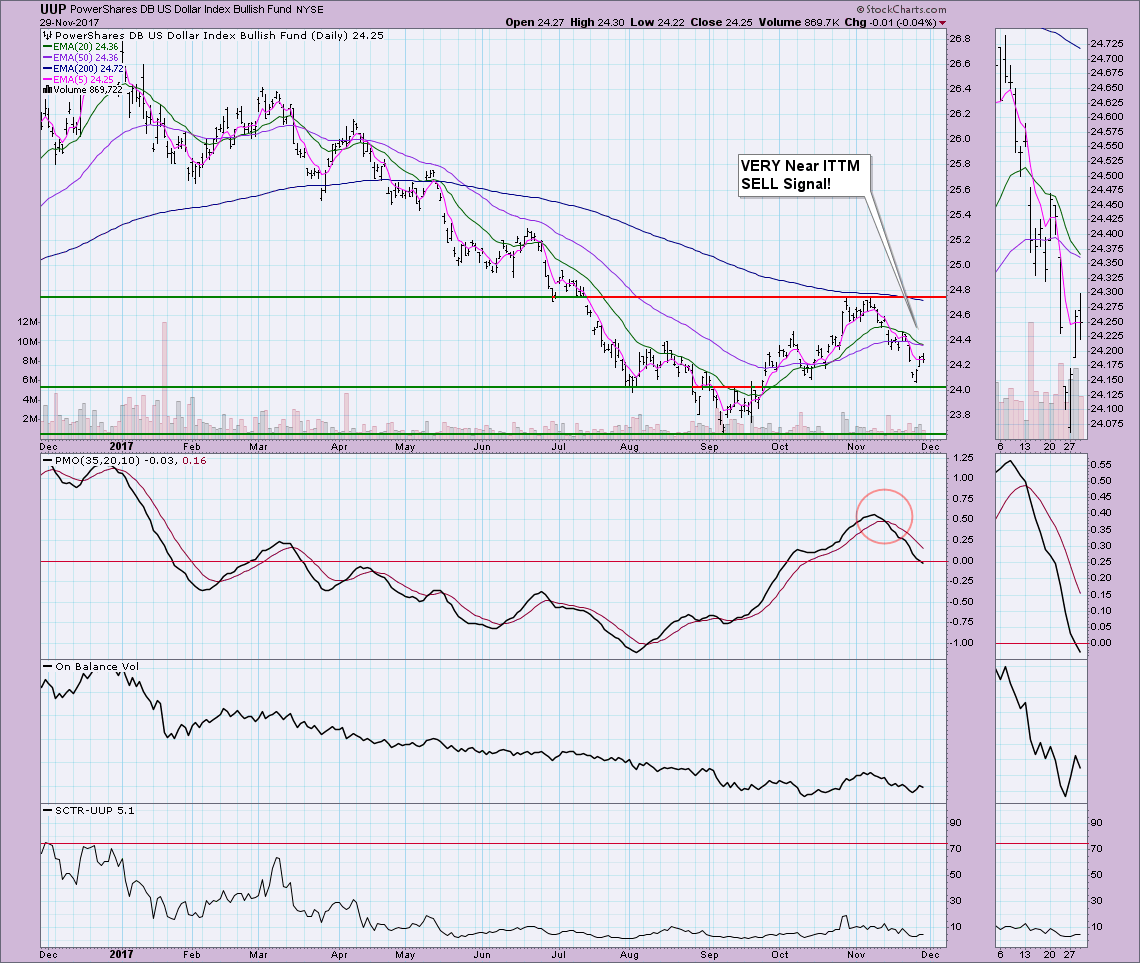
UUP found support at the low formed at the beginning of August. The PMO has not yet turned up and the IT Trend Model is about to generate a SELL signal should the 20-EMA cross below the 50-EMA. I suspect that signal will trigger tomorrow despite most any rally UUP can muster. The crossover will occur if price cannot rise above the 50-EMA. Given it currently sits at 24.36 and price closed at 24.25, it will require a strong rally tomorrow to avoid the SELL signal. Had the PMO turned up by now, I would be bullish on UUP. Unfortunately, the rally on Monday and Tuesday barely made a difference to the trajectory of the PMO and I believe that speaks to the weakness of this week's rally.
GOLD
IT Trend Model: NEUTRAL as of 10/20/2017
LT Trend Model: BUY as of 4/12/2017
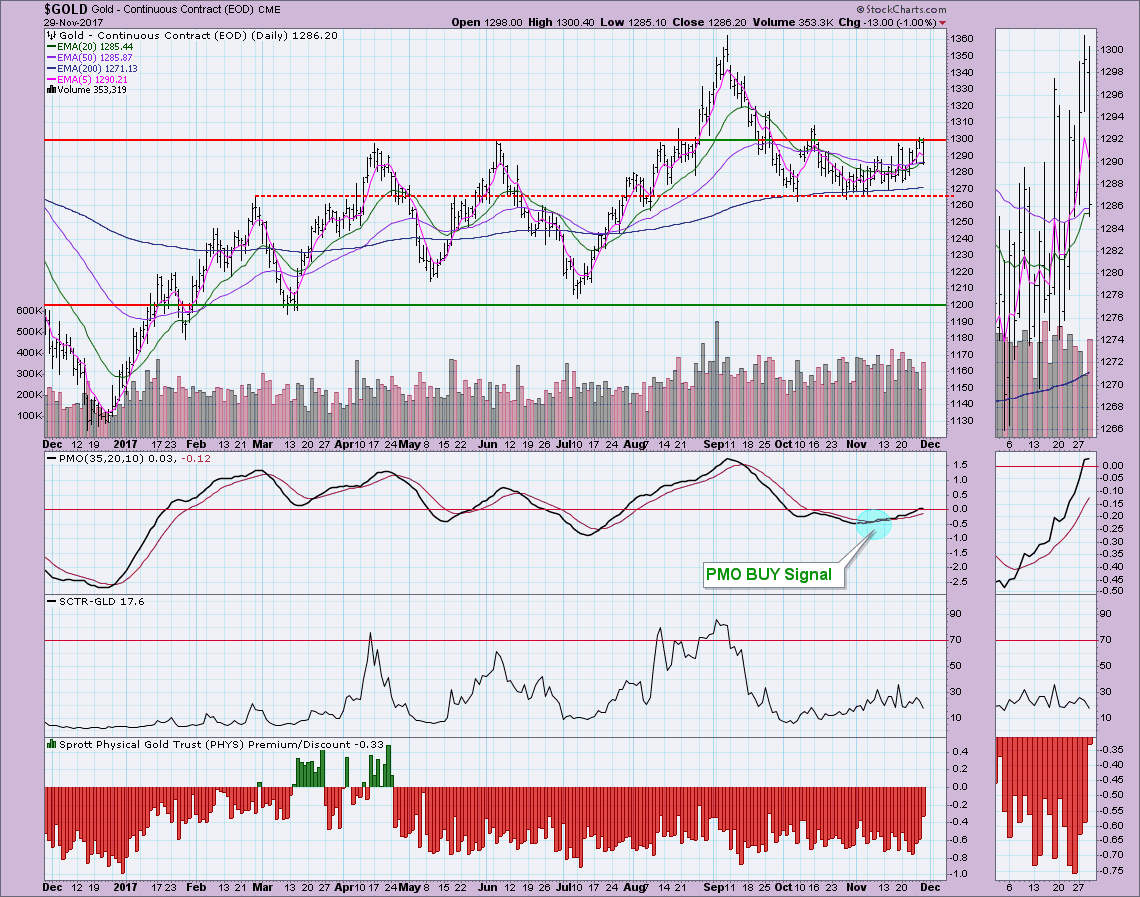
I've been staunchly in favor of Gold NOT being able to break above resistance at 1300. Seeing Gold turned back right at that level twice was very satisfying. The PMO is topping and the 20-EMA is topping beneath the 50-EMA. This weakness suggests that 1300 should hold as resistance. I'm looking for Gold to retreat to at least 1270.
CRUDE OIL (USO)
IT Trend Model: BUY as of 11/2/2017
LT Trend Model: BUY as of 9/7/2017
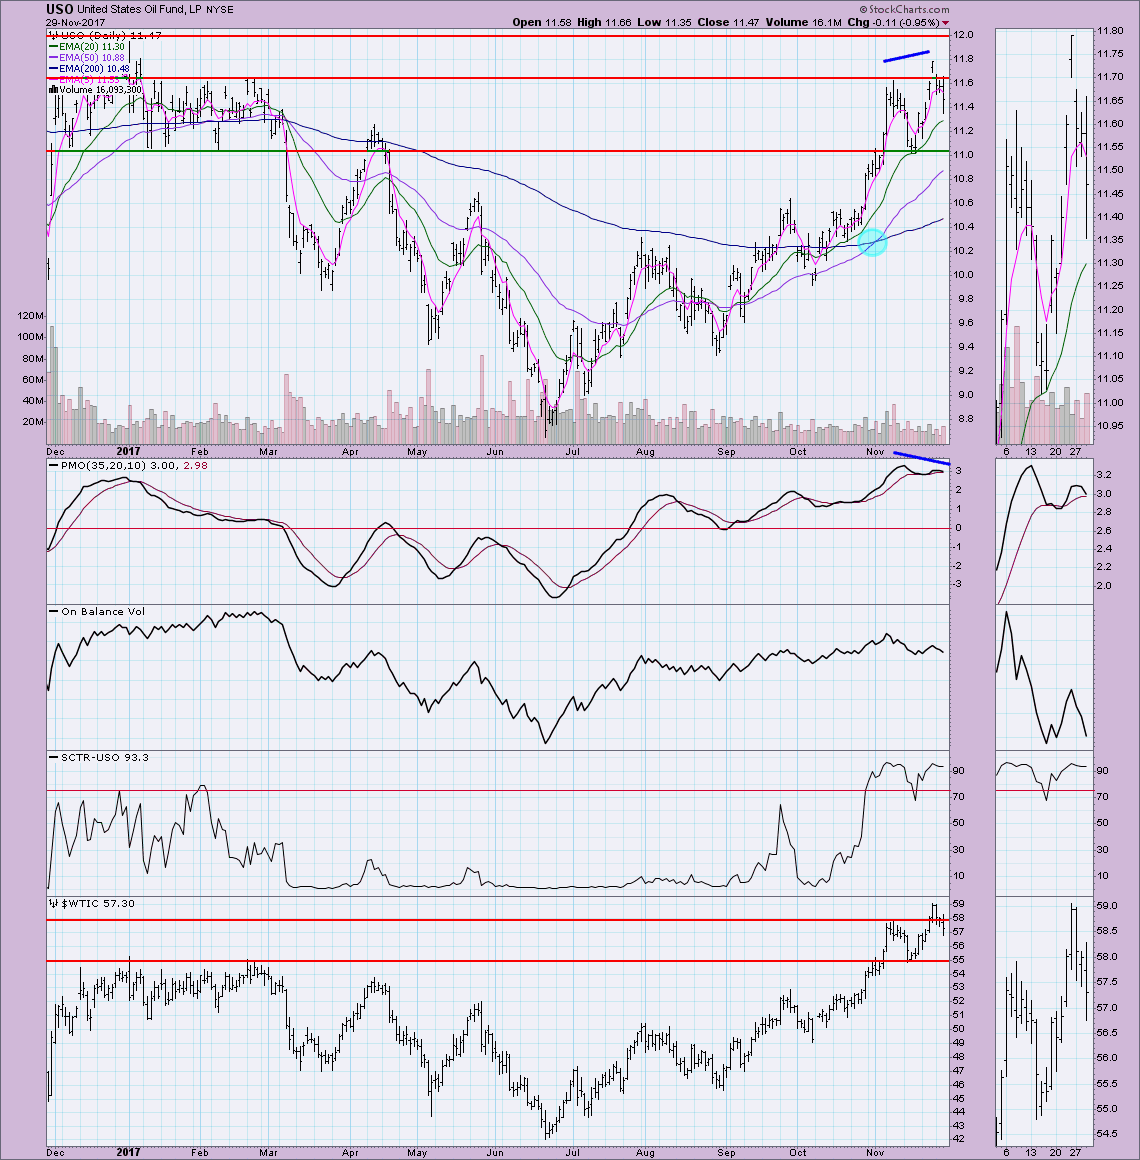
I recently pointed out a negative divergence between PMO and price tops. The decline is now in motion. I see a double-top formation coming together and that would suggest not a only a drop to $11, but a drop even further to the $10.20 to $10.40 level. However, let's not get ahead of ourselves. It isn't a double-top until the neckline is broken at $11. The PMO is about to trigger a SELL signal, so the correction isn't likely over.
BONDS (TLT)
IT Trend Model: BUY as of 11/8/2017
LT Trend Model: BUY as of 6/16/2017
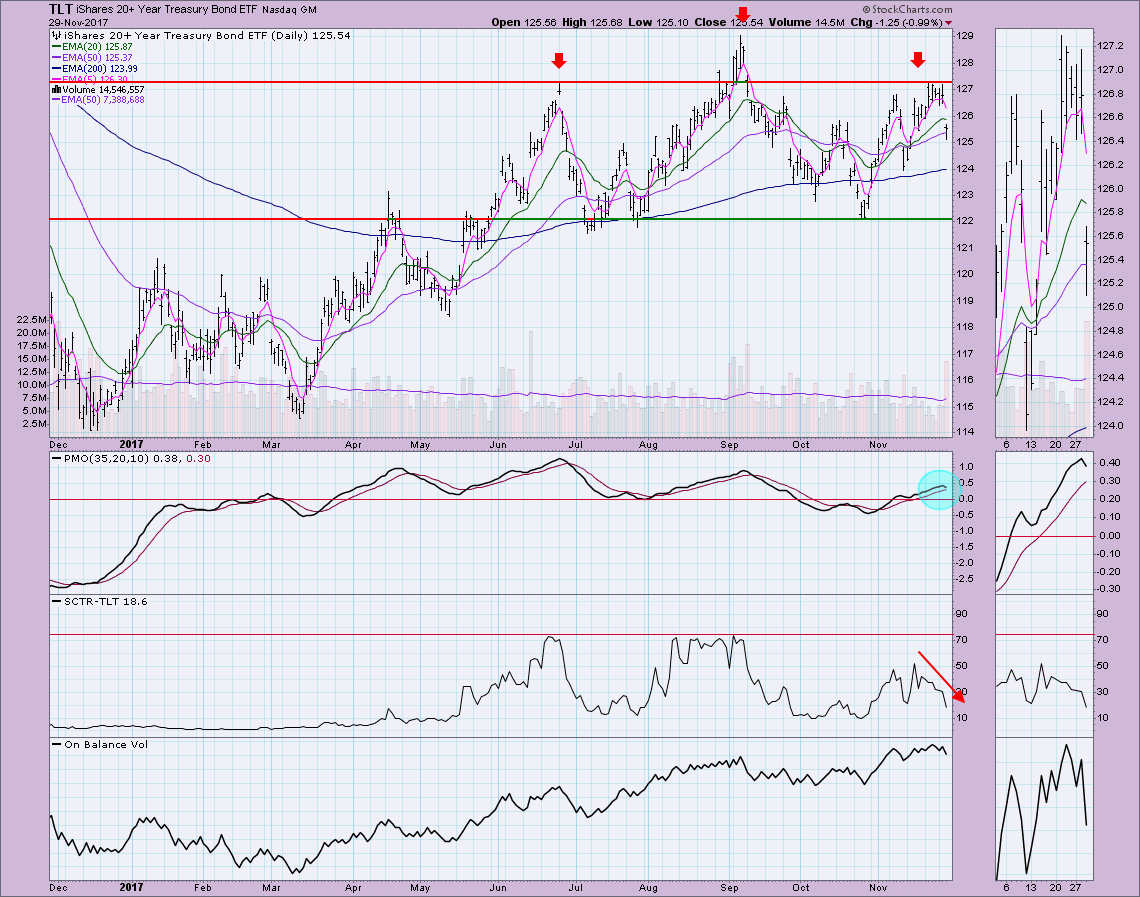
We're seeing a head and shoulders top forming on TLT. The PMO has topped and the SCTR is driving lower. I suspect that today's gap is a breakaway gap. I'm looking for price to test $122.
Helpful DecisionPoint Links:
DecisionPoint Shared ChartList and DecisionPoint Chart Gallery
Price Momentum Oscillator (PMO)
Swenlin Trading Oscillators (STO-B and STO-V)
Technical Analysis is a windsock, not a crystal ball.
Happy Charting!
- Erin
**Don't miss DecisionPoint Commentary! Add your email below to be notified of new updates"**

