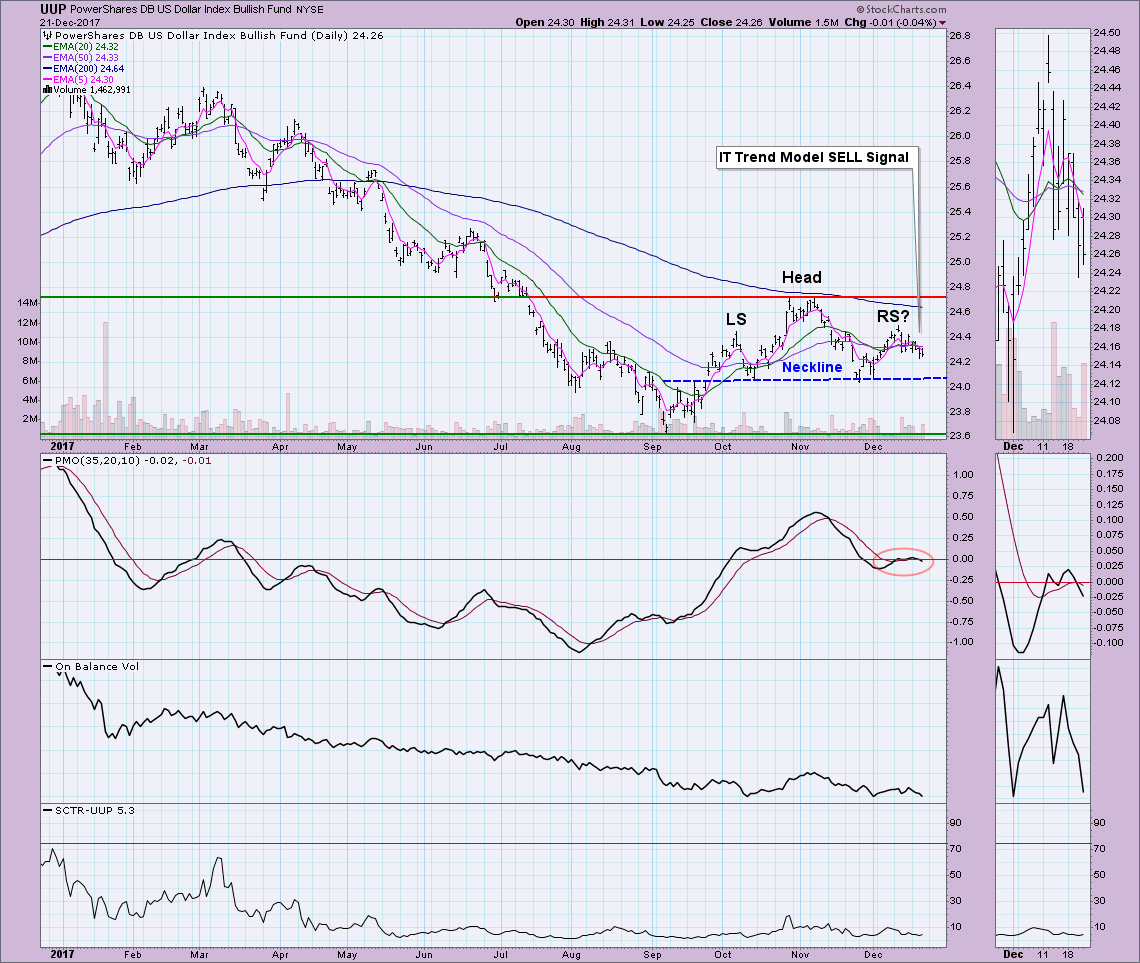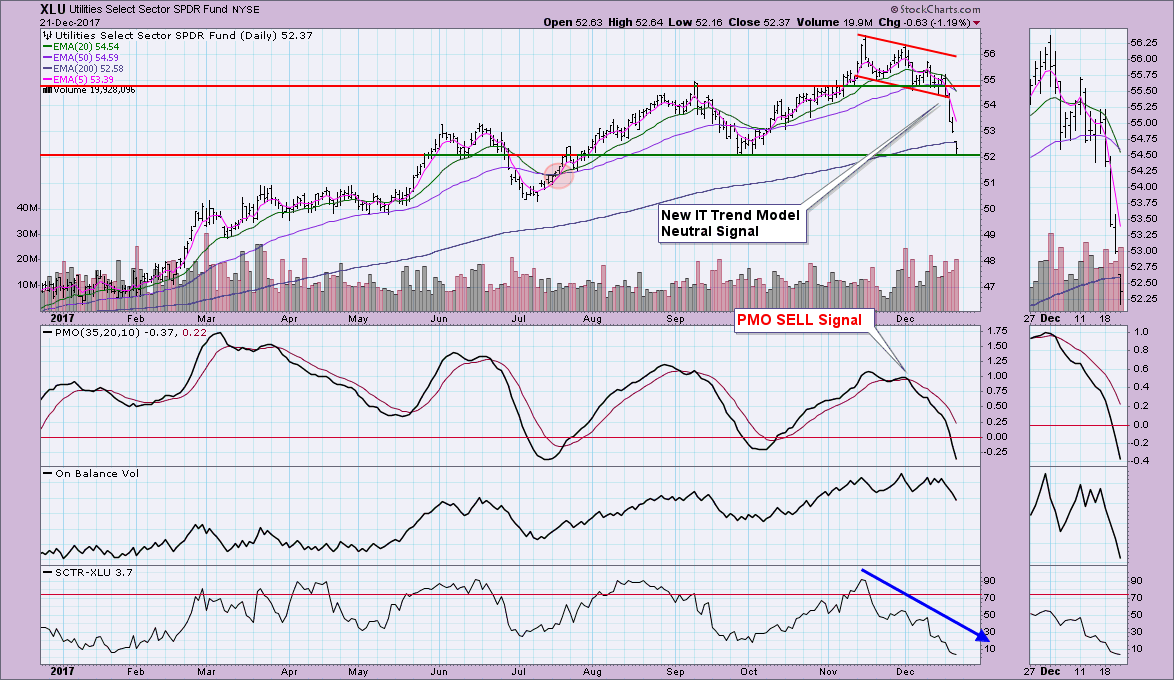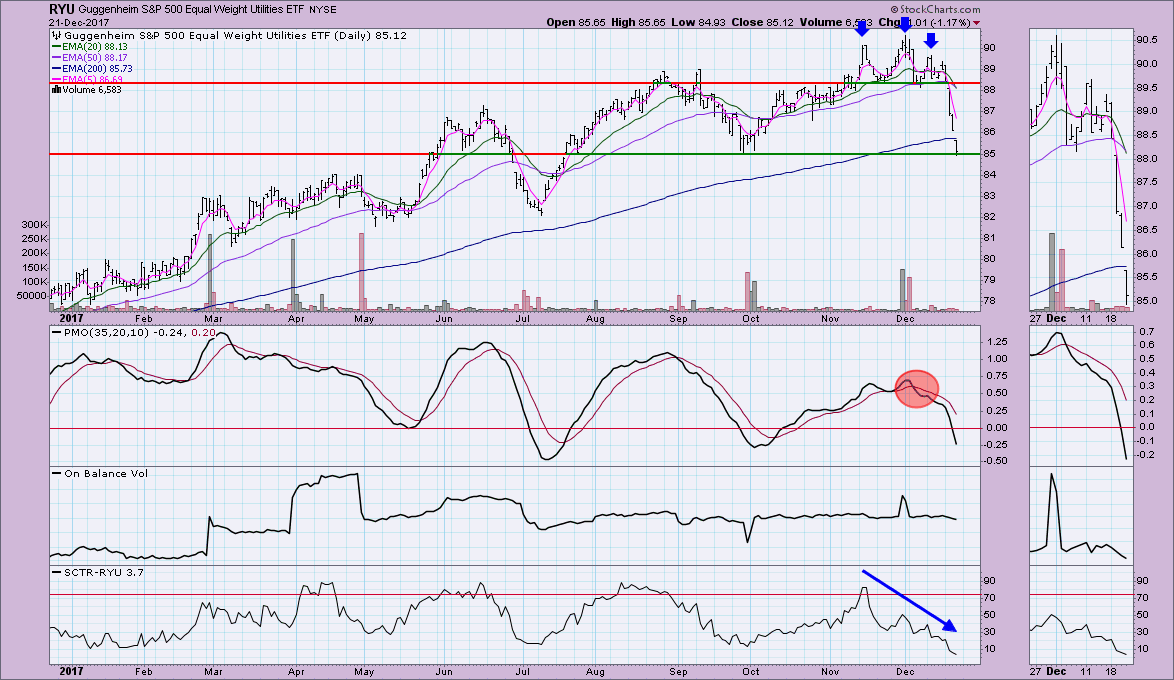
The Dollar (UUP) continues to form a bearish head and shoulders pattern in textbook fashion. The decline continues and consequently, there was a negative 20/50-EMA crossover BELOW the 200-EMA which constitutes an Intermediate-Term Trend Model (ITTM) SELL signal. For the Utilities SPDR (XLU) and Utilities Equal-Weight (RYU), new ITTM Neutral signals executed on a 20/50-EMA negative crossover ABOVE the 200-EMA which is why it is a Neutral signal and not a SELL signal.
Nothing bullish on this chart. I expect the Dollar to continue to decline and test September lows.
I warned everyone last week that there was an issue with the Utilities sector. The doom and gloom arrived, although I didn't expect the free fall correction that occurred this week. The PMO SELL signal came in nice and early, as did the ST Trend Model Neutral signal (5/20-EMA negative crossover above the 50-EMA).
The bearish head and shoulders executed with gusto as price dropped like a rock. It appears to have found an area of support. However, today price gapped below the 200-EMA. We haven't seen price below the 200-EMA in well over a year. I don't think utilities are a great place to try to find a bottom or catch that falling knife. The PMO has reached oversold territory, so there's a chance we'll see utilities rally, but a death drop like this doesn't smell like an exhaustion, more likely an initiation to lower prices.
Helpful DecisionPoint Links:
DecisionPoint Shared ChartList and DecisionPoint Chart Gallery
Price Momentum Oscillator (PMO)
Swenlin Trading Oscillators (STO-B and STO-V)
Technical Analysis is a windsock, not a crystal ball.
Happy Charting!
- Erin
**Don't miss DecisionPoint Commentary! Add your email below to be notified of new updates"**


