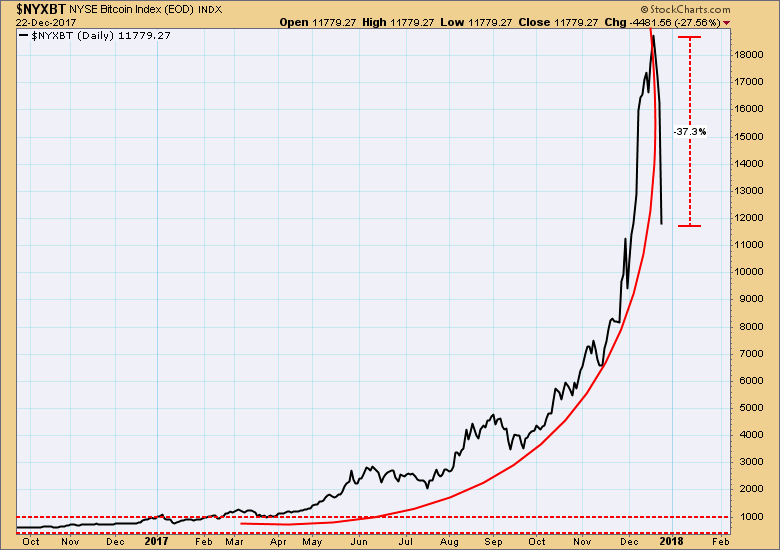
Two weeks ago I led with a chart of the Bitcoin Index. It was in a dangerous parabolic advance, and I said: "Yes, price could go higher, but it is also at a point where the parabolic could collapse, and the potential downside is back down to the support of the basing pattern between 400 and 1000." Well, it did go higher by about +15%, and this week it collapsed, down almost -40% on a closing basis. It is still far from the potential downside, but the danger has been clearly demonstrated.
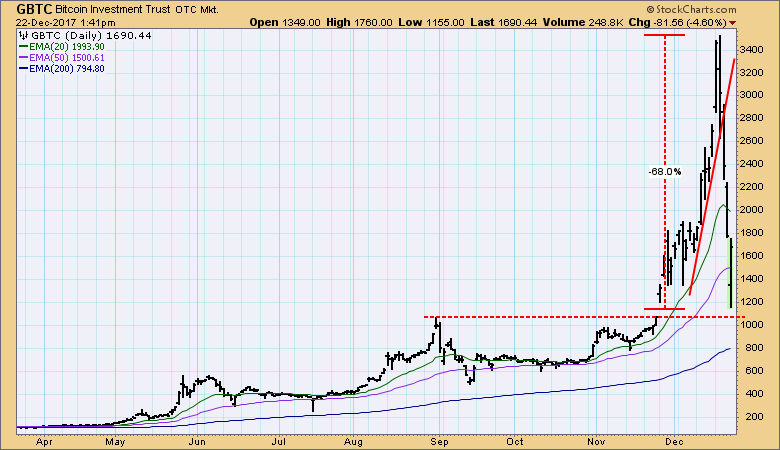
The Bitcoin ETF chart shows the intraday swings, and it emphasizes how quickly a parabolic can crash.
The DecisionPoint Weekly Wrap presents an end-of-week assessment of the trend and condition of the stock market (S&P 500), the U.S. Dollar, Gold, Crude Oil, and Bonds.
STOCKS
IT Trend Model: BUY as of 11/15/2016
LT Trend Model: BUY as of 4/1/2016
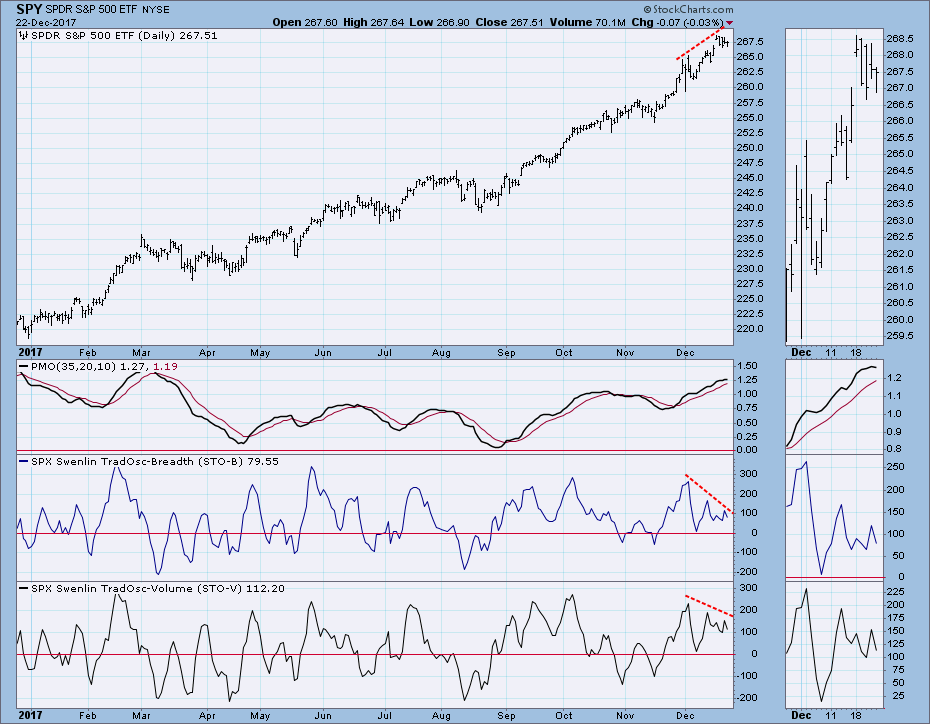
Daily Chart: On the six-month chart we see that last week price finished inside a tight rising wedge formation, which we normally expect to resolve downward. But this week, the short odds paid off as price popped upward on Monday. Now another wedge has formed, and as usual we should expect it to break down.
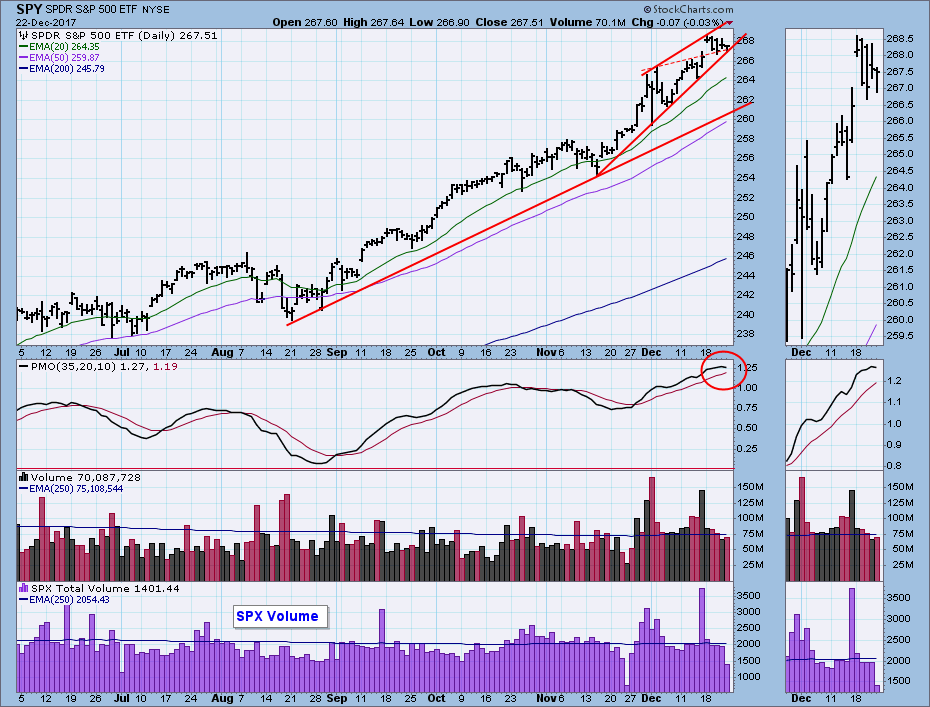
Let's zoom out to one year. Here we can see that price has advanced on ever-steepening trend lines. This is a parabolic advance (though not as extreme as we saw on the Bitcoin chart), and it calls for some corrective action.
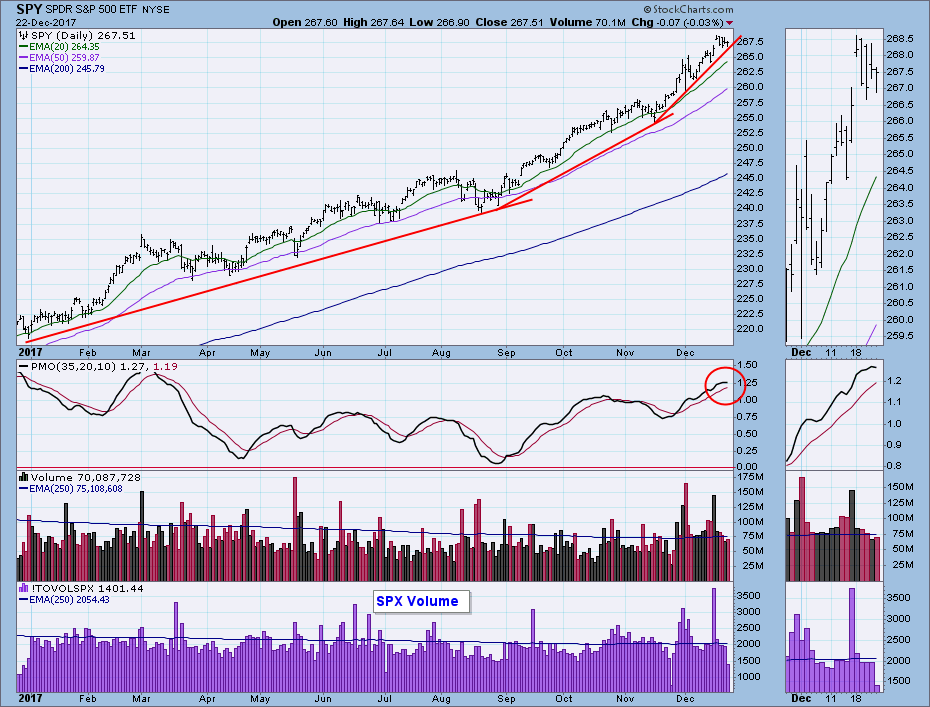
Weekly Chart: For the fourth consecutive week price is still contained by the top of the two-year rising trend channel.
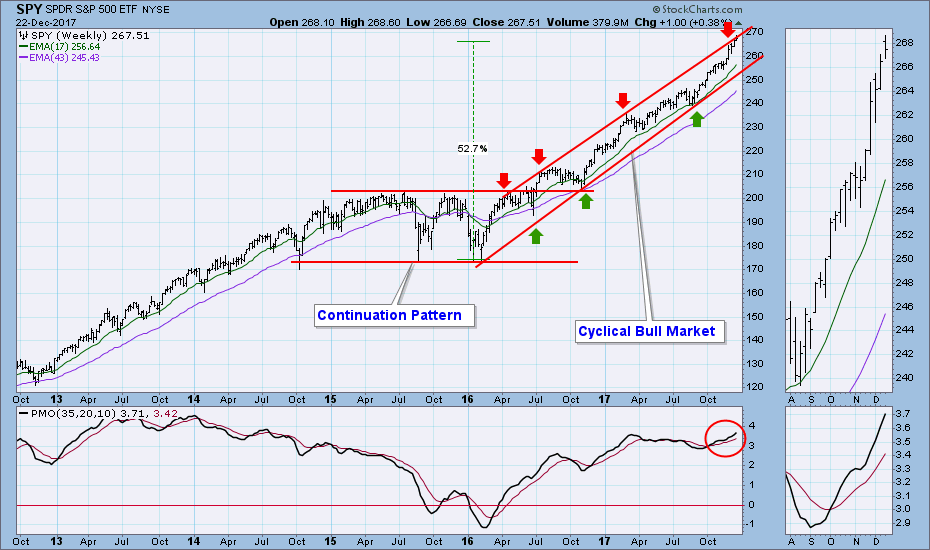
Short-Term Market Indicators: The negative divergences persist.
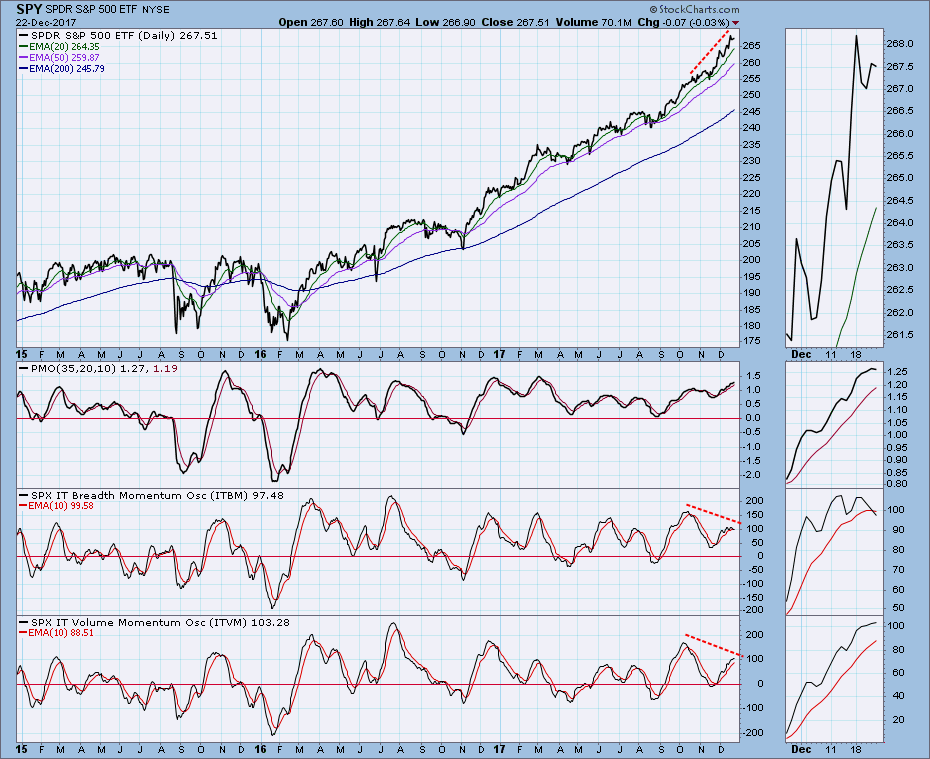
Intermediate-Term Market Indicators: Negative divergences persist in this time frame also, and note that the ITBM has dropped below the signal line.
Conclusion: I keep looking for some corrective action, but the market keeps giving me higher prices. Nevertheless, I think we're headed for an important top soon -- not necessarily the top, but something that will stand out when compared with the tiny speed bumps we have experienced this year. Next week is a placeholder between Christmas and New Year, and market action will probably be unremarkable. Maybe things will get more interesting when we come back to work in 2018. Have a great Christmas!
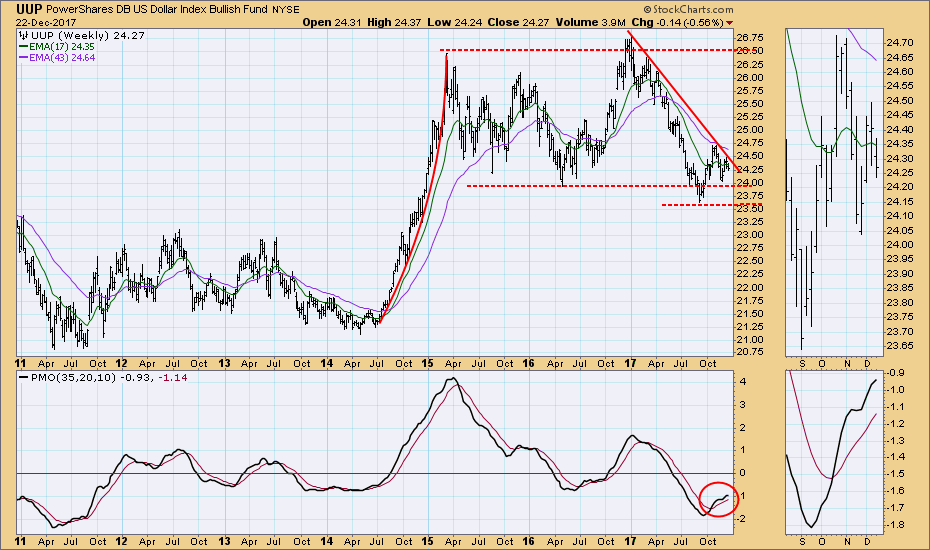
DOLLAR (UUP)
IT Trend Model: SELL as of 12/21/2017
LT Trend Model: SELL as of 5/24/2017
Daily Chart: This week UUP generated another IT Trend Model SELL signal when the 20EMA crossed down through the 50EMA. Because of the narrowing price range, this is the fourth signal change in about two months, and I don't yet sense any commitment to the downside, or the upside for that matter.
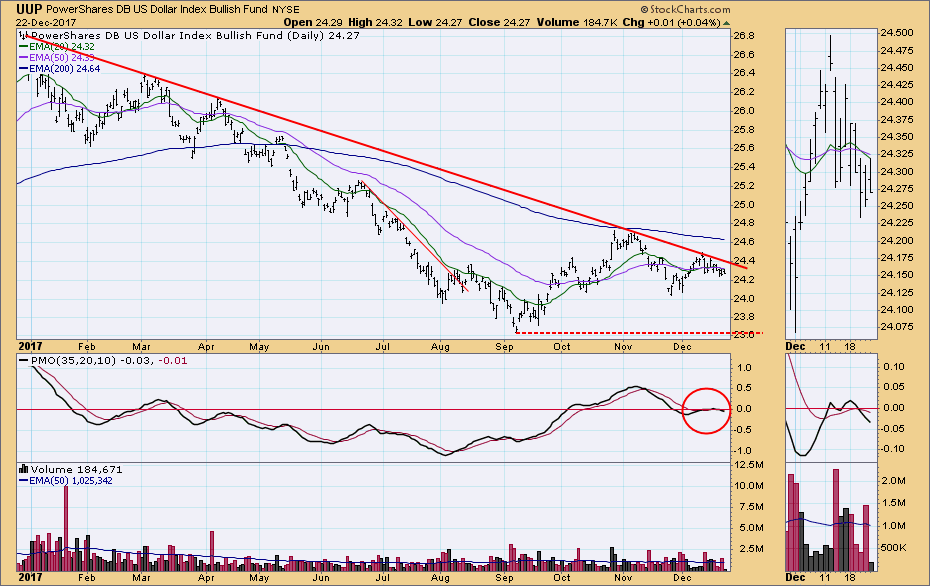
Weekly Chart: UUP has bounced off two levels of support, and the weekly PMO is rising, so the picture is somewhat positive in this time frame.
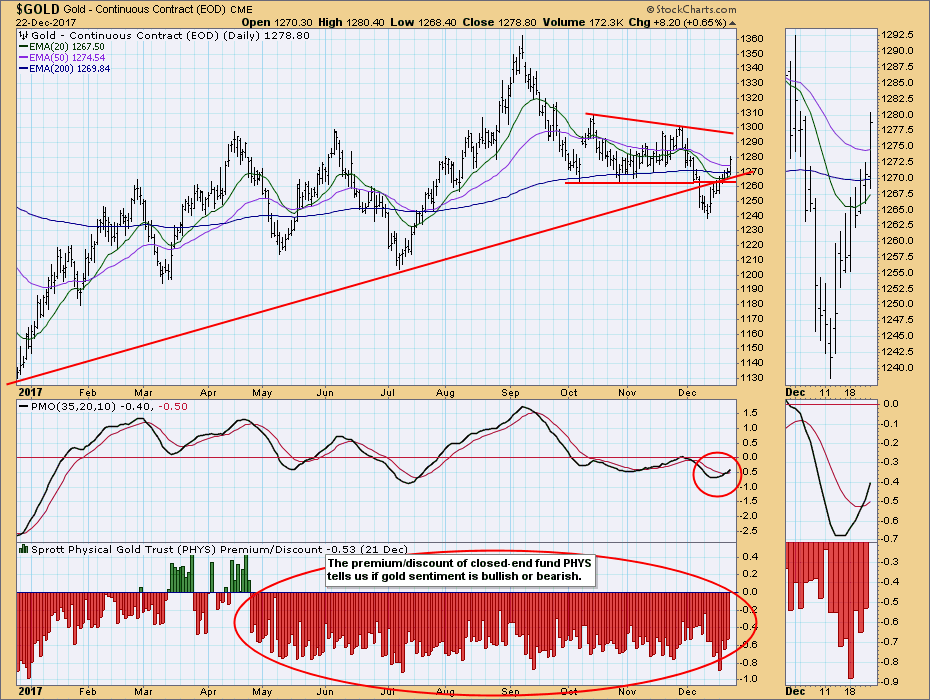
GOLD
IT Trend Model: NEUTRAL as of 10/20/2017
LT Trend Model: BUY as of 4/12/2017
Daily Chart: After breaking down below support, gold has rebounded and recaptured the support. The daily PMO has bottomed and crossed up through the signal line. My impression is that gold is still struggling, but is trying to turn positive.
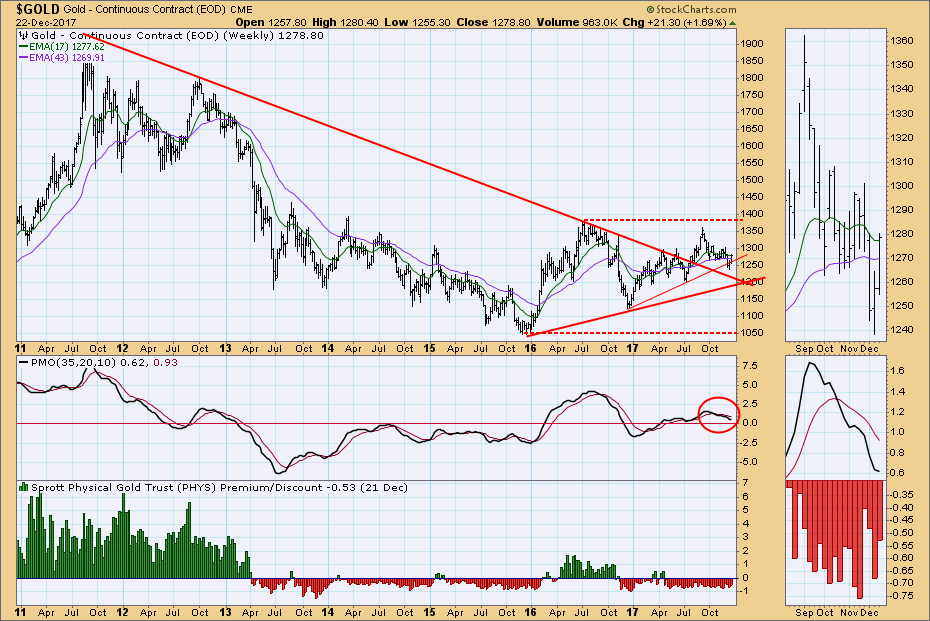
Weekly Chart: In this time frame we can find encouragement from the fact that gold remains above the long-term declining tops line that defined the last bear market.
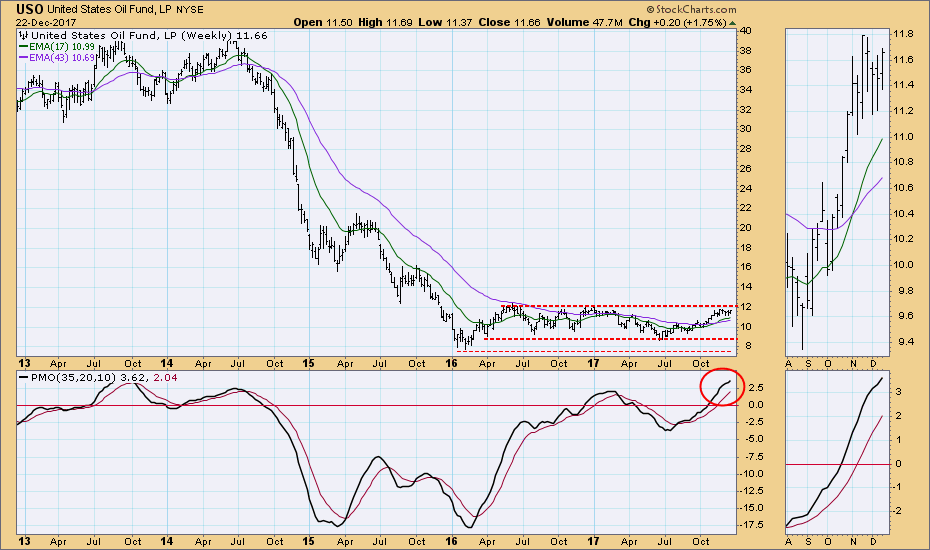
CRUDE OIL (USO)
IT Trend Model: BUY as of 9/6/2017
LT Trend Model: BUY as of 11/2/2017
Daily Chart: USO is struggling to break away from a pennant formation, and the daily PMO is trying to bottom.
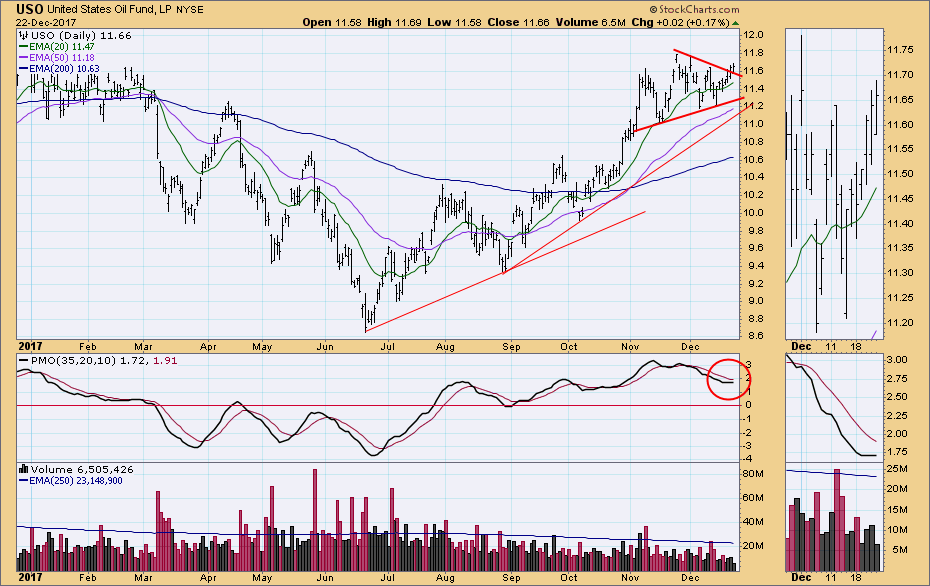
Weekly Chart: The difficulty we see on the daily chart is clarified in this time frame. USO is at the top of its trading range and resistance has come into play.
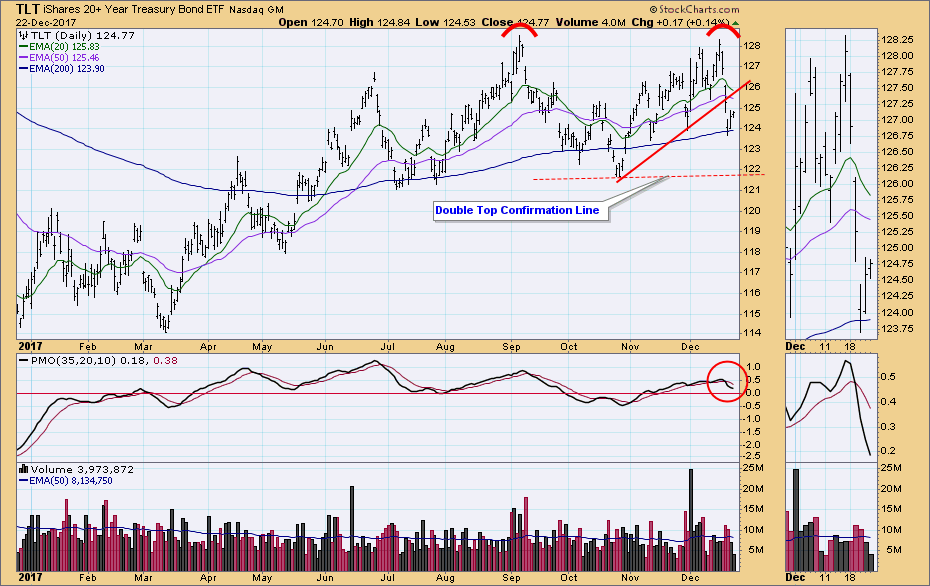
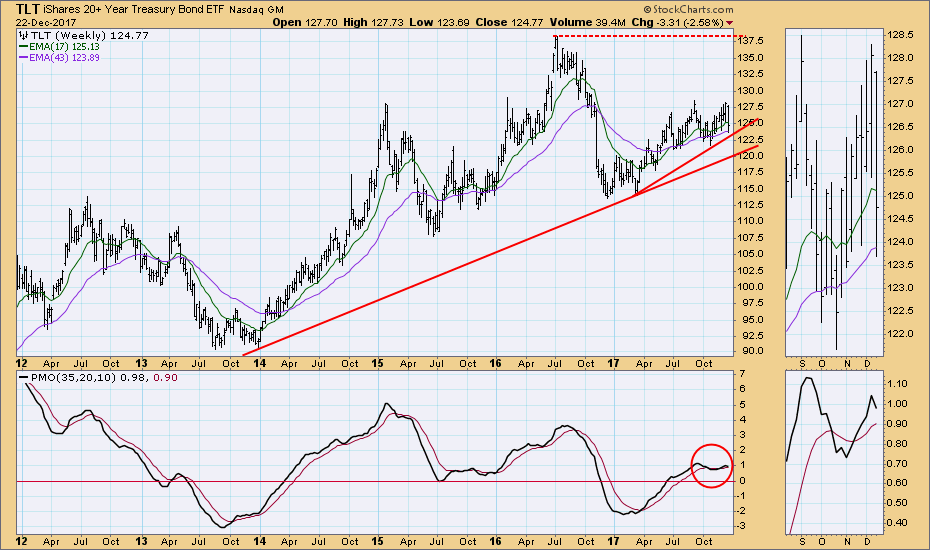
BONDS (TLT)
IT Trend Model: BUY as of 11/8/2017
LT Trend Model: BUY as of 6/16/2017
Daily Chart: A rising trend line was broken, and the PMO crossed down through its signal line. Now the most obvious feature is a double top, which will execute when price drops below the confirmation line.
Weekly Chart: In this time frame we can see that there is possible support offered by a rising trend line not far below. The weekly PMO has topped.
**Don't miss any of the DecisionPoint commentaries! Go to the "Notify Me" box toward the end of this blog page to be notified as soon as they are published.**
Technical Analysis is a windsock, not a crystal ball.
Happy Charting!
- Carl
NOTE: The signal status reported herein is based upon mechanical trading model signals, specifically, the DecisionPoint Trend Model. They define the implied bias of the price index based upon moving average relationships, but they do not necessarily call for a specific action. They are information flags that should prompt chart review. Further, they do not call for continuous buying or selling during the life of the signal. For example, a BUY signal will probably (but not necessarily) return the best results if action is taken soon after the signal is generated. Additional opportunities for buying may be found as price zigzags higher, but the trader must look for optimum entry points. Conversely, exit points to preserve gains (or minimize losses) may be evident before the model mechanically closes the signal.
Helpful DecisionPoint Links:
DecisionPoint Shared ChartList and DecisionPoint Chart Gallery
Price Momentum Oscillator (PMO)
Swenlin Trading Oscillators (STO-B and STO-V)


