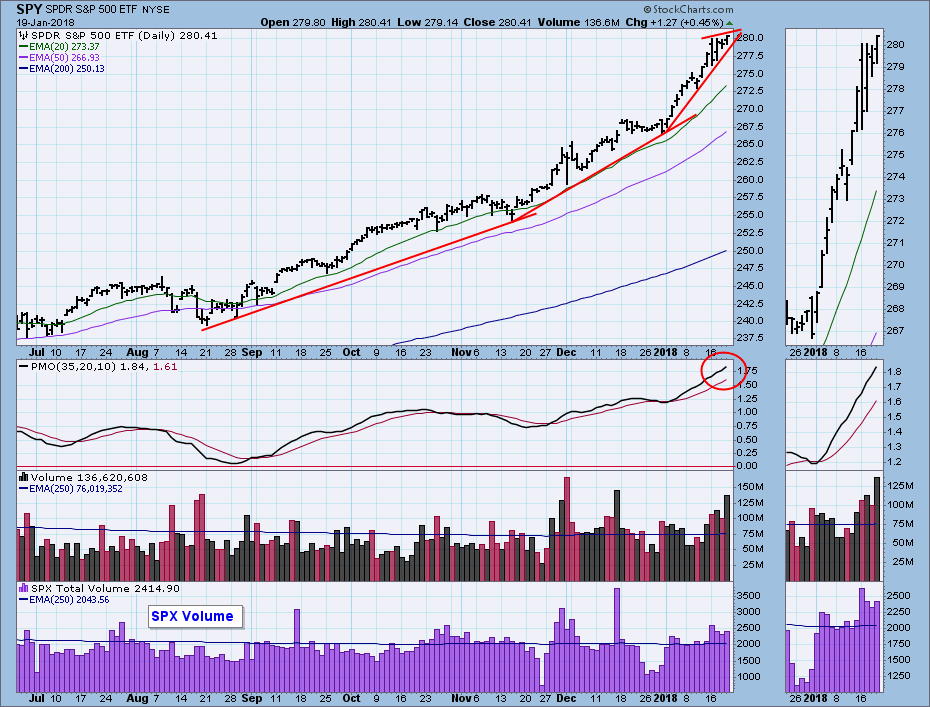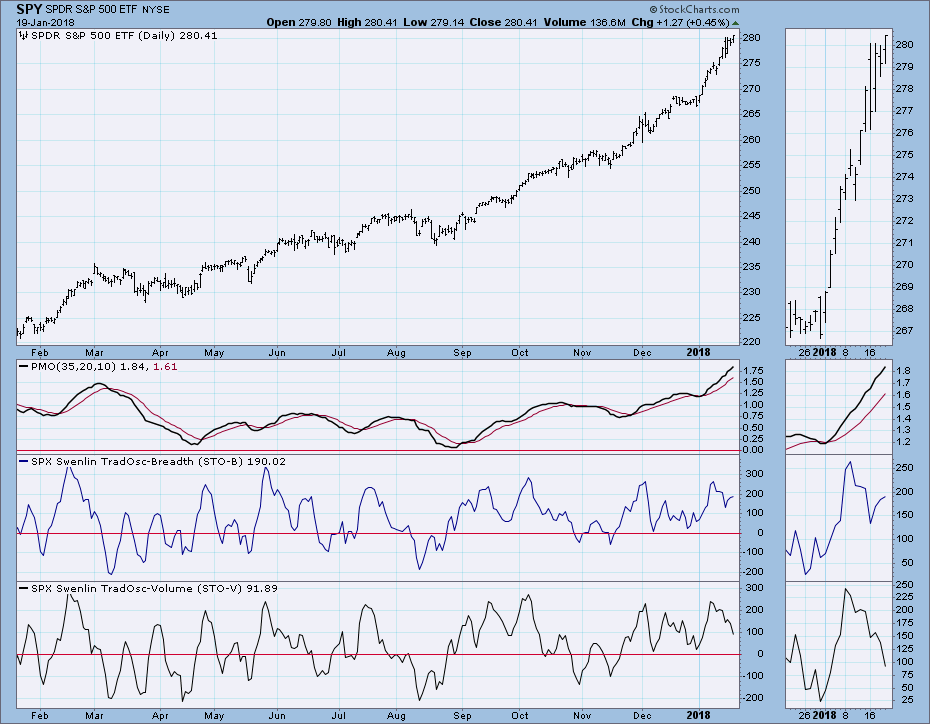
Friday was the last trading day before options expiration, so higher than normal volume should be attributed to that, not to other interpretations of volume versus price movement. We began the trading week with another breakout to new, all-time highs, but that turned into an intraday reversal. But not to worry, the decline only brought price back to the January rising trend line, which held for the rest of the week. In the process, price was squeezed into a short-term rising wedge. Typically, these formations resolve downward, but, let me guess, this wedge will probably resolve to the upside. It's still not too late for a price top, but I'm not holding my breath.
The DecisionPoint Weekly Wrap presents an end-of-week assessment of the trend and condition of the stock market (S&P 500), the U.S. Dollar, Gold, Crude Oil, and Bonds.
STOCKS
IT Trend Model: BUY as of 11/15/2016
LT Trend Model: BUY as of 4/1/2016
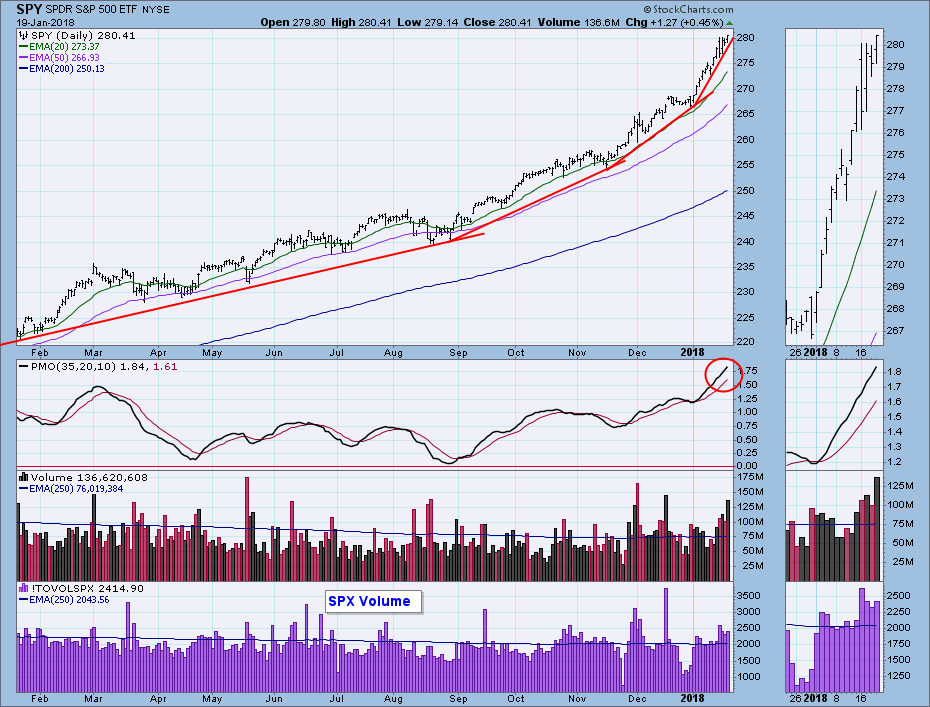
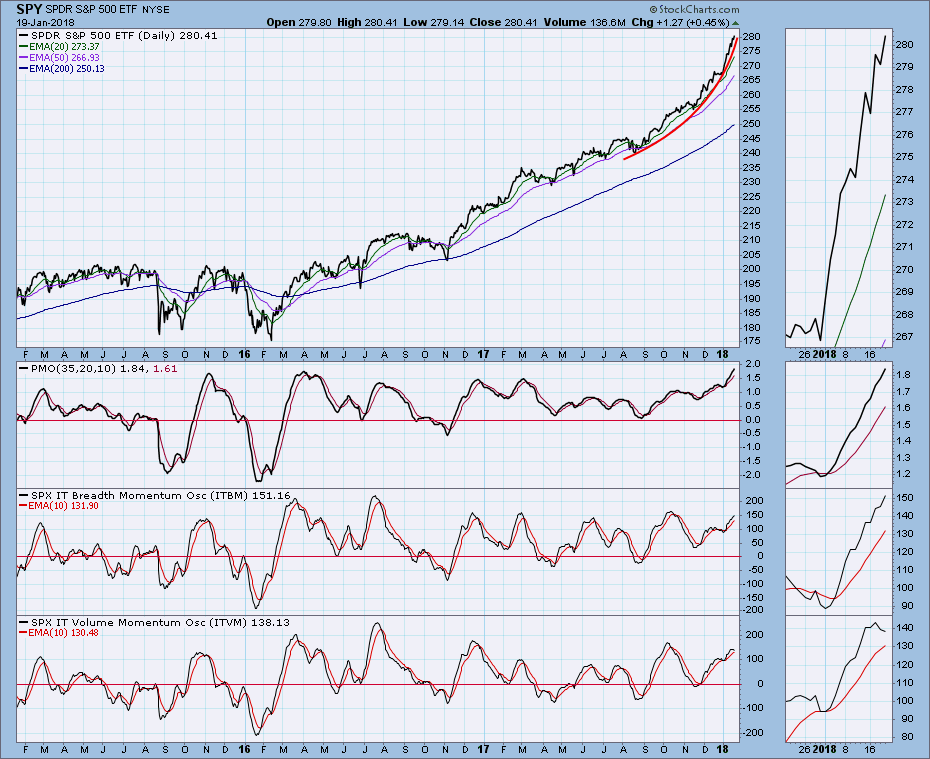
Daily Chart: The problem visible on this chart is the ever-increasing angle of ascent of the price index. The steeper it gets the less likely it is to continue, but it is still impossible to predict when it will end. There was some sideways churn this week, but it didn't do any technical damage. Another issue is that the EMAs are really spread apart, so, in the event of a serious decline, it will take a lot of time before we get EMA downside crossovers to generate signal changes.
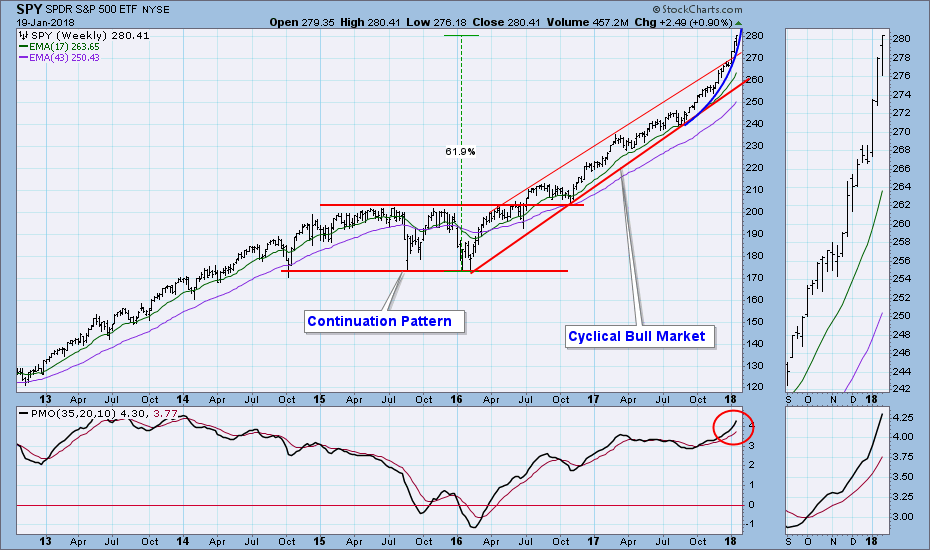
Weekly Chart: SPY has moved out of the cyclical bull market rising trend channel in a parabolic arc. This near-vertical path is unsustainable, and the normal trend channel beckons. A decline back to the rising trend line would require a decline of about -7%, which would do a lot to relieve the current excesses without killing the golden goose.
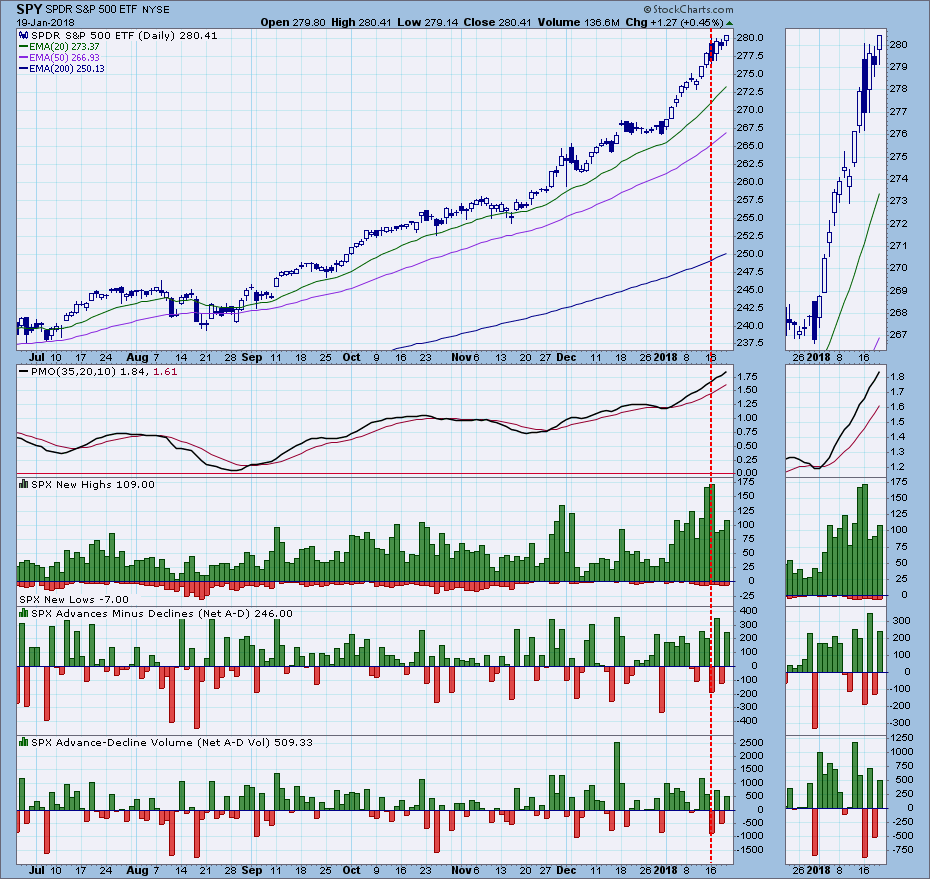
Climactic Market Indicators: There was a climax of New Highs on Tuesday, then a sharp contraction of New Highs the next day. There was a climax of Advances on Wednesday, then an absence of climaxes the rest of the week. This is the kind of activity that makes me look for a short, sharp pullback, but this market has too much upside bias to accommodate such expectations.
Short-Term Market Indicators: More neutral than helpful.
Intermediate-Term Market Indicators: These indicators are getting overbought, but March of last year was the last time that term had any meaning.
Conclusion: For weeks I have been expressing concern about the market's the near vertical price rise, and I am still concerned because it is worse than ever. Our intermediate-term indicators are overbought, and price is still parabolic. During the week I was thinking that there might be justification for being less concerned, but there's not. It was just me being momentarily worn down by the bull.
As for the parabolic nature of the advance, let's get a little perspective on that. One concept of how a parabolic resolves is that price breaks down dramatically and crashes down to unimaginable depths. I have seen this happen, but that is not our current situation. The parabolic began off the August lows, and that would be the lowest that I would expect price to correct. A more realistic target would be for price to decline about -7%, but even that may be too ambitious. Seriously, we will probably see some kind of pullback, but it will likely be far less than people like me will be satisfied with.
DOLLAR (UUP)
IT Trend Model: SELL as of 12/21/2017
LT Trend Model: SELL as of 5/24/2017
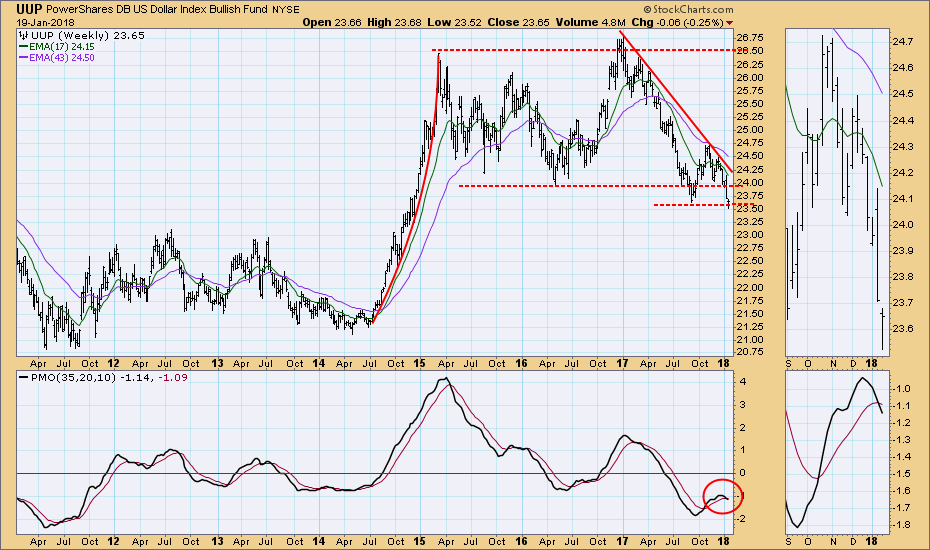
Daily Chart: UUP has broken below a support line drawn from the September low, and it has been consolidating just below it. This is a classic reverse flag/pennant formation, which tells us to expect lower prices.
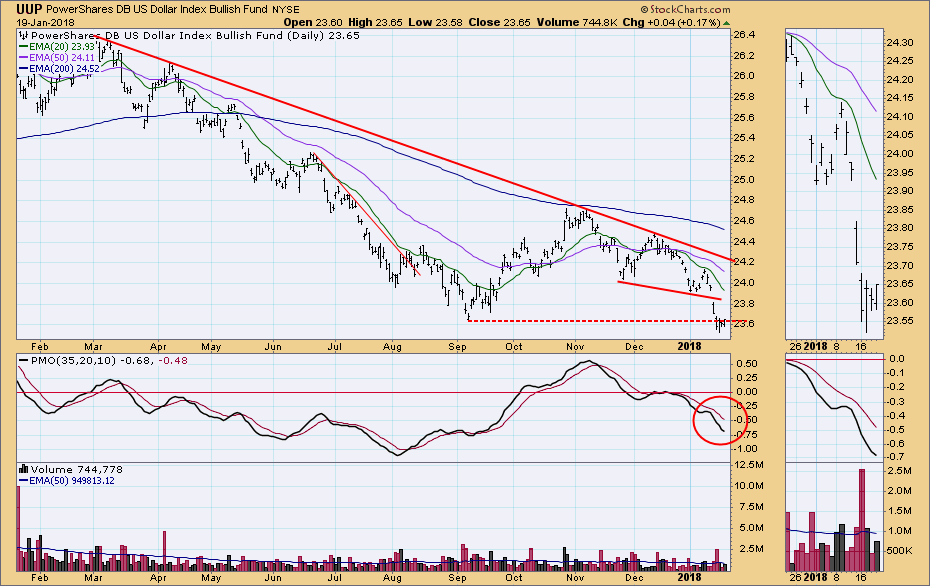 Weekly Chart: UUP looks bearish in this time frame because the weekly PMO has topped below the zero line, and it is falling below the signal line.
GOLD
IT Trend Model: BUY as of 1/2/2018
LT Trend Model: BUY as of 4/12/2017
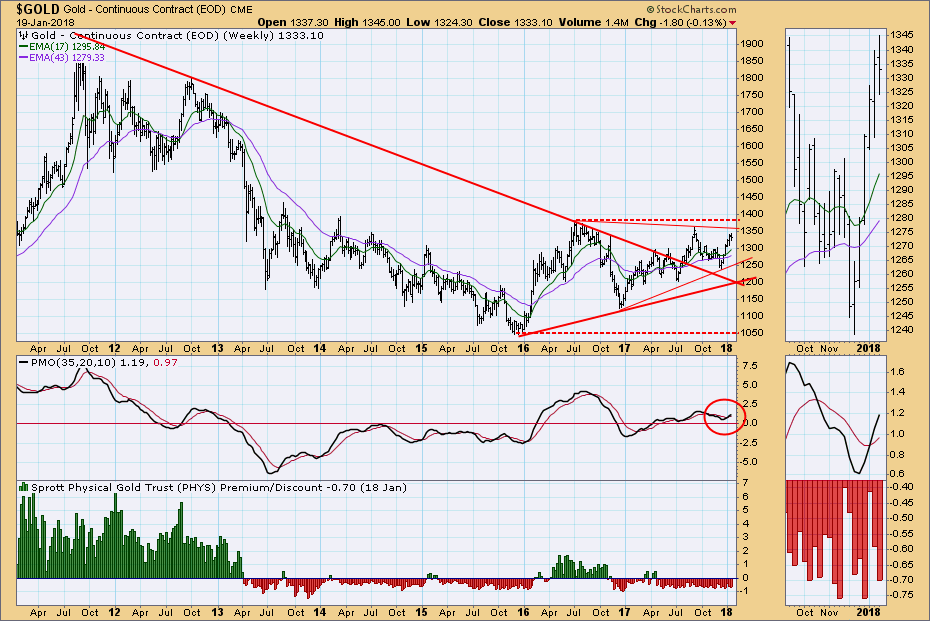
Daily Chart: Last week gold had a strong breakout from a flag formation, but there was no follow through this week. Instead price pulled back to the point of breakout, and the daily PMO is close to topping.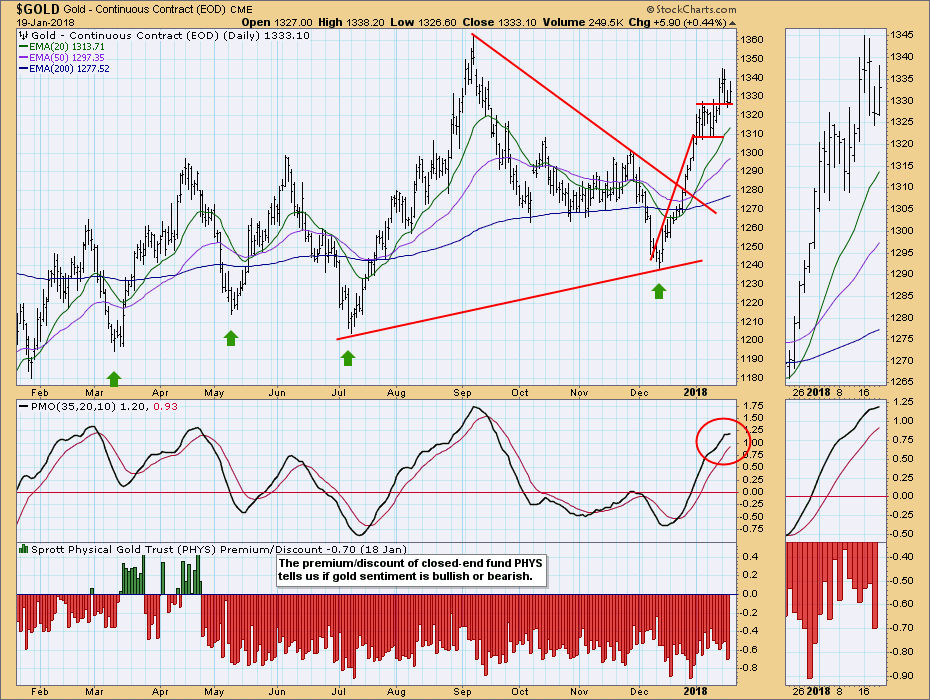
Weekly Chart: Gold is still bullish in this time frame, but it needs to move above the 2016 top in order to establish a rising trend from the 2016 low.
CRUDE OIL (USO)
IT Trend Model: BUY as of 9/6/2017
LT Trend Model: BUY as of 11/2/2017
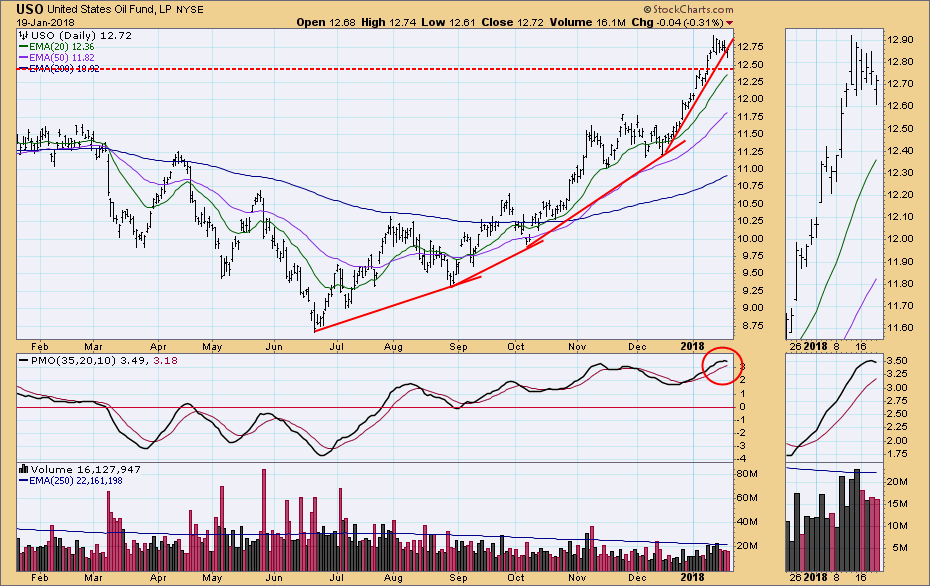
Daily Chart: USO has decisively broken above the top of a two-year trading range. On Friday the one-month rising trend line was penetrated during what is probably a technical pullback to the horizontal support line. The overbought daily PMO has topped, but that may only be signalling the kind of sideways action we saw in November/December.
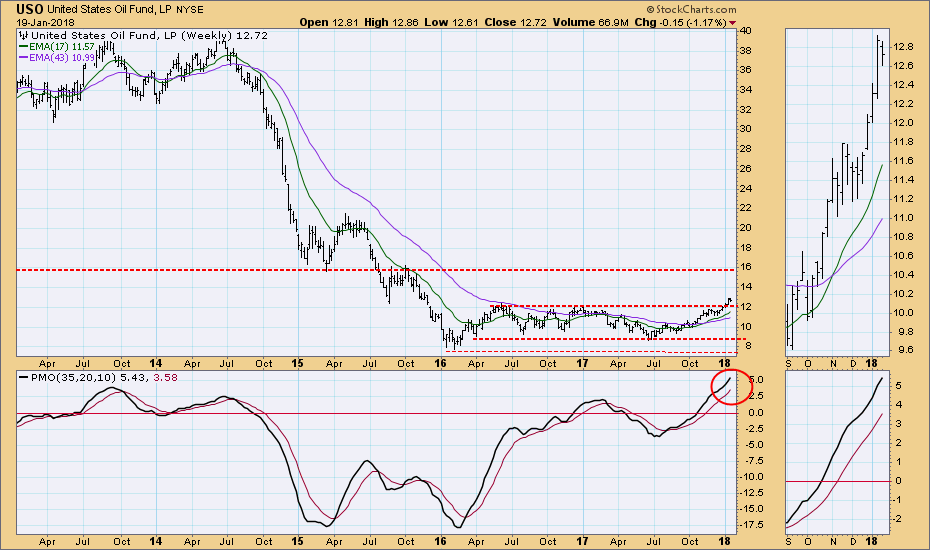
Weekly Chart: Assuming that the breakout holds, the next resistance level for USO is about 16.00.
BONDS (TLT)
IT Trend Model: NEUTRAL as of 1/11/2018
LT Trend Model: BUY as of 6/16/2017
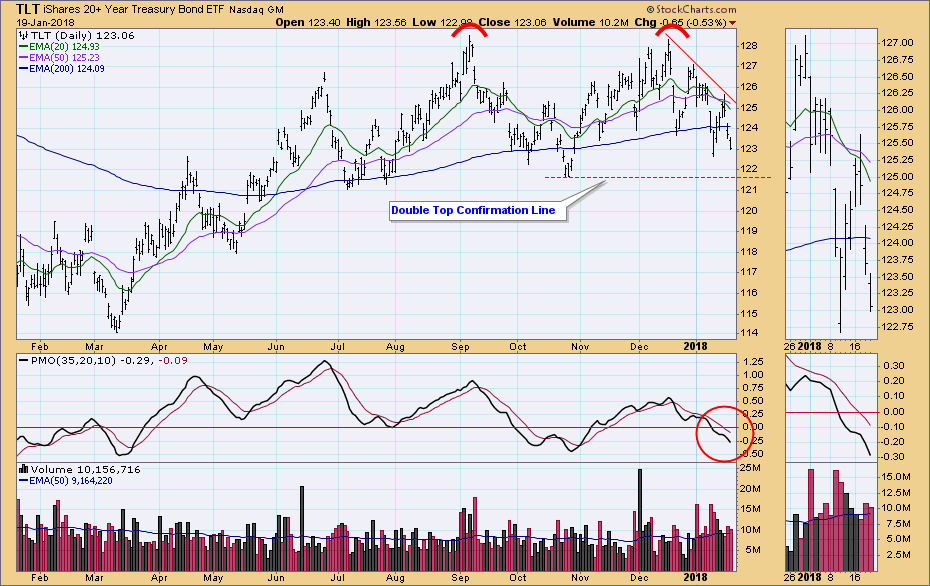
Daily Chart: TLT continues to trend downward from the December top, which is the second top in a developing double top formation. The daily PMO is falling below the signal line and the zero line.
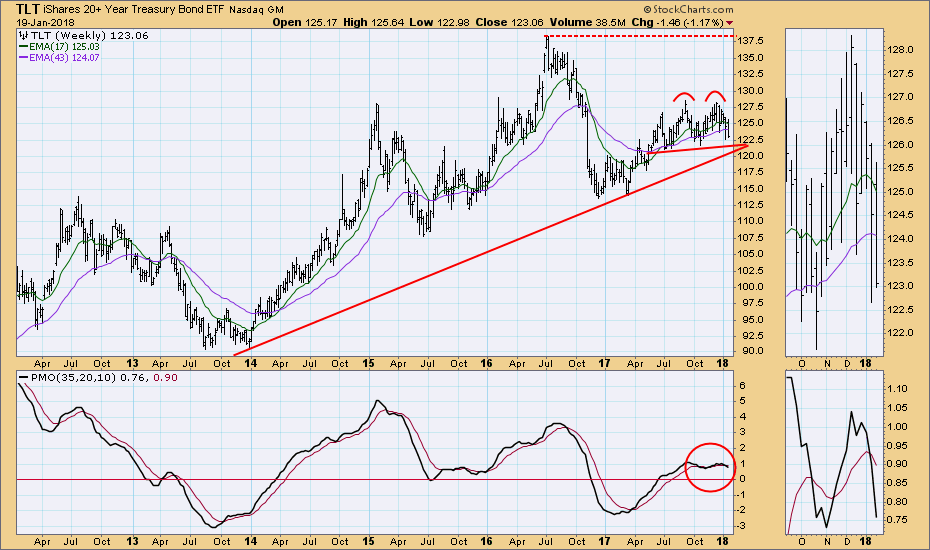
Weekly Chart: Since June the price advance has slowed, and the weekly PMO has gone flat in response to this. The double top formation probably constitutes the lower second top in a long-term down trend, but that trend won't be officially established until the 2016/17 lows are taken out.
**Don't miss any of the DecisionPoint commentaries! Go to the "Notify Me" box toward the end of this blog page to be notified as soon as they are published.**
Technical Analysis is a windsock, not a crystal ball.
Happy Charting!
- Carl
NOTE: The signal status reported herein is based upon mechanical trading model signals, specifically, the DecisionPoint Trend Model. They define the implied bias of the price index based upon moving average relationships, but they do not necessarily call for a specific action. They are information flags that should prompt chart review. Further, they do not call for continuous buying or selling during the life of the signal. For example, a BUY signal will probably (but not necessarily) return the best results if action is taken soon after the signal is generated. Additional opportunities for buying may be found as price zigzags higher, but the trader must look for optimum entry points. Conversely, exit points to preserve gains (or minimize losses) may be evident before the model mechanically closes the signal.
Helpful DecisionPoint Links:
DecisionPoint Shared ChartList and DecisionPoint Chart Gallery
Price Momentum Oscillator (PMO)
Swenlin Trading Oscillators (STO-B and STO-V)

