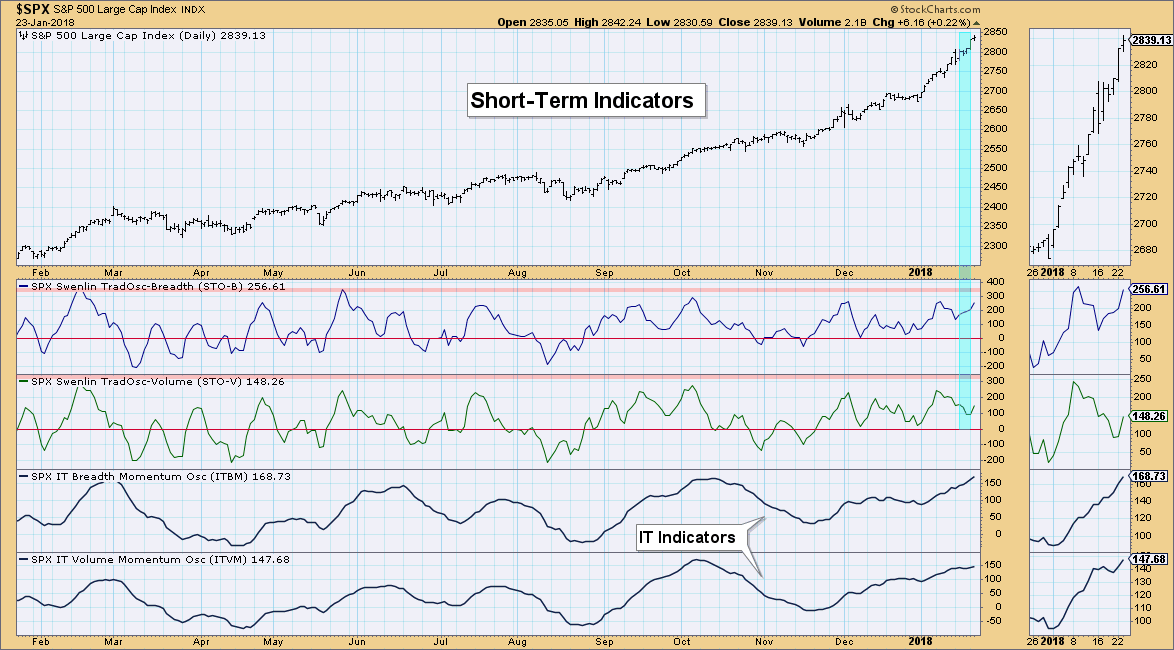
On Monday's MarketWatchers LIVE program during the "DecisionPoint Report", I highlighted a divergence between the Swenlin Trading Oscillators (STOs). I admitted that I hadn't seen a divergence lasting over a day or two. These are short-term indicators that generally travel in concert. The difference between them is that one is based on breadth (advances/declines) and the other on volume (advancing/declining volume).
This divergence began last week and ended today. Seeing the divergence between the STO-B and STO-V with the volume indicator moving lower suggests that volume wasn't behind the current rally. The near-term divergence ended with the STO-V moving up today. However, an intermediate-term divergence isn't out of the question. If we see a higher top on the STO-B and a lower top on the STO-V, that wouldn't bode well for the next few months. On the bright side, the ITBM and ITVM (intermediate-term indicators) are floating higher. If the ITVM tops below the October top, that would signal another divergence but in the longer term.
Conclusion: I'll be watching (and reporting) closely as these indicators continue their travels. We haven't see a divergence of STO tops in the last year. If we do get a divergence, the caution flag will be raised and waved.
Helpful DecisionPoint Links:
DecisionPoint Shared ChartList and DecisionPoint Chart Gallery
Price Momentum Oscillator (PMO)
Swenlin Trading Oscillators (STO-B and STO-V)
Technical Analysis is a windsock, not a crystal ball.
Happy Charting!
- Erin
**Don't miss DecisionPoint Commentary! Add your email below to be notified of new updates"**


