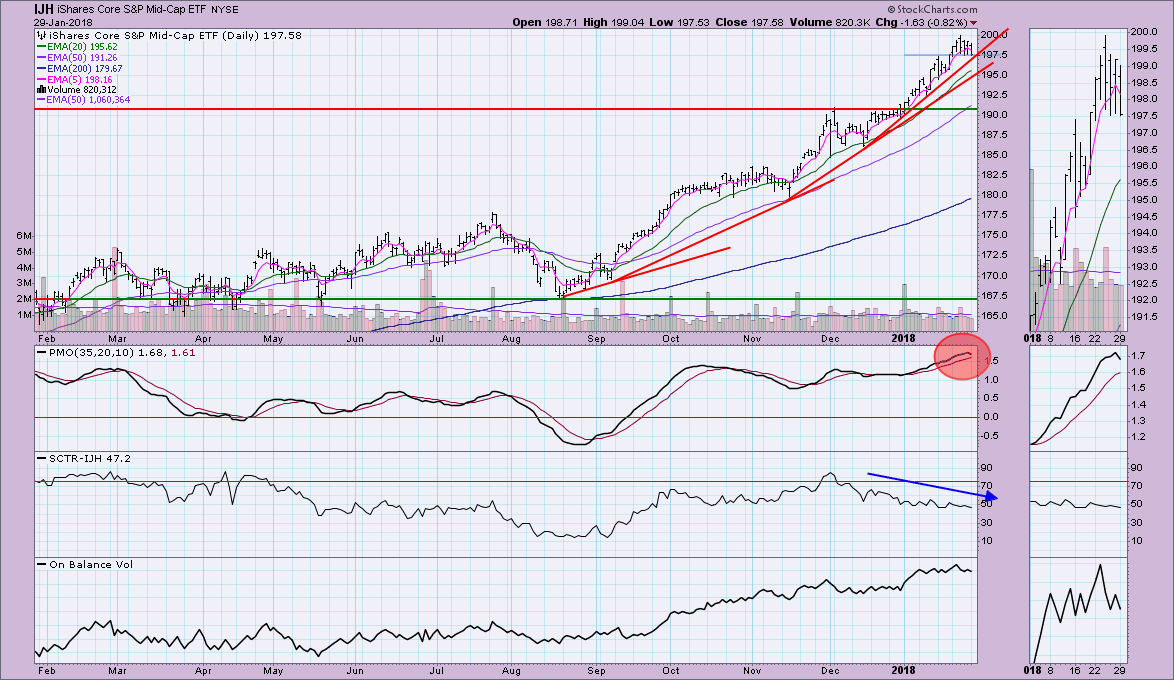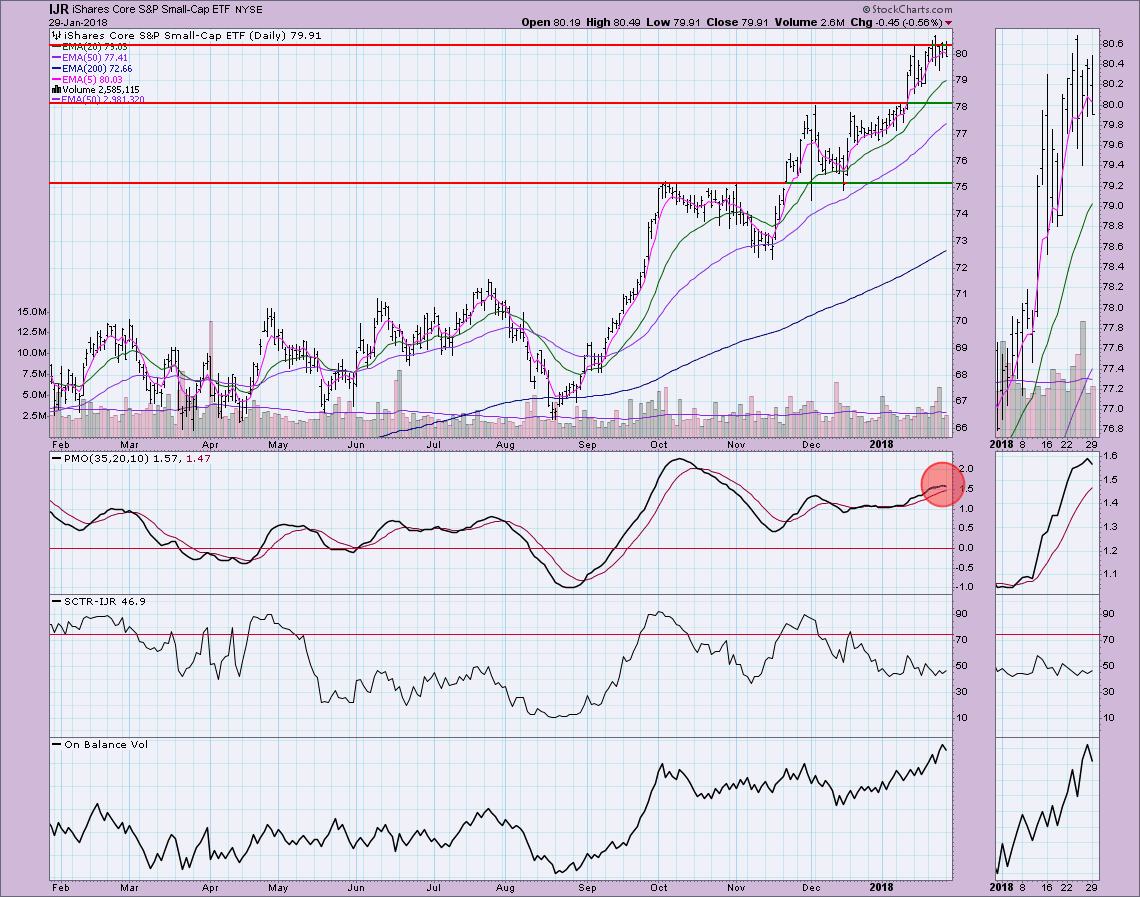
It is very tough to find weakness in the major indexes as they continue to fly higher. However, I was reviewing my DecisionPoint LIVE ChartList and noted that we are seeing a few warning signs on the small and mid-cap ETFs, IJR and IJH.
Currently, both IJH and IJR have PMOs that have topped. All of the major large cap indexes that we follow on the DecisionPoint Scoreboards (NDX, OEX, Dow, SPX) have PMOs that are rising. Relatively speaking, IJH has more problems than IJR. The mid-caps topped last week and have yet to set a new intraday high. Price is now sitting along dual support at $197.50 and along the rising bottoms trend line. The SCTR is starting to trend lower and we saw a sharp drop in OBV tops last week as well.
As I said, IJR isn't quite as negative, but the PMO has topped and price is struggling mightily to close above resistance. The OBV volume pattern looks good, but the SCTR is flattening.
Conclusion: We need some decline and it could be that we are finally seeing some deterioration that could result in a pullback. The struggle with overhead resistance and the PMO tops on IJH and IJR are caution flags. Normally I'd be more concerned about the PMO tops, but the new normal is that bearish indicators result in pauses and consolidation, not a major pullback.
Helpful DecisionPoint Links:
DecisionPoint Shared ChartList and DecisionPoint Chart Gallery
Price Momentum Oscillator (PMO)
Swenlin Trading Oscillators (STO-B and STO-V)
Technical Analysis is a windsock, not a crystal ball.
Happy Charting!
- Erin
**Don't miss DecisionPoint Commentary! Add your email below to be notified of new updates"**


