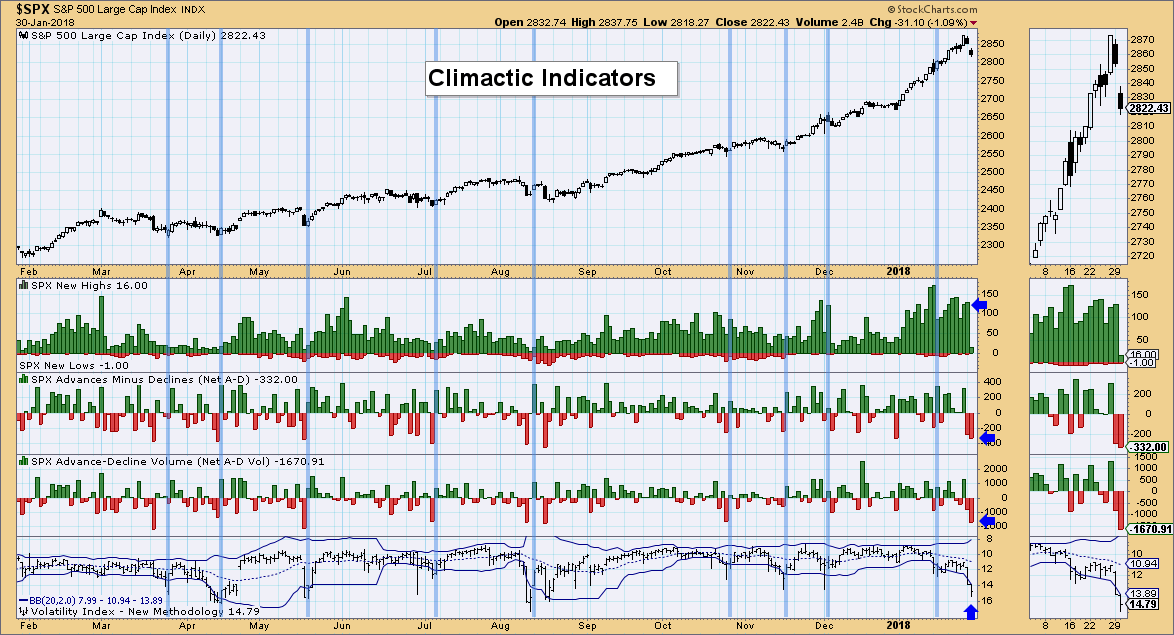
One chart that I have been watching very closely is the DecisionPoint Climactic Indicator chart. I use this chart to give me an idea of very short-term sentiment and how to use it to determine possible tops and bottoms. Today I'm seeing some extremes that could be telling us to expect a turnaround by week's end. Granted it's been only one day of real decline, but many viewers of MarketWatchers LIVE were hinting at some major discomfort with today's price action which to me proves the point that sentiment moved very bearish today. Sentiment is contrarian, so this is bullish for the very short term.
Before I go through the chart, I want to point out that I use an inverted scale for the $VIX. When using it as a short-term sentiment indicator, when the $VIX gets very high, sentiment is very bearish so it is bullish for the market and suggests the market is "oversold" in the very short term. I think of 'oversold' as indicators bottoming, not topping. So to avoid the confusion for my brain, I invert the scale.
The breadth readings are very climactic to the negative side and the VIX has punctured the bottom Bollinger Band for a second time. This can be read as an initiation or an exhaustion. Given yesterday's decline along with today's price decline, I would view this as a selling exhaustion. You'll note that with similar conditions, like in April and October 2017, it leads to a rally.
Conclusion: This is an extraordinary bull market. It cannot go up everyday, but it tells us when it pauses or sells off like today with sentiment being very bearish, we should expect it to be an exhaustion. It may require another down day, but excessive pessimism in the short-term generally leads to rallies.
P.S. I'm drafting an article that compares the MACD, PPO and PMO. Stay tuned!
Helpful DecisionPoint Links:
DecisionPoint Shared ChartList and DecisionPoint Chart Gallery
Price Momentum Oscillator (PMO)
Swenlin Trading Oscillators (STO-B and STO-V)
Technical Analysis is a windsock, not a crystal ball.
Happy Charting!
- Erin
**Don't miss DecisionPoint Commentary! Add your email below to be notified of new updates"**


